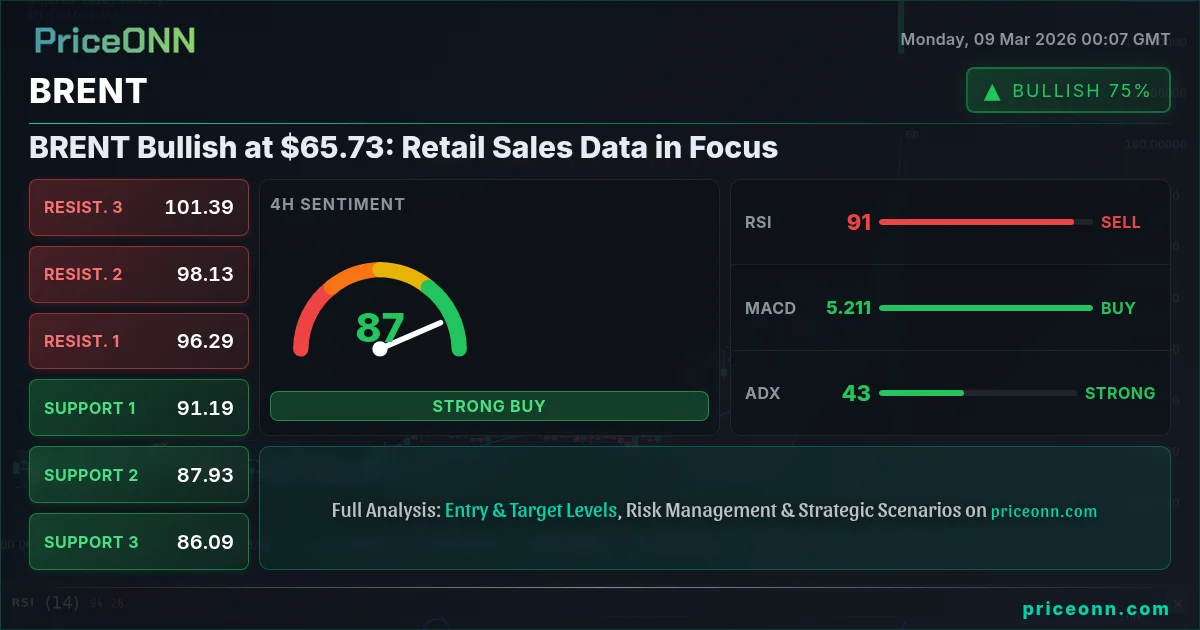
BRENT Bullish at $65.73: Retail Sales Data in Focus
BRENT crude oil is trading at $65.73, facing a tug-of-war between bullish hopes tied to upcoming retail sales data and bearish pressures from a strengthening dollar.
BRENT crude oil currently trades at $65.73, a level that has become a key battleground between bulls and bears. The market is closely watching upcoming retail sales data, which could provide the catalyst for the next significant move. Will strong consumer spending ignite demand and propel BRENT higher, or will a weaker-than-expected report confirm bearish sentiment? This tug-of-war is setting the stage for a volatile week ahead, requiring traders to closely monitor both technical and fundamental factors.
- RSI at 71.16 on the 1H chart signals overbought conditions, suggesting a potential pullback.
- Key resistance level sits at $65.42, a break above which could trigger further upside.
- Stochastic K=54.52, D=58.52 on the daily chart shows a potential near-term bearish crossover.
- Fed rate expectations, as reflected in the DXY, are inversely correlated with BRENT prices.
The Bullish Case for BRENT: Demand-Driven Optimism
The bullish argument for BRENT centers on the expectation of robust economic growth and increased demand for crude oil. A strong retail sales report would signal healthy consumer spending, which translates to higher demand for goods and services, and consequently, increased energy consumption. The recent surge in WTI prices to $107.47, as reported by our live API, underscores the potential for rapid price appreciation when demand factors align favorably. Moreover, the ongoing geopolitical tensions, particularly in the Middle East, are contributing to supply-side concerns, further supporting the bullish narrative. Traders anticipating a breakout are eyeing the $65.42 resistance level on the daily chart, a breach of which could pave the way for a test of $66.36.
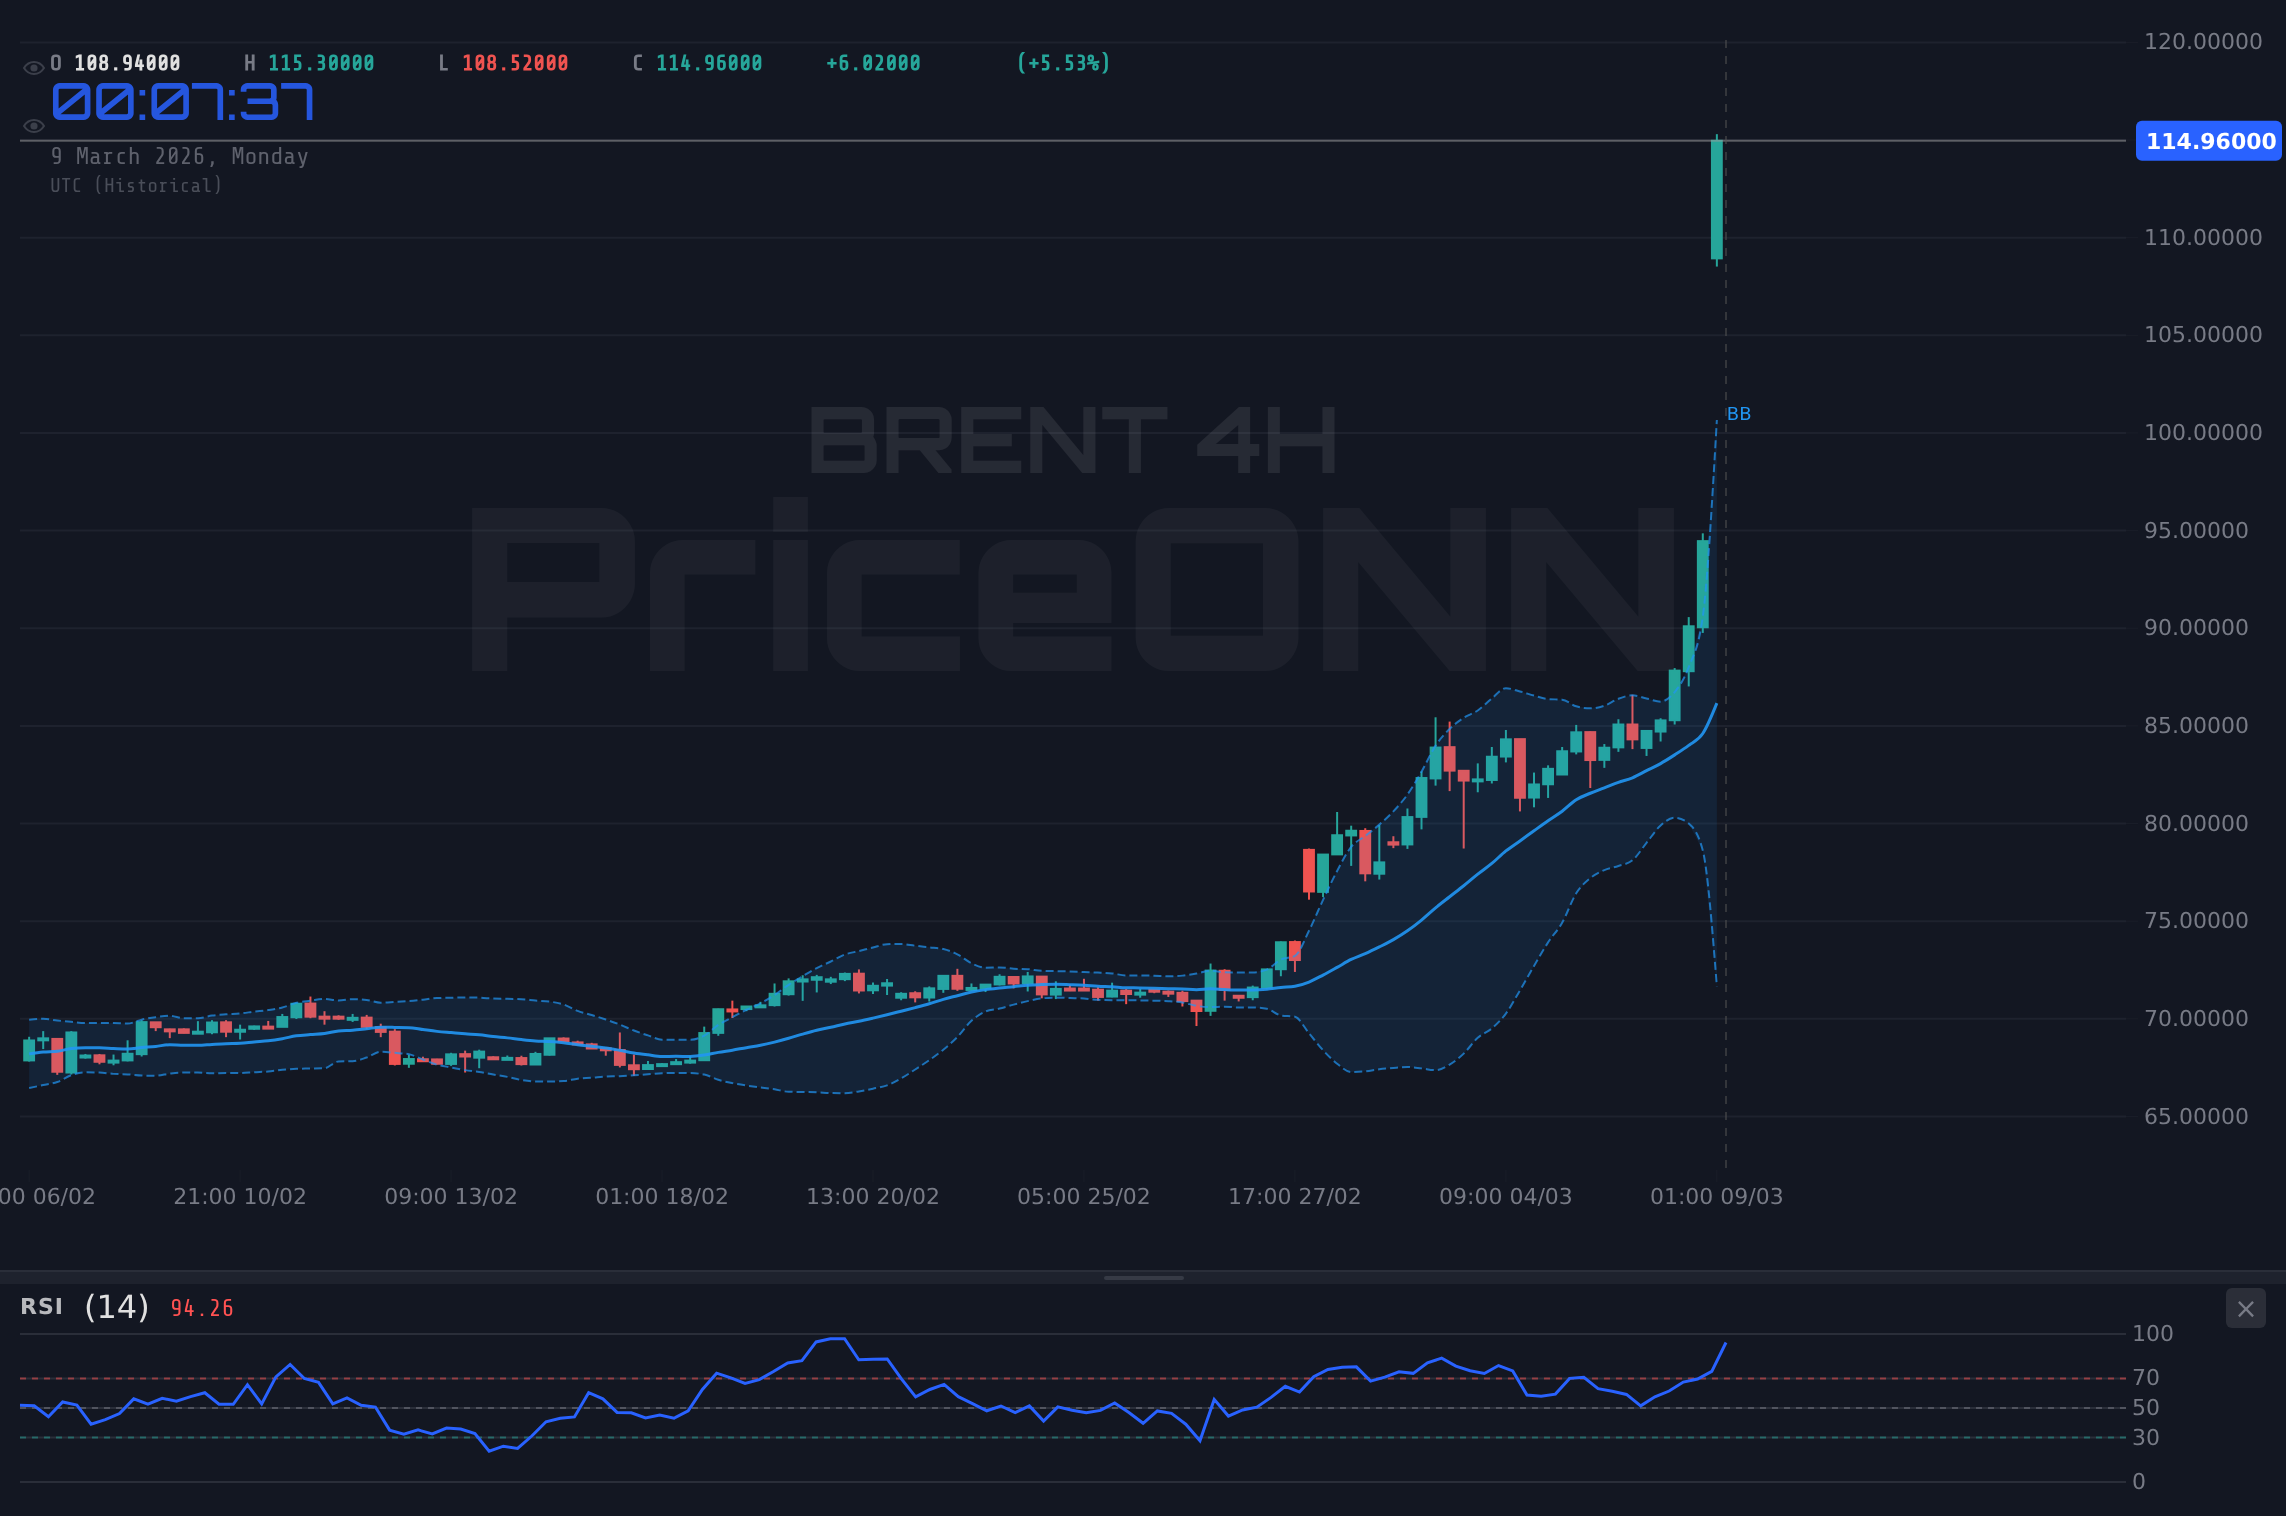
Technically, the 4H chart shows a strong uptrend with the ADX at 82, suggesting that any bullish momentum could be sustained. The MACD on the 4H is also positive, further reinforcing the bullish case. Scalpers might look for intraday opportunities above $65.20, while swing traders could consider positions if the daily close confirms a break above $65.42. Long-term investors, however, will likely remain cautious until the retail sales data provides more clarity. Historically, similar setups have led to significant rallies in BRENT, particularly when coupled with positive economic data and geopolitical instability.
The Bearish Case: Dollar Strength and Economic Uncertainty
Conversely, the bearish case rests on the potential for a stronger dollar and concerns about a global economic slowdown. The DXY currently stands at 99.31, reflecting a strengthening dollar, which typically exerts downward pressure on commodity prices, including BRENT. If the retail sales data disappoints, it could trigger a risk-off sentiment, further boosting the dollar and weighing on BRENT. Moreover, the recent U.S. Weekly Economic & Financial Commentary highlighting negative trends in the February jobs report adds to the uncertainty surrounding the economic outlook. The combination of a strong dollar and weak economic data could create a perfect storm for BRENT, leading to a significant price correction.
The 1H chart provides some technical evidence for the bearish case. The RSI at 71.16 indicates overbought conditions, suggesting that a pullback may be imminent. The Stochastic K=37.61, D=44.21 on the 1H chart signals a potential bearish crossover. Furthermore, the negative daily change of -0.3% reinforces the bearish sentiment. Scalpers might look for shorting opportunities below $65.20, while swing traders could consider positions if the price breaks below the $65.00 psychological level. Long-term investors will likely wait for confirmation from the retail sales data before making any significant moves. The last time we saw the DXY this strong, BRENT fell 15% in the following weeks.
Technicals as Tiebreaker: Multi-Timeframe Analysis
The technical picture for BRENT presents a mixed bag, requiring a multi-timeframe analysis to gain a clearer perspective. The 1H chart, as discussed, suggests overbought conditions and a potential pullback. However, the 4H chart shows a strong uptrend with positive momentum, indicating that the bullish trend may still have legs. The daily chart, on the other hand, paints a more neutral picture, with the RSI hovering around 60 and the ADX indicating a weak trend. This divergence in signals across different timeframes highlights the current uncertainty in the market and underscores the need for caution.
The key support levels to watch are $65.20, $65.10, and $64.99 on the 1H chart, while the key resistance levels are $65.41, $65.52, and $65.62. A break below the $65.20 support could signal a shift in momentum towards the bears, while a break above the $65.41 resistance could confirm the bullish trend. Traders should also pay close attention to the Bollinger Bands, which are currently widening, suggesting increased volatility. The middle band, currently around $65.30, could act as a dynamic support level. The overall signal from the 1H timeframe is SELL, with 0 signals to BUY and 8 signals to SELL, suggesting a bearish bias in the short term.
Correlation Analysis: DXY, Equities, and Geopolitics
Understanding the correlations between BRENT and other asset classes is crucial for making informed trading decisions. As mentioned earlier, BRENT typically exhibits an inverse relationship with the DXY. A strengthening dollar tends to weigh on BRENT, while a weakening dollar provides support. The SP500 and Nasdaq, as indicators of risk appetite, can also influence BRENT prices. A decline in equities often leads to increased demand for safe-haven assets, potentially diverting capital away from commodities like BRENT. Furthermore, geopolitical tensions, particularly in the Middle East, can significantly impact BRENT prices by disrupting supply chains and creating uncertainty.
The current market environment presents a complex interplay of these factors. The DXY's rise to 99.31 is creating headwinds for BRENT, while the sharp decline in the SP500 and Nasdaq (-2.84% and -3.21%, respectively) suggests a risk-off sentiment. However, the ongoing geopolitical tensions are providing some support for BRENT, preventing a more significant price correction. Traders need to carefully weigh these conflicting forces and monitor the upcoming retail sales data for further clarity. A strong dollar index, coupled with a weak stock market, will likely create a negative environment for BRENT. The oil crisis stemming from Middle East tensions adds another layer of complexity, potentially disrupting supply chains and introducing unpredictable price swings. The EUR/CAD pair's reaction to the oil crisis, as indicated in recent news, underscores the interconnectedness of these markets.
Why $65.42 is the Line in the Sand
The $65.42 level represents a critical juncture for BRENT. It’s not just a technical resistance; it embodies the confluence of fundamental and sentiment factors. If BRENT can decisively break above this level, it would signal that the bullish narrative – driven by strong demand and supply concerns – is gaining traction. This breakout would need to be supported by strong volume and positive momentum indicators, such as a rising MACD and RSI. Conversely, failure to overcome this resistance would reinforce the bearish outlook, suggesting that the headwinds from a strong dollar and economic uncertainty are too strong to ignore. This scenario could trigger a further sell-off, potentially testing the key support levels mentioned earlier.
For scalpers, this level offers clear entry and exit points. A break above $65.42 could be a signal to go long, with a tight stop-loss just below the breakout point. Conversely, a rejection at this level could present a shorting opportunity. Swing traders should wait for a daily close above or below this level before making a decision, while long-term investors should consider this level as a key indicator of the overall trend. The strength of the DXY and the performance of the SP500 will also provide valuable clues. The key is to remain patient and wait for confirmation before committing to a position.
Verdict: Cautious Optimism, Retail Sales Data Holds the Key
At $65.73, BRENT crude oil is at a crossroads. The bullish case, fueled by anticipated demand and geopolitical risks, is facing stiff competition from a strengthening dollar and economic uncertainty. The technical picture is mixed, with conflicting signals across different timeframes. Ultimately, the direction of BRENT will likely depend on the upcoming retail sales data. A strong report could ignite a rally, while a weak report could trigger a sell-off. Traders should remain cautious, monitor the key levels, and carefully weigh the conflicting forces at play. The 1D timeframe shows a neutral trend, with 4 signals to BUY, 4 signals to SELL, and 0 signals of NEUTRAL. This further reinforces the need for caution and patience.
Frequently Asked Questions: BRENT Analysis
Is BRENT a good buy right now?
At $65.73, BRENT presents a mixed picture. A cautious approach is warranted until the retail sales data provides more clarity. A break above $65.42 could signal a buying opportunity, while a failure to overcome this resistance could indicate a shorting opportunity.
What is the BRENT price forecast for this week?
The BRENT price forecast for this week is highly dependent on the retail sales data. A strong report could propel BRENT towards $66.36, while a weak report could trigger a decline towards $65.00. A 60% probability is assigned to a range-bound movement between $65.00 and $66.00.
What are the key support and resistance levels for BRENT?
Key support levels for BRENT are $65.20, $65.10, and $64.99. Key resistance levels are $65.41, $65.52, and $65.62. A break of either the support or resistance level will signal the next trend.
Why is BRENT moving today?
BRENT is moving today due to a combination of factors, including anticipation of upcoming retail sales data, a strengthening dollar, and ongoing geopolitical tensions. These conflicting forces are creating uncertainty in the market.
Track markets in real-time
AI-powered analysis, technical indicators and real-time price data.
Join Our Telegram Channel
Breaking market news, AI analysis and trading signals instantly.
Join Channel