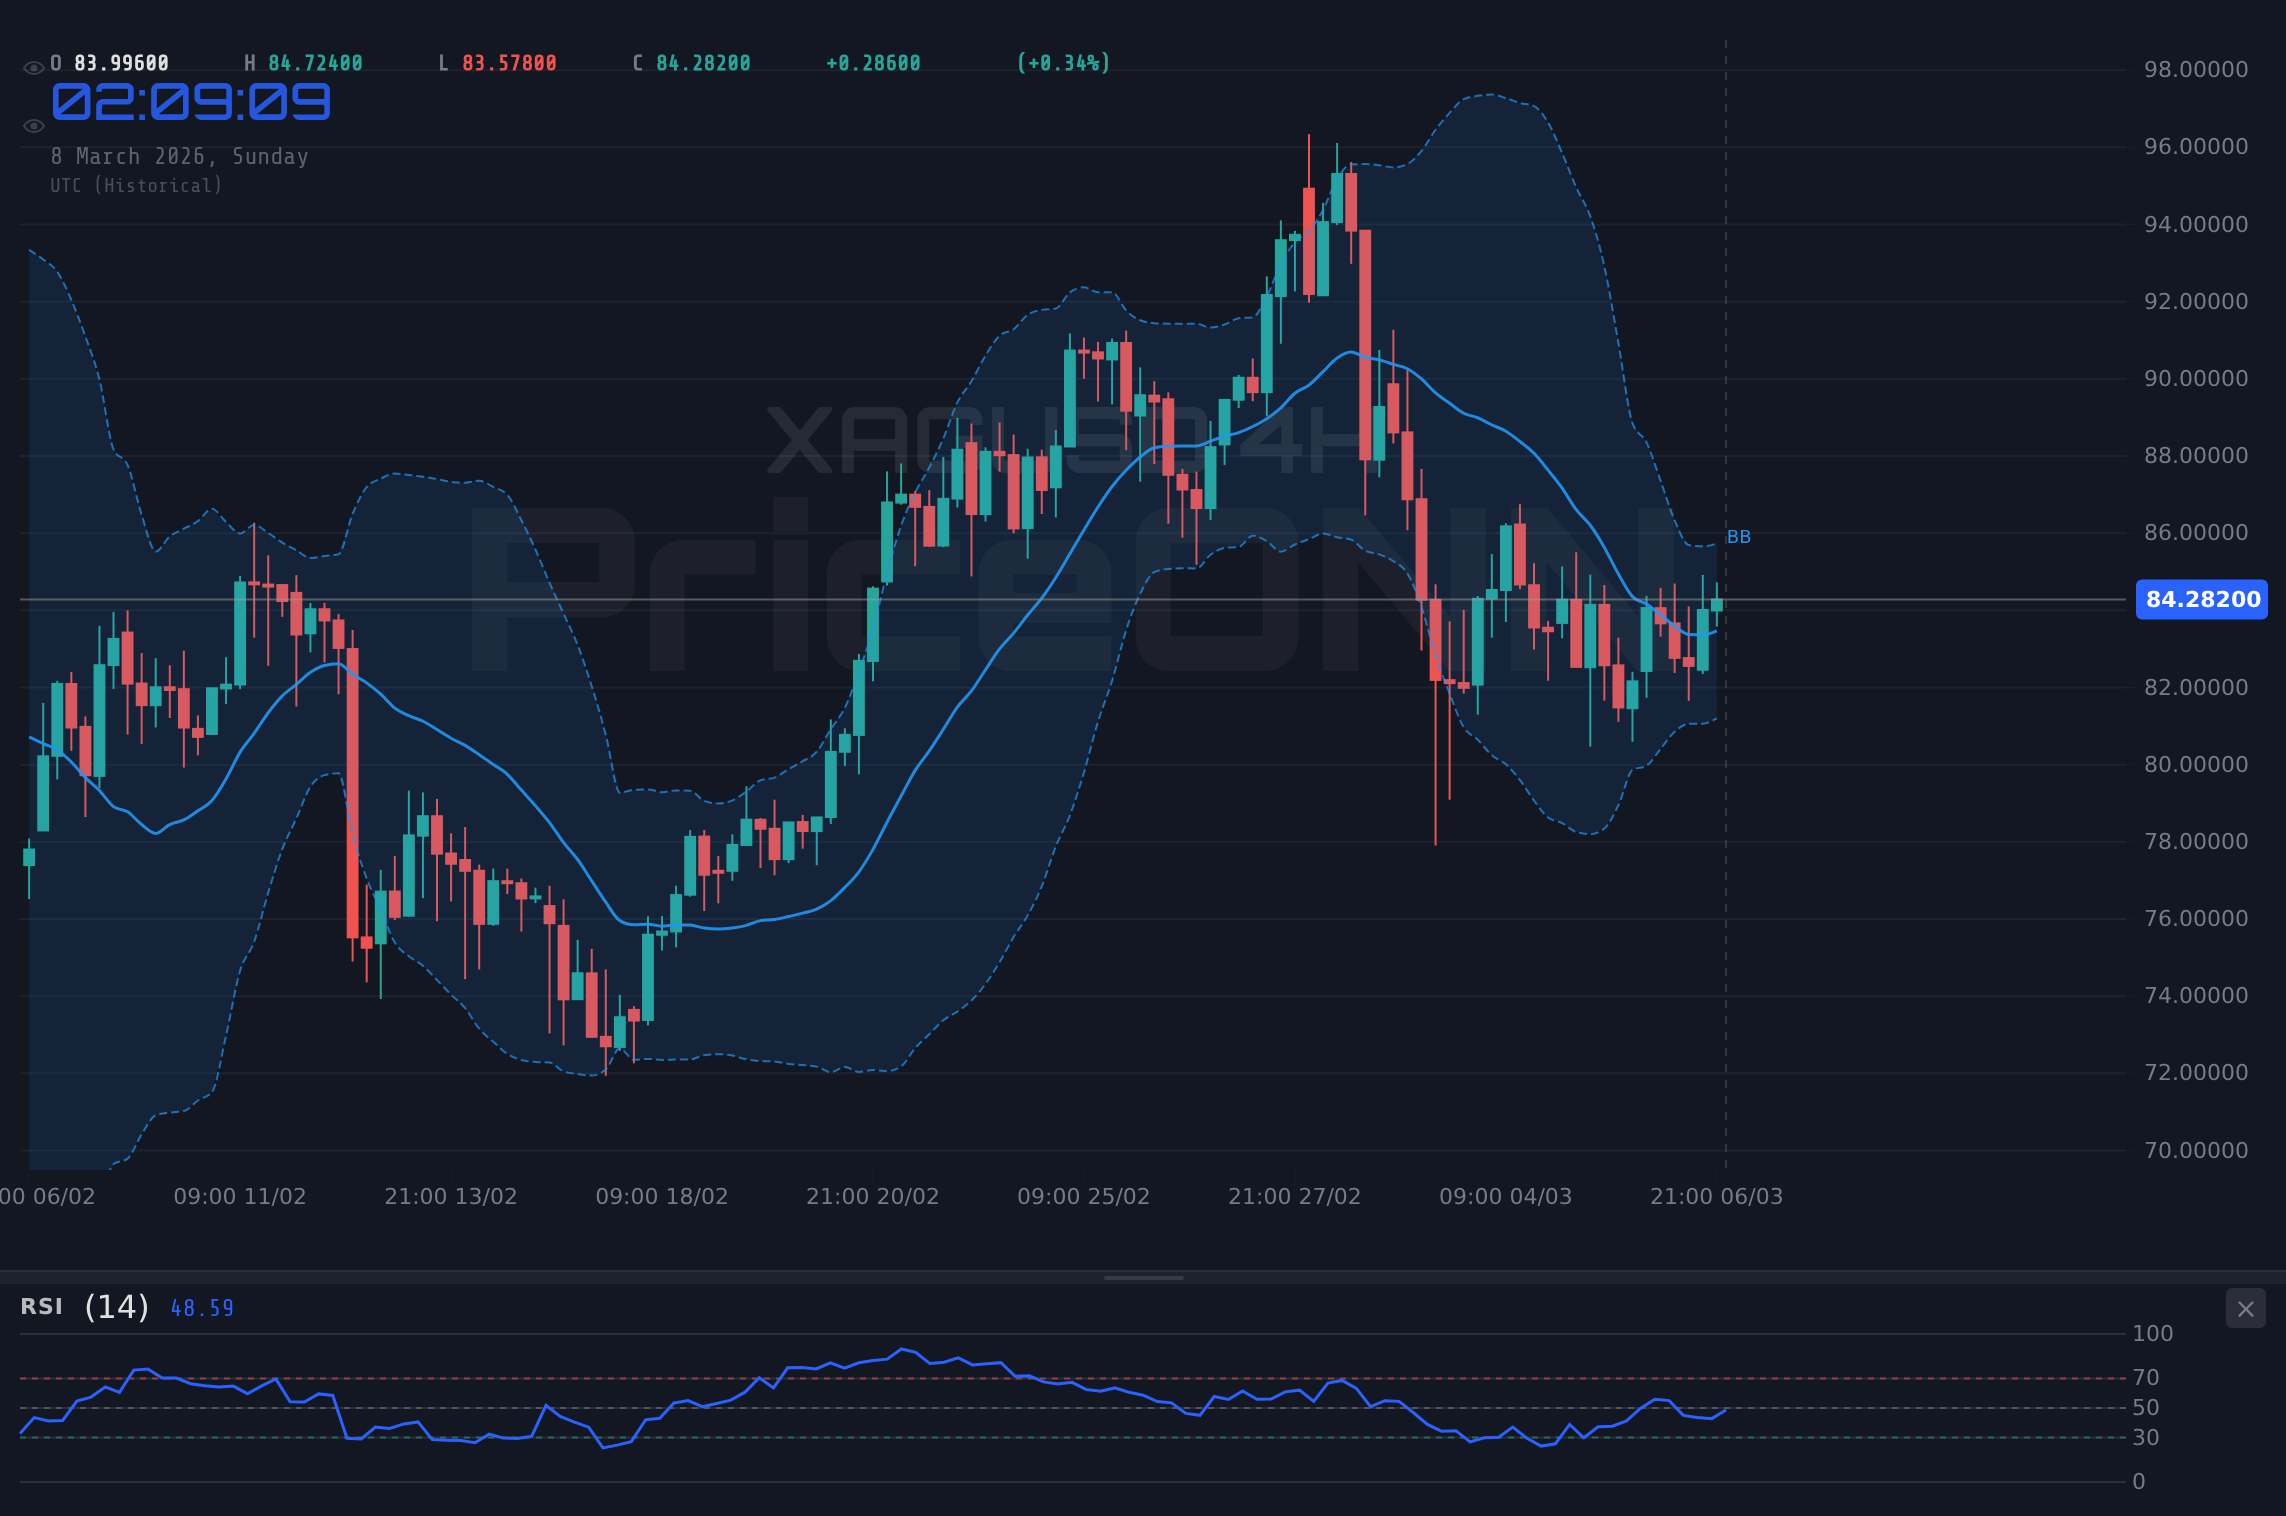
Silver (XAGUSD) finds itself at a critical juncture, closing last Friday at $84.23. The tug-of-war between bullish hopes and bearish realities is palpable, with the price action heavily influenced by macroeconomic developments and shifting market sentiment. The question now is whether the bears will maintain control or if a confluence of factors will enable the bulls to stage a comeback.
- XAGUSD closed last Friday at $84.23, facing bearish pressure amid global economic uncertainties.
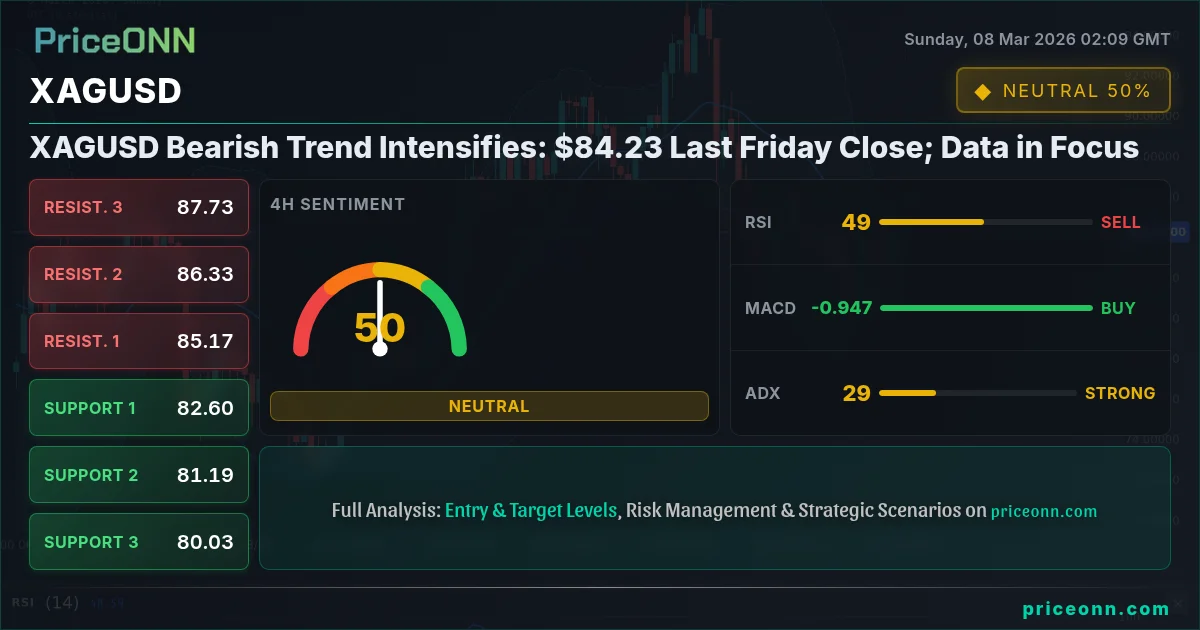
- Key support level to watch is $81.44, a break below could trigger further declines.
- RSI at 49.7 on the daily timeframe suggests a neutral-to-bearish bias, indicating potential for further downside.
- Upcoming US economic data, including inflation figures, will be pivotal in determining XAGUSD's near-term direction.
The Bear Case for XAGUSD
The bearish narrative for silver is rooted in several factors, primarily the strength of the US dollar and concerns about global economic growth. The DXY (Dollar Index) currently sits at 98.57, and a strengthening dollar typically exerts downward pressure on precious metals, including silver. This inverse correlation stems from silver being priced in dollars; a stronger dollar makes silver more expensive for buyers using other currencies, dampening demand. Furthermore, anxieties surrounding global economic growth, particularly concerns about a potential slowdown in China- a major consumer of industrial silver- contribute to bearish sentiment. As industrial demand constitutes a significant portion of silver's overall demand profile, any weakening in this area can weigh heavily on prices.
Technically, the 4-hour timeframe paints a bearish picture. The ADX (Average Directional Index) stands at 29.77, signaling a strong downtrend. This indicator measures the strength of a trend, and a reading above 25 typically suggests that the trend is well-established. The RSI (Relative Strength Index) at 48.71, while not yet in oversold territory, indicates that bearish momentum is present. Furthermore, the Stochastic oscillator (%K at 57.22 and %D at 47.54) currently gives a bullish signal, but this could be a temporary retracement within a larger downtrend. The key level to watch is the resistance at $83.89. A failure to break above this level would reinforce the bearish outlook.
Adding to the bearish outlook, consider the recent news. As reported by FXStreet, concerns about a widening economic divergence could further pressure XAGUSD. If the global oil crisis continues to amplify economic disparities, currencies like the Euro and Canadian Dollar may face headwinds, indirectly impacting silver's appeal as an alternative asset. This is especially relevant given silver's dual role as both a precious metal and an industrial commodity. A weaker global economic backdrop could translate into reduced industrial demand, further exacerbating the bearish trend.
The Bull Case for XAGUSD
Despite the prevailing bearish sentiment, there are arguments to be made for a potential bullish reversal in silver. One key factor is its safe-haven appeal during times of geopolitical uncertainty. The escalating tensions in the Middle East, as reported by various news outlets, could drive investors towards safe-haven assets like gold and silver. If the conflict intensifies, the demand for precious metals could surge, providing a boost to XAGUSD. Silver's role as a hedge against inflation should also be considered. While inflation concerns have somewhat subsided recently, they remain a persistent undercurrent in the global economy. If inflation were to unexpectedly accelerate, silver could regain its luster as a store of value, attracting investor capital.
From a technical perspective, the 1-hour timeframe offers some glimmers of hope for the bulls. The RSI at 55.81 suggests a neutral-to-bullish bias, indicating that upward momentum could be building. The MACD (Moving Average Convergence Divergence) shows positive momentum, with the MACD line above the signal line. This suggests that the short-term trend is upward. However, the ADX at 17.84 indicates a weak trend, meaning that the bullish momentum may not be sustainable. The key level to watch is the resistance at $84.65. A sustained break above this level could signal a shift in sentiment and pave the way for further gains.
The recent report from PriceONN highlights that silver surges above $86 due to strong investment demand. Although the current price is at $84.23, a strong investment demand could increase the price of silver and change the market sentiment.
Technicals as a Tiebreaker: Multi-Timeframe Analysis
The mixed signals across different timeframes highlight the current market indecision. The 1-hour chart suggests a potential short-term bullish retracement, while the 4-hour and daily charts lean towards a bearish continuation. To gain a clearer picture, it's essential to consider the interplay between these timeframes. A successful bullish scenario would involve the price breaking above the $84.65 resistance on the 1-hour chart, followed by a sustained move above the $83.89 resistance on the 4-hour chart. This would signal a shift in momentum and potentially trigger a larger rally. Conversely, a failure to hold the $84.16 support on the 1-hour chart could accelerate the bearish trend, leading to a test of the $81.44 support on the 4-hour chart.
The daily chart provides a broader perspective. The RSI at 49.7 is hovering near the neutral level, suggesting that the market is waiting for a catalyst to determine the next direction. The MACD histogram is showing negative momentum, but the signal line is flattening, indicating that the bearish momentum may be waning. The Stochastic oscillator (%K at 29.79 and %D at 56.96) gives a bearish signal, but the %K line is approaching oversold territory, suggesting that a potential bounce could be in the cards. The ADX at 18.15 confirms the lack of a strong trend on the daily timeframe, further emphasizing the market's indecision.
The key levels to watch on the daily chart are the $84.95 resistance and the $79.92 support. A break above the resistance could signal a long-term bullish reversal, while a break below the support could confirm the bearish trend and lead to further declines. The overall signal based on the daily chart is to sell.
Correlation Analysis: DXY, Equities, and Oil
Understanding the correlations between XAGUSD and other asset classes can provide valuable insights into potential price movements. The DXY (Dollar Index), as mentioned earlier, typically has an inverse relationship with silver. A strengthening dollar often puts downward pressure on silver prices, while a weakening dollar tends to support them. Therefore, monitoring the DXY's movements is crucial for XAGUSD traders. The SP500 and Nasdaq indices, representing the broader equity market, can also influence silver prices. A risk-off environment, characterized by declining equity prices, often leads to increased demand for safe-haven assets like silver. Conversely, a risk-on environment, with rising equity prices, may diminish silver's appeal. Oil prices can also indirectly impact silver through their influence on inflation expectations. Rising oil prices can fuel inflation concerns, potentially boosting silver's role as an inflation hedge. With the current WTI price at $90.66 and Brent at $65.73, the high price of WTI suggests silver may increase in value to hedge against inflation.
Currently, the DXY is at 98.57, and the SP500 is at 6743.17. These conflicting signals highlight the uncertainty in the market. The SP500’s decline suggests risk aversion, which could support silver, but the strong dollar is a headwind.
Economic Data and Upcoming Events: The Week Ahead
The economic calendar for the upcoming week is packed with data releases that could significantly impact XAGUSD. On Monday, March 9th, Japan will release data. However, the most important data will be from the US on Tuesday, March 10th. The data releases include inflation figures and consumer confidence indices. Stronger-than-expected inflation data could boost silver's appeal as an inflation hedge, while weaker-than-expected data could weigh on prices. Consumer confidence numbers will provide insights into the strength of the US economy, influencing risk sentiment and potentially impacting silver's safe-haven demand. Investors should closely monitor these releases and adjust their positions accordingly. The EUR data on Wednesday, March 11, could also have a ripple effect, particularly if it signals weakness in the European economy.
According to Reuters, Fed officials are closely monitoring inflation data to determine the future course of monetary policy. If the data suggests that inflation is proving more persistent than anticipated, the Fed may be forced to maintain its hawkish stance, potentially strengthening the dollar and weighing on silver. Conversely, if the data indicates that inflation is moderating, the Fed may adopt a more dovish approach, potentially weakening the dollar and supporting silver.
Historical Perspective: Silver's Price Swings
To better understand the current market dynamics, it's helpful to examine silver's historical price movements. Silver has a long history of volatility, often experiencing sharp price swings in response to economic and geopolitical events. During periods of high inflation in the 1970s, silver prices soared as investors sought refuge from currency debasement. The 2008 financial crisis also triggered a surge in silver demand as investors flocked to safe-haven assets. However, silver has also experienced significant price declines, often triggered by rising interest rates, a strengthening dollar, or a slowdown in global economic growth. A review of past market cycles reveals that silver tends to outperform during periods of economic uncertainty and rising inflation, while underperforming during periods of economic stability and low inflation. This historical pattern suggests that the current market environment, characterized by mixed economic signals and geopolitical tensions, could lead to continued volatility in silver prices.
Different Trader Types: What to Watch
The optimal strategy for trading XAGUSD will depend on the trader's time horizon and risk tolerance. Scalpers, who aim to profit from small price movements, should focus on the 1-hour chart and closely monitor key support and resistance levels. A breakout above $84.65 could provide a short-term buying opportunity, while a break below $84.16 could signal a selling opportunity. Swing traders, who hold positions for several days or weeks, should focus on the 4-hour and daily charts and pay close attention to the ADX and RSI indicators. A strong downtrend on the 4-hour chart could present a selling opportunity, while a bullish reversal on the daily chart could signal a buying opportunity. Long-term investors, who hold positions for months or years, should focus on the monthly and yearly charts and consider the fundamental drivers of silver demand, such as inflation expectations, industrial demand, and geopolitical risks. A favorable long-term outlook could justify accumulating silver at current levels, while a bearish outlook may warrant reducing exposure.
Trading precious metals involves significant risk of loss and is not suitable for all investors. Leverage can magnify both gains and losses. Be sure to carefully assess your risk tolerance and financial situation before making any trading decisions.
Frequently Asked Questions: XAGUSD Analysis
Is XAGUSD a good buy right now?
Given the current bearish trend and mixed signals, XAGUSD may not be a good buy right now for short-term gains. However, long-term investors might see value at current levels around $84.23, considering its potential as a safe haven and inflation hedge, waiting for a clearer bullish signal.
What is the XAGUSD price forecast for this week?
The XAGUSD price forecast for this week is cautiously bearish. Key levels to watch are the $84.95 resistance and the $79.92 support. A break below the support could lead to further declines, while a break above the resistance would signal a potential bullish reversal. The probability of a significant bullish move is currently low.
What are the key support and resistance levels for XAGUSD?
Key support levels for XAGUSD are $81.44, $79.92, and $77.67. Key resistance levels are $83.89, $84.65, and $84.95. These levels are derived from the 1-hour, 4-hour, and daily timeframes, providing a multi-timeframe perspective on potential price movements.
Why is XAGUSD moving today?
XAGUSD is currently facing bearish pressure due to a strengthening US dollar, as indicated by the DXY at 98.57, and concerns about global economic growth. These factors are outweighing any potential safe-haven demand stemming from geopolitical tensions.
Track markets in real-time
AI-powered analysis, technical indicators and real-time price data.
Join Our Telegram Channel
Breaking market news, AI analysis and trading signals instantly.
Join Channel