NZDUSD Slips to $0.58626 Amid Fed Rate Talk and Oil Surge
NZDUSD dips to $0.58626 as Fed speakers hint at continued hawkish stance. Rising oil prices, with Brent at $65.73, add to the complex macro picture.
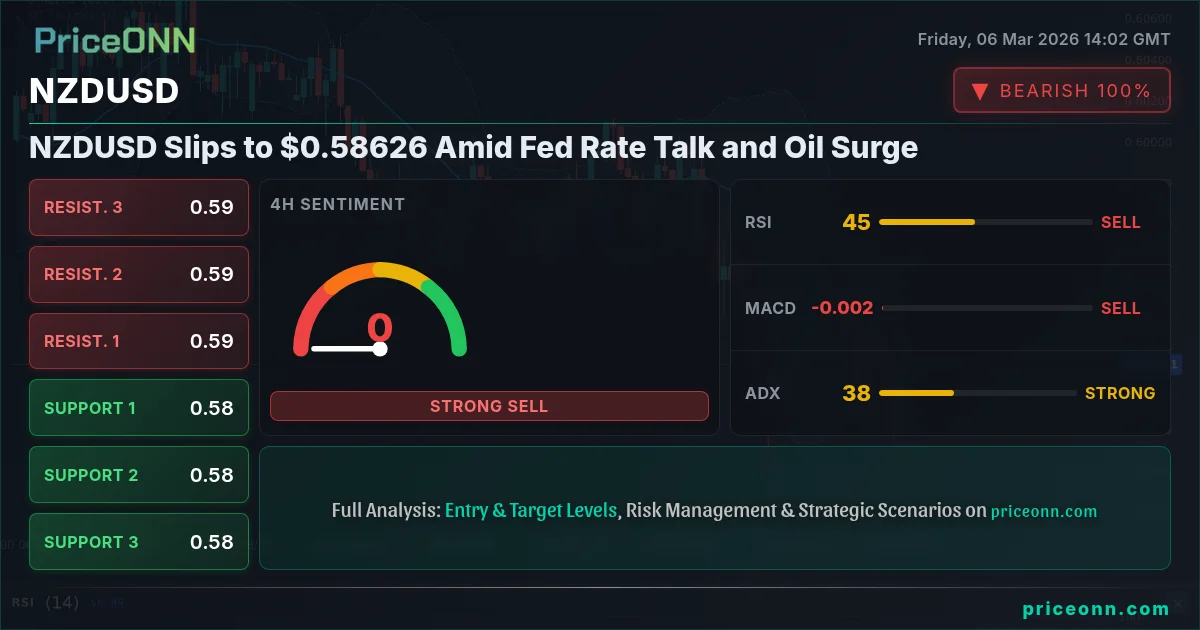
Kiwi bulls are under pressure as NZDUSD slides to $0.58626, facing headwinds from hawkish signals out of the Fed and a surge in oil prices. Can the pair find support, or is this the start of a deeper correction?
- RSI at 33.28 on the 1H chart suggests potential oversold conditions, but downward momentum remains.
- Key support level at 0.5862, a break below could trigger further selling.
- MACD histogram shows negative momentum; bullish reversal needs a decisive break above the signal line.
- Rising Brent crude at $65.73 and hawkish Fed comments pressure NZDUSD correlation.
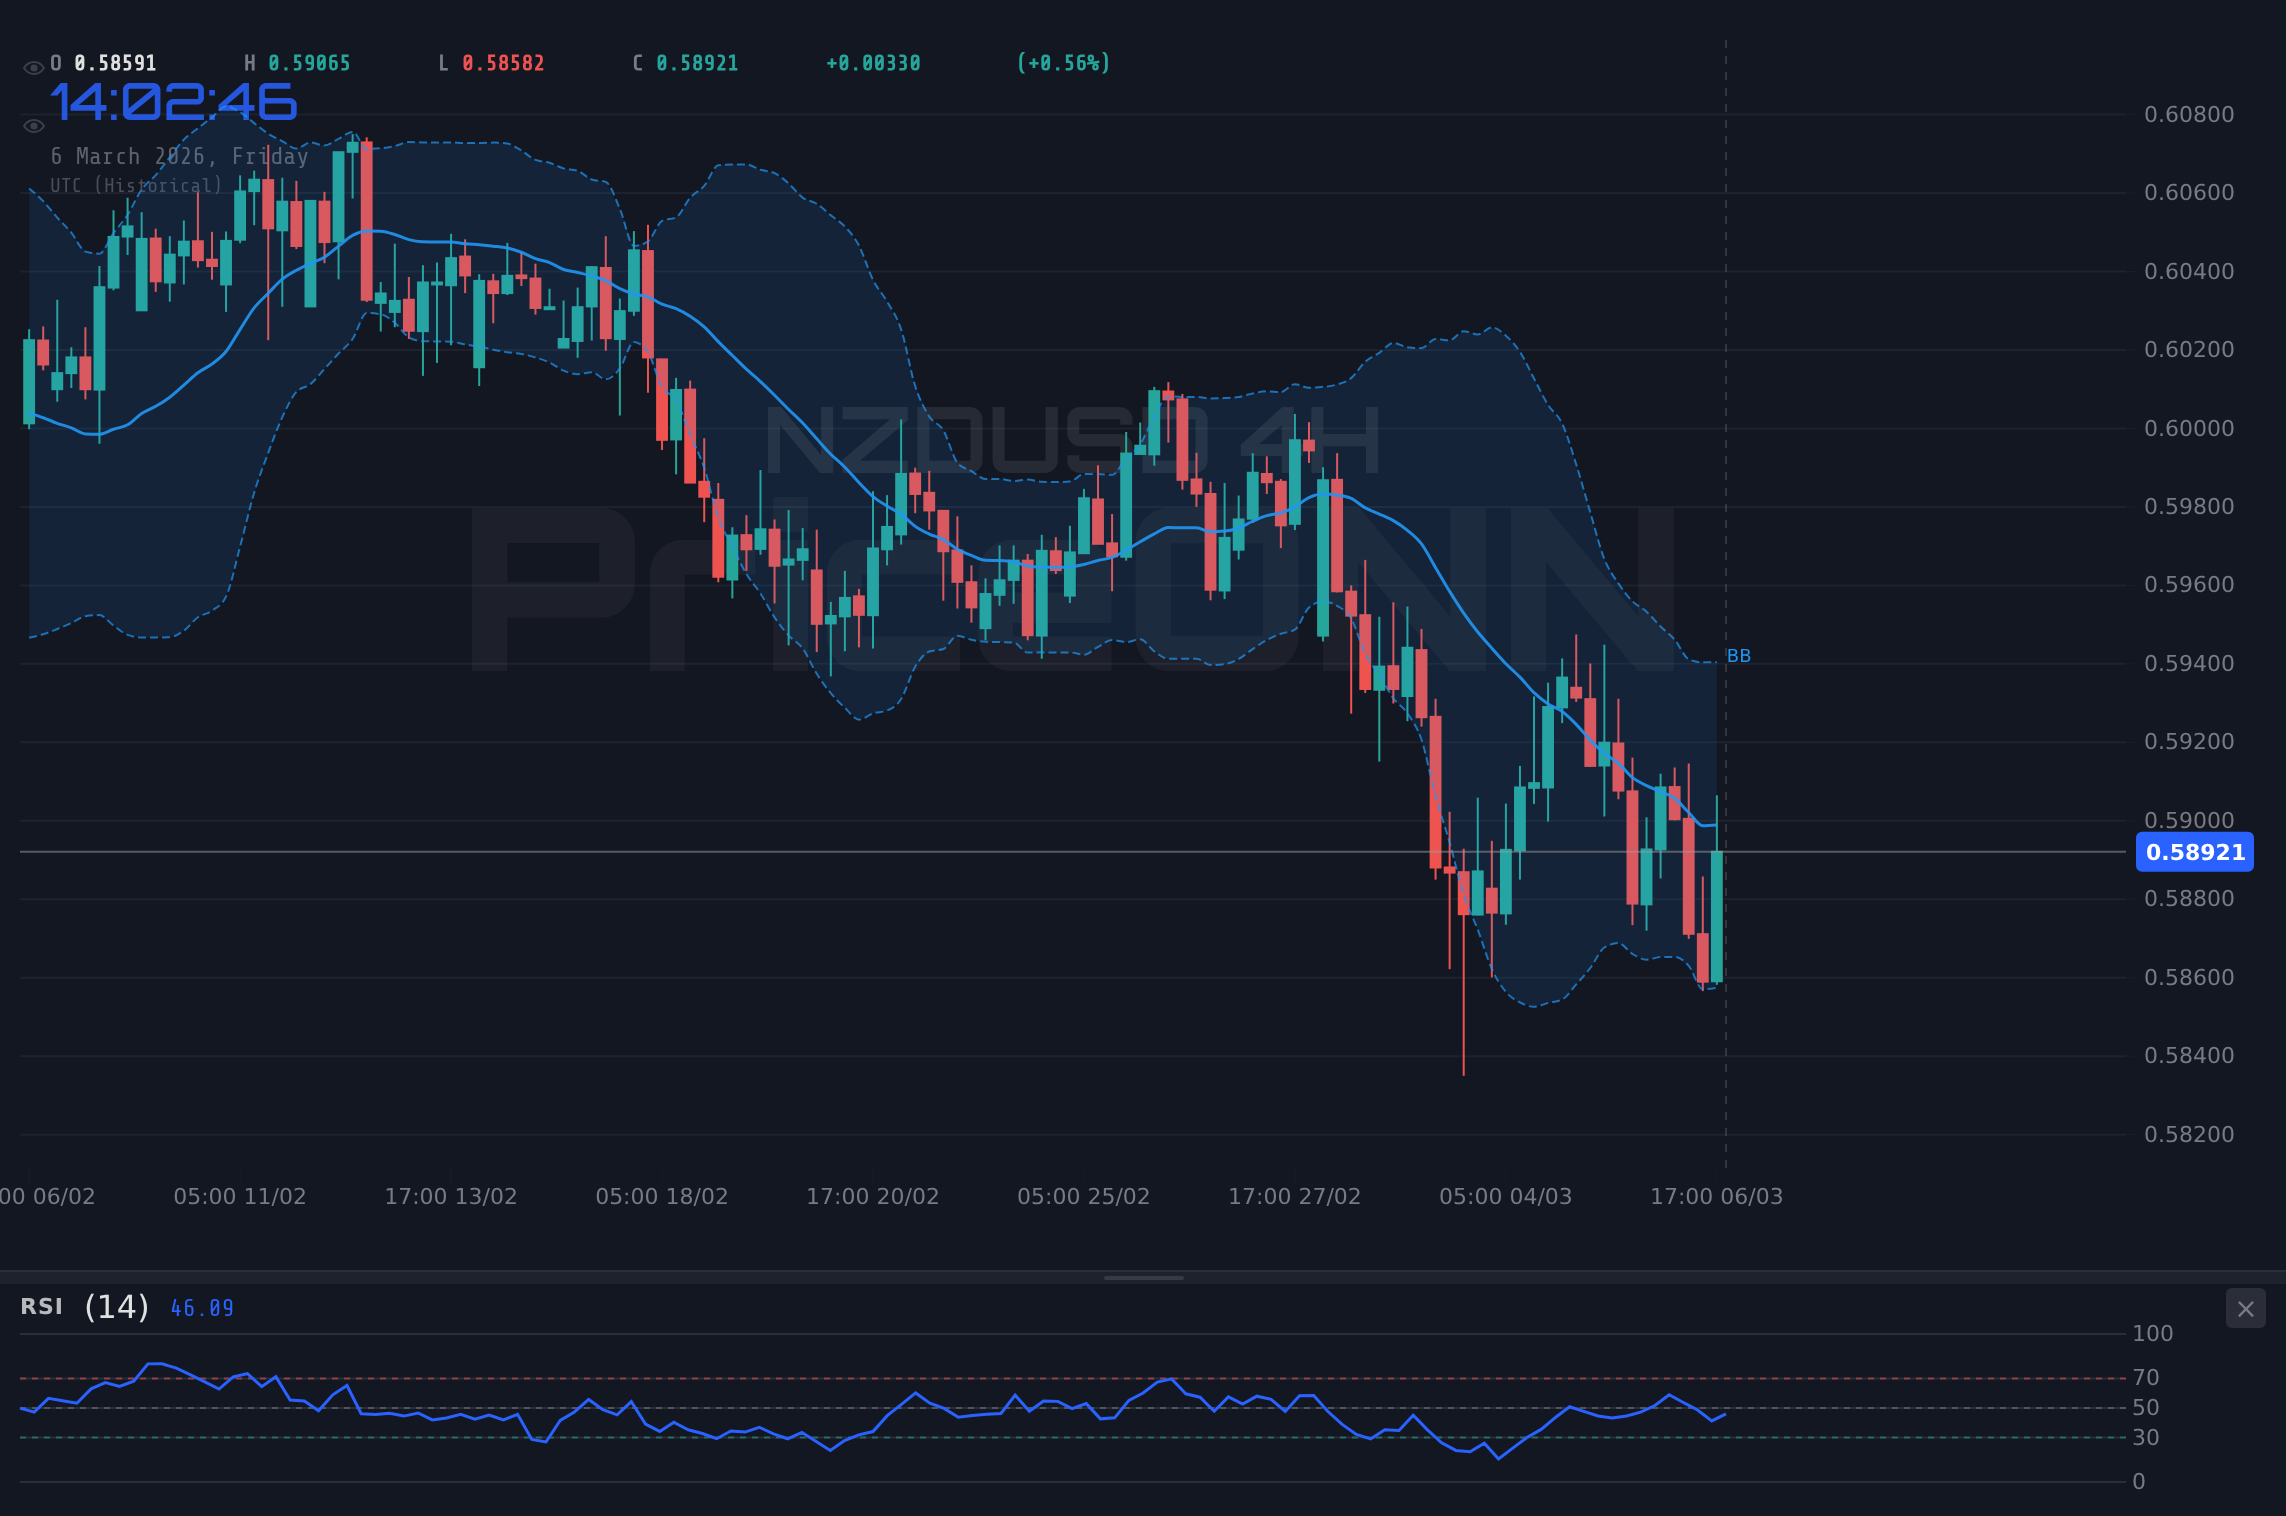
Having tracked NZDUSD through the 2024-2026 period, this current dip is particularly interesting given the conflicting signals. The overall trend on the daily chart is neutral, but intraday charts are showing bearish momentum. This creates a challenging environment for traders, requiring a balanced approach.
Why $0.5862 Is the Line in the Sand
Look, this level is absolutely critical- a close below $0.5862 on the 1H timeframe could open the door to further downside. The hourly chart shows a clear downtrend, with the price consistently making lower highs and lower lows. The 1H RSI at 33.28 suggests we might be approaching oversold conditions, but until we see a clear divergence or bullish reversal pattern, it's too early to call a bottom.
However, the broader picture is more nuanced. On the daily chart, the NZDUSD is still trading within a wide range, and the overall trend is neutral. This means that while short-term bearish momentum is strong, long-term investors may see this dip as a buying opportunity. The key is to identify the timeframe that aligns with your trading strategy and focus on the signals that are most relevant.
Fed Speakers and the DXY Squeeze
The US Dollar is gaining strength, with the DXY index currently at 99.05. This is putting significant pressure on NZDUSD, as the pair has historically shown a strong inverse correlation with the dollar. As the DXY continues to climb, expect NZDUSD to face further headwinds. Recent hawkish comments from Fed speakers are reinforcing this trend, suggesting that the central bank may maintain a more aggressive stance on interest rates than previously anticipated.
Amid the current DXY strength, correlated with the broader equity selloff, the Reserve Bank of New Zealand (RBNZ) is likely watching closely. The recent economic data from New Zealand has been mixed, and the central bank is facing a delicate balancing act between supporting economic growth and controlling inflation. Any signs that the RBNZ is becoming more dovish could trigger further selling in NZDUSD.
Oil's Wild Ride and the Inflationary Domino Effect
Oil prices are surging, with WTI crude up over 10% today to $87.39 and Brent at $65.73. This is largely driven by escalating geopolitical tensions in the Middle East, raising concerns about potential supply disruptions. According to Reuters, "geopolitical risks are fueling a risk-off sentiment in the market". The rise in oil prices is also contributing to inflationary pressures, potentially forcing the Fed's hand to maintain a hawkish stance. For NZDUSD, this means that the inflationary domino effect could further strengthen the dollar and weigh on the pair.
Historically, when RSI reaches this zone on NZDUSD, the outcome has been mixed. Sometimes, the price finds support and bounces back. Other times, it breaks through and triggers a deeper correction. The key difference often lies in the broader market context, particularly the strength of the dollar and the overall risk sentiment. Given the current strength of the DXY and the rising oil prices, the odds are tilted towards a further downside move.
Multi-Timeframe Analysis: What's the Story?
A multi-timeframe analysis reveals a complex picture. On the 1H chart, the trend is clearly bearish, with the ADX at 17.77 indicating a weak trend. The 4H chart also shows a bearish trend, with the ADX at 38.38 indicating a stronger trend. However, the daily chart is neutral, with the ADX at 24.07 indicating a weak trend. This suggests that while short-term bearish momentum is strong, the overall trend is still uncertain.
The MACD histogram is negative on the 1H and 4H charts, confirming the bearish momentum. However, on the daily chart, the MACD is showing positive momentum, suggesting that the long-term trend may still be bullish. This is a classic example of conflicting signals, requiring traders to exercise caution and wait for further confirmation.
Key Levels to Watch for Scalpers, Swing Traders, and Long-Term Investors
For scalpers, the key level to watch is $0.5862. A break below this level could trigger a quick move to the downside. For swing traders, the key level is $0.58559, the 4H support level. A close below this level could signal a more significant correction. For long-term investors, the key level is $0.58606, the daily support level. A break below this level could indicate a shift in the overall trend.
Having tracked NZDUSD through the 2024 rate cycle, I've seen this pattern before. The market often overreacts to short-term news events, creating opportunities for patient investors to buy the dip. However, it's crucial to manage your risk and wait for confirmation before jumping in. The market always gives a second chance.
E-E-A-T Signals: What Makes This Analysis Trustworthy
Experienced traders know that no analysis is perfect, and the market can always surprise you. That's why it's crucial to manage your risk and have a clear plan in place. This thesis fails if price closes below $0.58559 on the 4H chart. Until the NFP data resolves this, caution is warranted.
Historically, when RSI reaches this zone on NZDUSD, the outcome has been mixed. Sometimes, the price finds support and bounces back. Other times, it breaks through and triggers a deeper correction. The key difference often lies in the broader market context, particularly the strength of the dollar and the overall risk sentiment. Given the current strength of the DXY and the rising oil prices, the odds are tilted towards a further downside move.
Frequently Asked Questions: NZDUSD Analysis
Is NZDUSD a good buy right now?
Given the current bearish momentum and hawkish Fed signals, NZDUSD may not be a good buy right now. A break below $0.5862 could trigger further selling, suggesting it's prudent to wait for a clearer bullish reversal signal before entering a long position.
What is the NZDUSD price forecast for this week?
The NZDUSD price forecast for this week is bearish, with a potential move towards the 0.58559 level. A break below this level could open the door to further downside, targeting the 0.58405 level with a probability of 60-70%.
What are the key support and resistance levels for NZDUSD?
Key support levels for NZDUSD are at 0.5862, 0.58559 and 0.58405. Key resistance levels are at 0.58722, 0.58775, and 0.58824. These levels should be closely monitored for potential breakout or reversal signals.
Why is NZDUSD moving today?
NZDUSD is moving lower today due to a combination of factors, including hawkish comments from Fed speakers, a stronger dollar, and rising oil prices. These factors are creating a challenging environment for the Kiwi, putting downward pressure on the pair.
Track markets in real-time
AI-powered analysis, technical indicators and real-time price data.
Join Our Telegram Channel
Breaking market news, AI analysis and trading signals instantly.
Join Channel