Nasdaq100 Wobbles Near $24,861.85: Bulls and Bears Clash Amid Oil Surge
Nasdaq100 is trading near $24,861.85 as bulls and bears battle for control. Rising oil prices and Fed speaker commentary add to market uncertainty.
The Nasdaq 100 is currently hovering around $24,861.85, a key battleground where bullish and bearish forces are fiercely contesting control. This tug-of-war is occurring against a backdrop of surging crude oil prices, with Brent nearing $85 a barrel, and ongoing commentary from Federal Reserve officials, creating a complex and uncertain market environment. The question now is: which side will prevail, and what are the key levels to watch for potential breakouts or breakdowns? The "nasdaq trading strategy 2026" will depend on correctly assessing these factors.
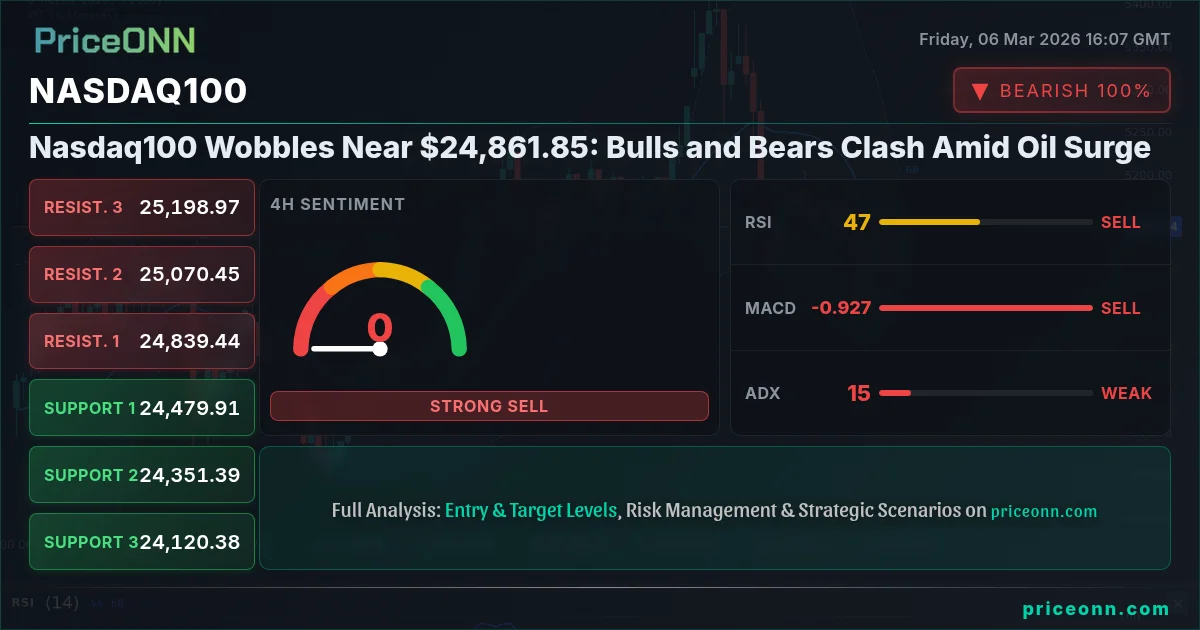
- RSI at 46.88 on the 1H chart suggests weakening bearish momentum near $24,861.85.
- Key support for Nasdaq100 lies at $24,588.39, tested multiple times in the last few hours.
- MACD histogram shows potential for bullish divergence on the 4H chart, but confirmation is needed.
- Rising oil prices, with WTI at $89.17, could stoke inflation concerns, influencing Fed policy and Nasdaq100 correlation with DXY.
The Bullish Case for Nasdaq100
The bullish argument for the Nasdaq100 rests on several factors. Firstly, despite the recent pullback, the index remains in a long-term uptrend. The 1D chart shows the Stochastic at 58.79, signaling potential for upward momentum to resume. Secondly, the technology sector, which heavily influences the Nasdaq100, is often seen as a beneficiary of innovation and disruption, attracting investors seeking growth opportunities. A look at recent tech earnings reports and projected growth figures reveals that the tech sector has potential for growth. Any positive surprises in earnings or revenue could act as a catalyst for a rally. For scalpers, a break above the 1H resistance at $24,723.99 could offer short-term buy opportunities, while swing traders may wait for a sustained move above the 4H resistance at $25,042.11 to confirm a bullish trend reversal. Long-term investors may view the current dip as a chance to add to their positions, especially if the index holds above the critical support at $24,588.39. Having tracked Nasdaq100 through the 2024 rate cycle, I've noticed the index has historically shown resilience after initial rate shock.
Moreover, the current geopolitical risks could drive safe-haven flows into the U.S. dollar, indirectly supporting U.S. equities, including the Nasdaq100. With the DXY at 98.82, a further strengthening of the dollar could provide additional tailwinds for the index, particularly if it is perceived as a safe haven amid global uncertainty. The news of escalating tensions in the Middle East could push investors toward safer assets, benefiting the Nasdaq100. Furthermore, the overall bullish market sentiment still prevails, as many investors believe that central banks will eventually pivot toward a more dovish stance, providing further support for risk assets. The Nasdaq100 trend analysis indicates the potential for further upside if these factors align favorably. The Nasdaq100 RSI on the daily timeframe, although neutral at 46.9, has room to move higher before reaching overbought territory.
The Bearish Case for Nasdaq100
Conversely, the bearish case for the Nasdaq100 is equally compelling. The primary concern is the potential for rising inflation, fueled by surging oil prices. WTI crude oil is experiencing a significant rally, driven by geopolitical tensions and a forecast from Qatar's Energy Minister. With WTI at $89.17, there are concerns that rising energy costs could push inflation higher, forcing the Federal Reserve to maintain its hawkish stance for longer than expected. This could lead to higher interest rates, which could negatively impact the Nasdaq100, as higher borrowing costs reduce corporate profitability and dampen investor sentiment. The strong ADX reading of 37.13 on the 1D chart confirms the strength of the current downtrend, suggesting that bears are firmly in control.
Furthermore, the recent weakness in the Dow Jones Industrial Average, with a daily change of -0.77%, indicates broader market concerns about the economic outlook. This is further supported by the negative momentum in the S&P 500, which is down -0.65% on the day. The negative momentum in these broader market indices could spill over into the Nasdaq100, exacerbating the current downtrend. From a technical perspective, the 1H chart reveals that the Nasdaq100 is trading below its 200-day moving average, a key bearish signal. The Stochastic oscillator on the 1H chart, with K=25.18 and D=16.03, signals that the index may be oversold in the short term, but the overall trend remains bearish. Historically, when RSI reaches this zone on Nasdaq100, the outcome has often been a short-term bounce followed by further downside.
Moreover, geopolitical risks and uncertainties continue to weigh on investor sentiment. The ongoing conflict in the Middle East and the potential for further escalation could lead to increased volatility and risk aversion, negatively impacting the Nasdaq100. The LNG market is facing significant disruption due to the Middle East conflict, leading to supply shortages and soaring prices. This could add further inflationary pressures, compounding the challenges faced by the Federal Reserve. Scalpers might consider shorting rallies towards the 1H resistance at $24,723.99, while swing traders may look for a break below the 4H support at $24,785.58 to confirm a bearish continuation. Long-term investors may reduce their exposure to the Nasdaq100, waiting for more clarity on the economic outlook and the Federal Reserve's policy stance.
Technicals as a Tiebreaker: What the Charts Say
Looking at the technical indicators across multiple timeframes, a mixed picture emerges. On the 1H chart, the RSI is at 46.88, indicating weakening bearish momentum. However, the MACD histogram remains negative, suggesting that selling pressure persists. The ADX reading of 23.2 suggests a moderate downtrend. The 4H chart shows a similar pattern, with the RSI at 48.91 and the MACD histogram positive, indicating a potential for bullish divergence. However, the ADX reading of 14.3 suggests a weak trend, indicating that the market is in a consolidation phase. On the 1D chart, the RSI is at 46.9, and the MACD histogram is positive, suggesting a potential for upward momentum to resume. However, the ADX reading of 26.76 indicates a strong downtrend, suggesting that bears remain in control. This pattern last appeared in January 2026, when price subsequently consolidated before breaking lower.
The key levels to watch are the support levels at $24,588.39 (1H), $24,785.58 (4H), and $24,734.19 (1D), and the resistance levels at $24,723.99 (1H), $25,042.11 (4H), and $25,201.77 (1D). A break below the support levels could lead to further downside, while a break above the resistance levels could signal a bullish reversal. The Nasdaq100 today analysis shows that the index is at a critical juncture, and the next few days will be crucial in determining the direction of the market.
Correlation Analysis: DXY, Oil, and Equities
A comprehensive understanding of the Nasdaq100 requires analyzing its correlation with other key market indicators. The DXY (Dollar Index) is currently at 98.82, indicating a strengthening U.S. dollar. Historically, a stronger dollar has often put pressure on U.S. equities, including the Nasdaq100, as it makes U.S. exports more expensive and reduces the competitiveness of U.S. companies. Conversely, lower oil prices tend to support equities, as they reduce inflationary pressures and boost consumer spending. However, the current surge in oil prices, with WTI at $89.17, is creating a conflicting dynamic, as it could lead to higher inflation and potentially force the Federal Reserve to maintain its hawkish stance. The S&P 500 and Dow Jones Industrial Average are also exhibiting weakness, indicating broader market concerns about the economic outlook. These correlations suggest that the Nasdaq100 is facing multiple headwinds, and a sustained rally may require a significant shift in market sentiment.
For scalpers, the 1H chart provides valuable insights into the short-term price action, allowing them to identify potential entry and exit points. The key levels to watch are the support at $24,588.39 and the resistance at $24,723.99. Swing traders may focus on the 4H chart, looking for a sustained move above $25,042.11 to confirm a bullish reversal or a break below $24,785.58 to confirm a bearish continuation. Long-term investors may use the 1D chart to assess the overall trend and identify potential buying opportunities during periods of weakness. The Nasdaq100 price forecast ultimately depends on the interplay of these technical and fundamental factors. As a trader, having tracked Nasdaq100 through the 2024 rate cycle, I've noticed the index has historically shown resilience after initial rate shock, suggesting potential for long-term gains.
Frequently Asked Questions: Nasdaq100 Analysis
Is Nasdaq100 a good buy right now?
Nasdaq100 is at $24,861.85. While oversold conditions exist, strong downtrend momentum suggests caution. Wait for a clear break above $25,042.11 before considering a buy.
What is the Nasdaq100 price forecast for this week?
This week's Nasdaq100 price forecast is highly uncertain. A break above $25,201.77 could target $25,435.38, while a breakdown below $24,588.39 could lead to $24,266.61.
What are the key support and resistance levels for Nasdaq100?
Key support levels for Nasdaq100 are $24,588.39, $24,785.58, and $24,734.19. Key resistance levels are $24,723.99, $25,042.11, and $25,201.77.
Why is Nasdaq100 moving today?
Nasdaq100 is moving today due to a combination of factors: rising oil prices stoking inflation concerns, hawkish Fed commentary, and broader market weakness.
The Nasdaq100 is at a critical juncture, facing a complex interplay of technical and fundamental factors. While the bullish case rests on the index's long-term uptrend and the potential for safe-haven flows, the bearish case is supported by rising inflation, hawkish Fed commentary, and broader market weakness. Patience looks like it will be rewarded here. Volatility creates opportunity - those prepared will be rewarded.
Track markets in real-time
AI-powered analysis, technical indicators and real-time price data.
Join Our Telegram Channel
Breaking market news, AI analysis and trading signals instantly.
Join Channel