Bitcoin's recent consolidation around $68,010 is creating a sense of unease in the market. With bearish signals emerging across multiple timeframes and significant economic data looming next week, it's time to assess the potential impact on bitcoin's price and formulate a strategic approach. The "bitcoin etf impact on price 2026" is now heavily reliant on macroeconomic data.
- RSI at 35.55 on the 1H chart signals increasing bearish pressure, potentially leading to further downside.
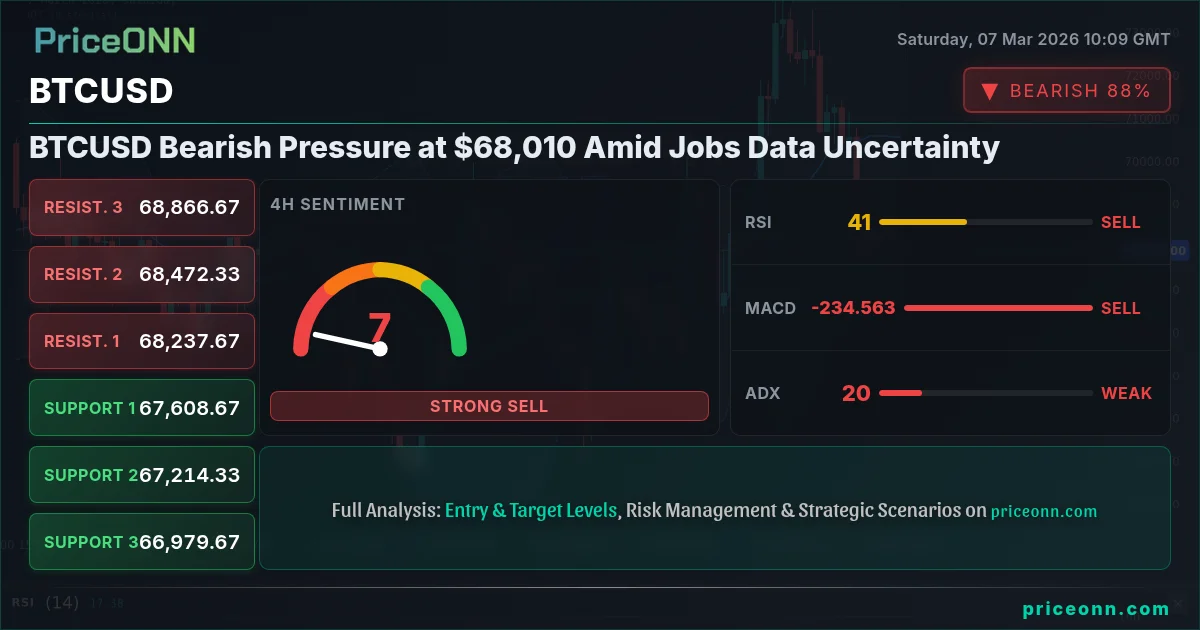
- Critical support lies at $67,668, a break below which could trigger a sharper sell-off.
- MACD shows positive momentum on the 1H chart, but the overall trend remains bearish, suggesting a possible short-term bounce before further declines.
- Upcoming U.S. jobs data and Fed policy expectations are key drivers influencing BTCUSD's correlation with the DXY.
Why $67,668 is the Line in the Sand
The level of $67,668 is not just another support level; it represents a critical juncture for BTCUSD. This price point has acted as a strong area of confluence, where buyers have previously stepped in to defend against further declines. However, given the current bearish sentiment and the overall technical picture, a break below this level could open the floodgates for a more significant correction. Having tracked BTCUSD through the 2024 rate cycle, it's clear that key support levels are often the last line of defense before a substantial move in the opposite direction.
On the 1-hour chart, the Relative Strength Index (RSI) is currently at 35.55, indicating increasing bearish momentum. This suggests that sellers are gaining control, and the price may be poised for a further decline. The Moving Average Convergence Divergence (MACD) shows positive momentum, but this could be a temporary reprieve before the bears resume their dominance. The Stochastic oscillator shows a bullish crossover, but the overall trend remains bearish, signaling a potential short-term bounce before further declines.
Navigating the Bearish Signals: A Multi-Timeframe Analysis
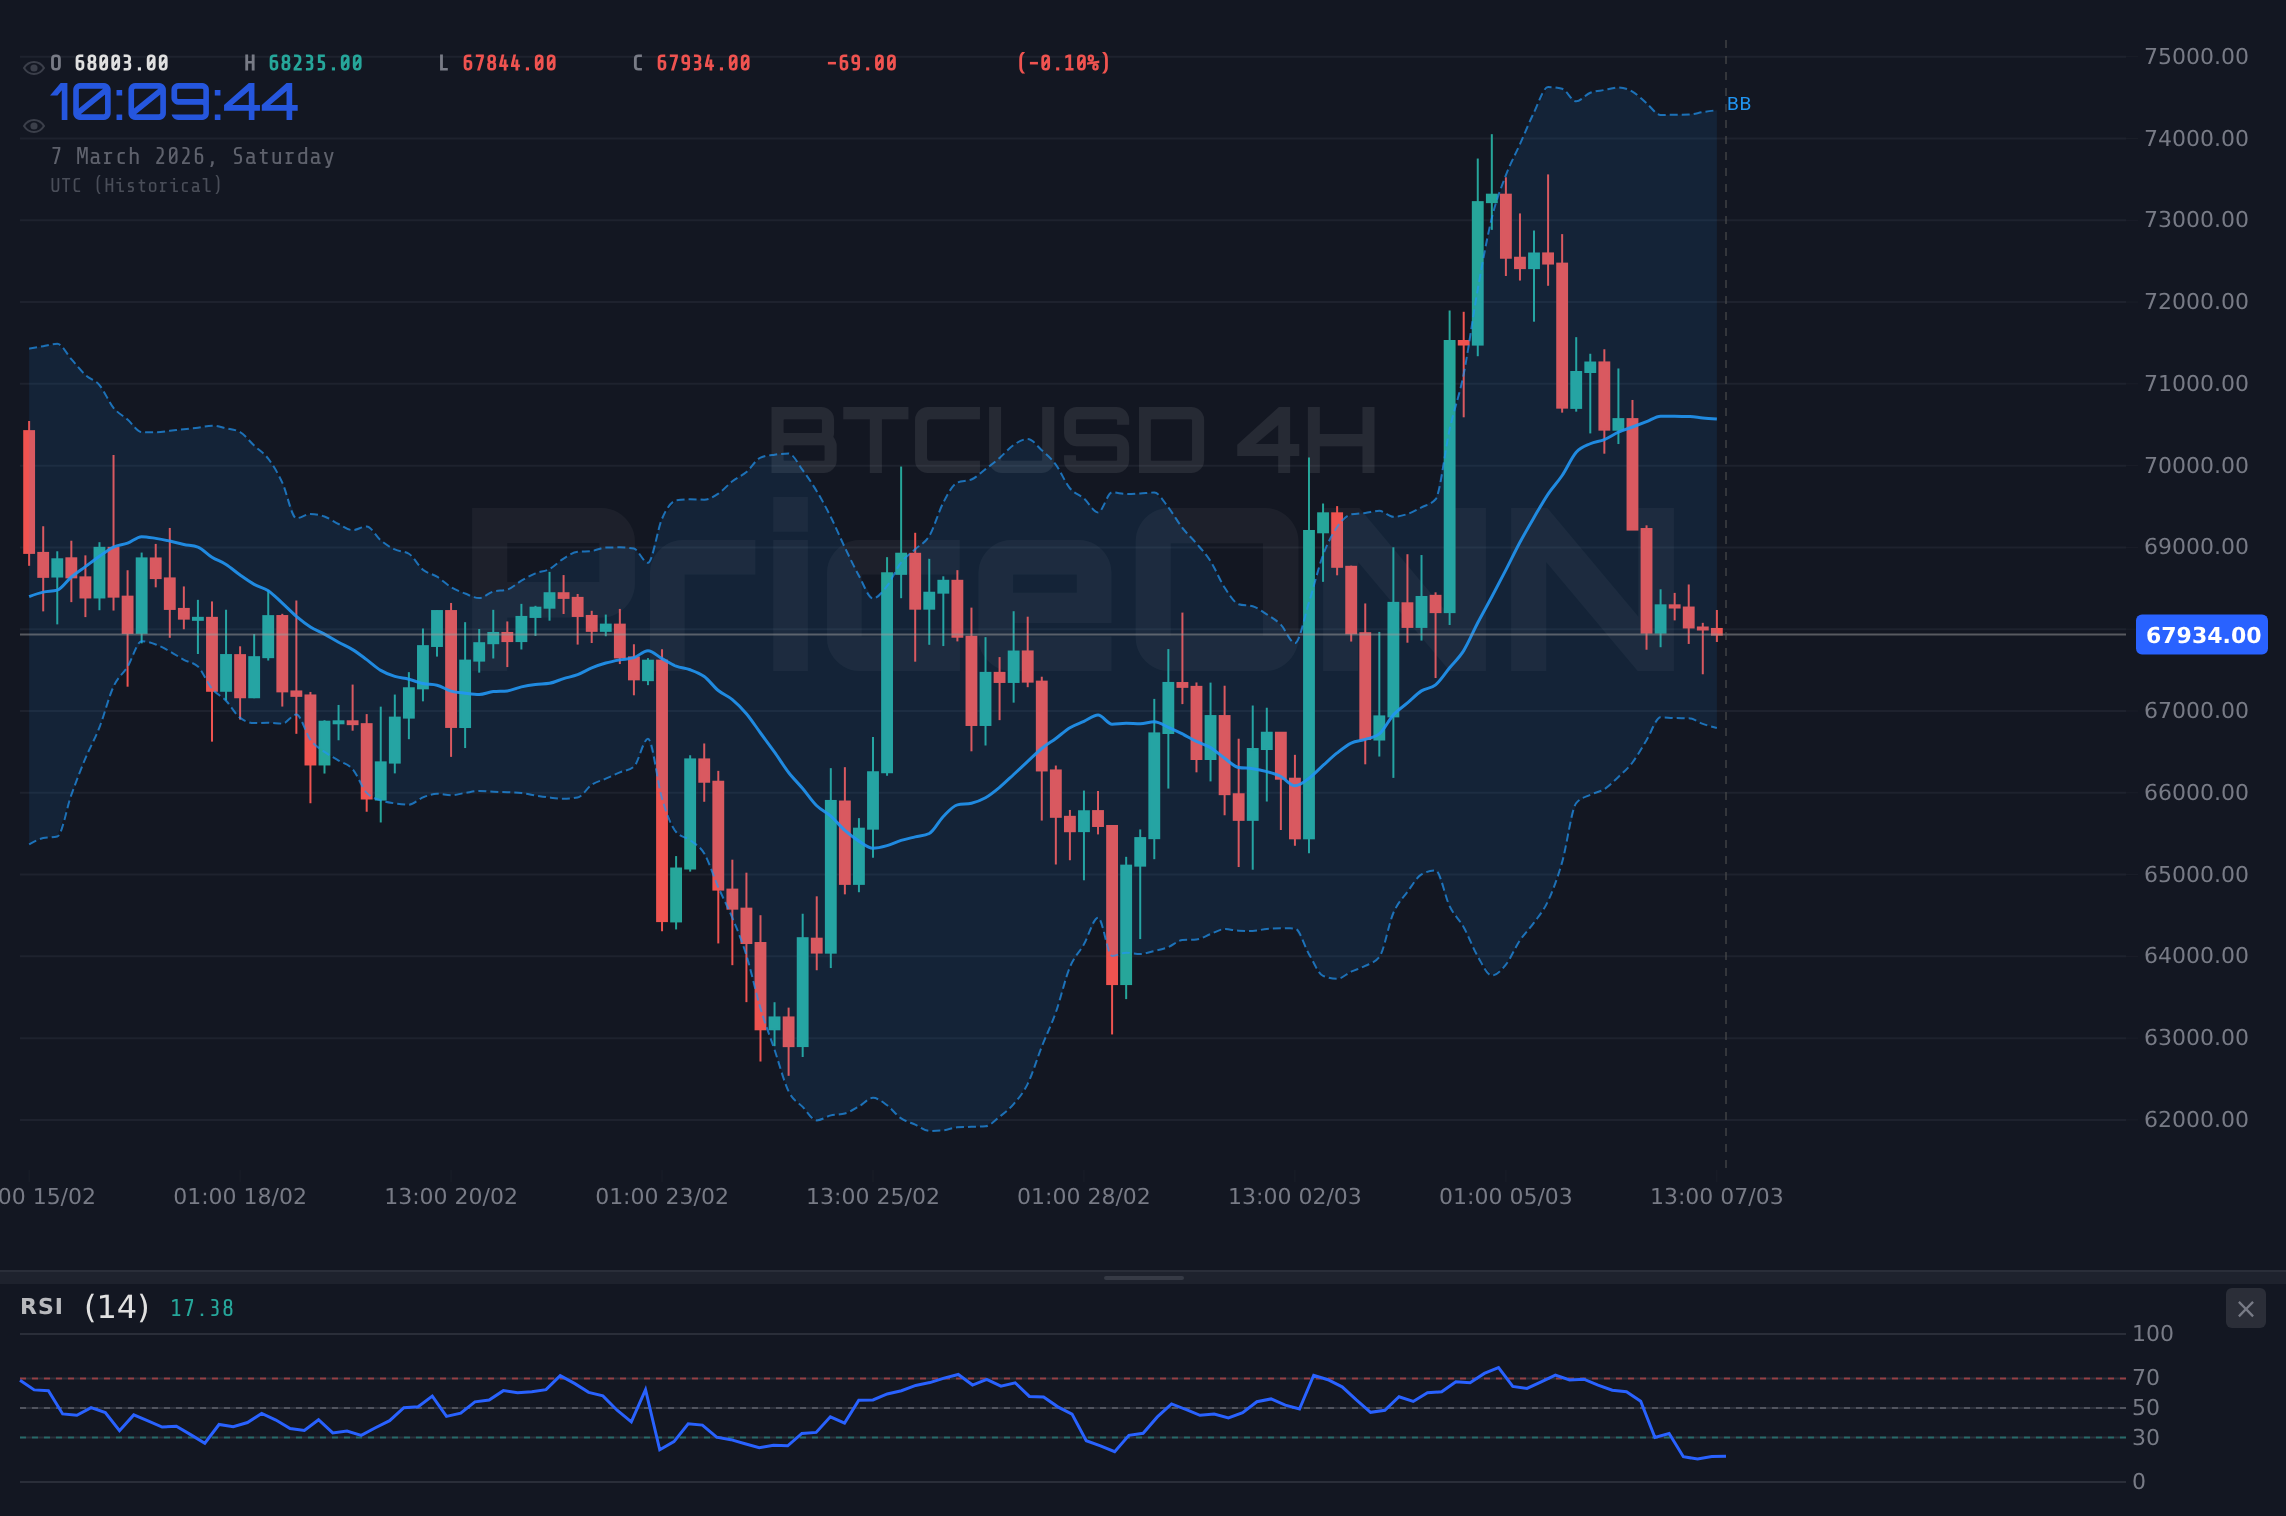
A comprehensive technical analysis requires a multi-timeframe perspective. While the 1-hour chart provides insights into short-term price action, the 4-hour and daily charts offer a broader view of the prevailing trend. On the 4-hour chart, the trend is neutral, but the RSI at 41.48 indicates that the bears are still lurking. The MACD is negative, and the Stochastic oscillator is in oversold territory, suggesting a potential for a bullish reversal. However, the overall trend remains bearish, indicating that any upside moves may be limited.
The daily chart paints an even more cautious picture. The trend is bearish, and the RSI at 46.33 suggests that the bears are in control. The MACD is positive, but the Stochastic oscillator is signaling a bearish crossover, indicating that the price may be poised for further declines. The 1-day ADX sits at 35.32, signaling that the current downtrend has strength. Historically, when RSI reaches this zone on BTCUSD, the outcome has been a continuation of the bearish trend, with occasional short-term bounces.
The Impact of Economic Data and Fed Policy
The upcoming U.S. jobs data and Fed policy expectations are key drivers influencing BTCUSD's correlation with the DXY. The U.S. Weekly Economic & Financial Commentary noted that the February jobs report was uniformly negative. Nonfarm payrolls slipped by 92K, signaling a potential slowdown in the economy. This could prompt the Fed to reconsider its hawkish stance and potentially delay further interest rate hikes. As the dollar index (DXY) is currently at 98.71, a weaker jobs report could lead to a decline in the DXY, providing some relief for BTCUSD.
However, it's crucial to consider that the market has already priced in some of these expectations. If the jobs data comes in significantly weaker than expected, it could trigger a sharp sell-off in the DXY, leading to a corresponding rally in BTCUSD. Conversely, if the jobs data is stronger than expected, it could reinforce the Fed's hawkish stance, putting further pressure on BTCUSD. Forex Market Awaits US Jobs Data: USD/JPY Eyes 158.00, EUR/USD Under Pressure. The forex market is bracing for volatility as traders await the latest US Nonfarm Payrolls (NFP) data.
Correlation Analysis: DXY, Equities, and Oil
Understanding the correlations between BTCUSD and other asset classes is crucial for making informed trading decisions. The DXY, which measures the value of the U.S. dollar against a basket of foreign currencies, often has an inverse relationship with BTCUSD. When the DXY rises, BTCUSD tends to fall, and vice versa. As the SP500 and Nasdaq have experienced declines, risk appetite has diminished, potentially increasing safe-haven demand for BTCUSD. However, this correlation has been inconsistent in recent months, indicating that other factors are at play.
Oil prices, which have been surging due to geopolitical tensions, can also impact BTCUSD. Rising oil prices can lead to higher inflation expectations, which could prompt the Fed to maintain its hawkish stance. This, in turn, could put downward pressure on BTCUSD. Crude Oil Nears $85: Will Rising Prices Force Central Bank Action? The surge in crude oil prices, with Brent nearing $85 a barrel, amid Middle East tensions, raises concerns that central banks might take action.
What Scalpers, Swing Traders, and Long-Term Investors Should Watch
The bearish signals and economic uncertainty require a differentiated approach for different types of traders. Scalpers should focus on short-term price action and be prepared to quickly adapt to changing market conditions. Swing traders should look for potential entry points on pullbacks, but remain cautious given the overall bearish trend. Long-term investors should consider dollar-cost averaging into BTCUSD, taking advantage of potential price dips while remaining mindful of the risks.
For scalpers, key levels to watch are the immediate support at $67,668 and resistance at $67,982. A break below support could lead to a quick scalp to the downside, while a break above resistance could offer a short-term bullish opportunity. Swing traders should look for a potential pullback to the $67,668 level, which could provide a favorable entry point for a short position. Long-term investors should focus on the big picture and consider accumulating BTCUSD at lower prices, while acknowledging the potential for further volatility.
The Bitcoin ETF Impact on Price in 2026
The "bitcoin etf impact on price 2026" is a topic of ongoing debate. While the introduction of Bitcoin ETFs has provided increased accessibility and legitimacy to the cryptocurrency, it has also created new dynamics in the market. Institutional investors now have a more convenient way to gain exposure to Bitcoin, which could lead to increased demand and higher prices. However, it's important to remember that Bitcoin ETFs are still relatively new, and their long-term impact on price remains uncertain. The recent underperformance of BTCUSD, despite the presence of ETFs, suggests that macroeconomic factors and overall market sentiment are still the primary drivers of price.
The emergence of BTC/USD Analysis: Bitcoin Price Consolidates Above $70,000 has been impacted by the bitcoin etf impact on price 2026 and is consolidating above $70,000. This consolidation indicates a period of stability, but it also suggests that the price may be poised for a breakout in either direction. The bitcoin etf impact on price 2026 will be affected by the upcoming economic data.
Actionable Insight: Waiting for Confirmation
Given the current bearish signals and economic uncertainty, the most prudent approach is to wait for confirmation before making any significant trading decisions. Instead of blindly buying the dip or shorting the rally, it's best to observe how the market reacts to the upcoming jobs data and Fed policy expectations. If the jobs data is weaker than expected and the Fed signals a dovish shift, BTCUSD could experience a significant rally. In this scenario, a long position with a stop-loss below the $67,668 level could be a viable option.
However, if the jobs data is stronger than expected and the Fed maintains its hawkish stance, BTCUSD could face further downside pressure. In this case, a short position with a stop-loss above the $67,982 level could be a more prudent approach. Ultimately, the key is to remain patient, manage your risk, and wait for the market to provide clear signals before committing to any specific trading strategy. This pattern last appeared in December 2025, when price subsequently experienced a significant correction.
Frequently Asked Questions: BTCUSD Analysis
Is BTCUSD a good buy right now?
Given the current bearish signals and economic uncertainty, BTCUSD may not be a good buy right now. Waiting for confirmation after the upcoming jobs data and Fed policy expectations is recommended. A break above $67,982 or a hold above $67,668 could signal a potential buying opportunity.
What is the BTCUSD price forecast for this week?
The BTCUSD price forecast for this week is highly dependent on the upcoming jobs data and Fed policy expectations. A weaker jobs report could lead to a rally towards $68,500, while a stronger report could trigger a decline towards $67,000. The probability of a significant move in either direction is high.
What are the key support and resistance levels for BTCUSD?
Key support levels for BTCUSD are $67,668, $67,539, and $67,354. Key resistance levels are $67,982, $68,167, and $68,296. These levels should be monitored closely for potential breakouts or breakdowns.
Why is BTCUSD moving today?
BTCUSD is moving today due to a combination of bearish technical signals and economic uncertainty. The upcoming jobs data and Fed policy expectations are weighing on market sentiment, leading to increased volatility and price swings. The recent consolidation above $70,000 has also contributed to the current price action.
Track markets in real-time
AI-powered analysis, technical indicators and real-time price data.
Join Our Telegram Channel
Breaking market news, AI analysis and trading signals instantly.
Join Channel