WTI Surges 15% to $90.81: Will US Data Sustain the Rally?
WTI crude oil soared 15% to $90.81, fueled by Middle East tensions. Traders now eye upcoming US economic data for further direction.
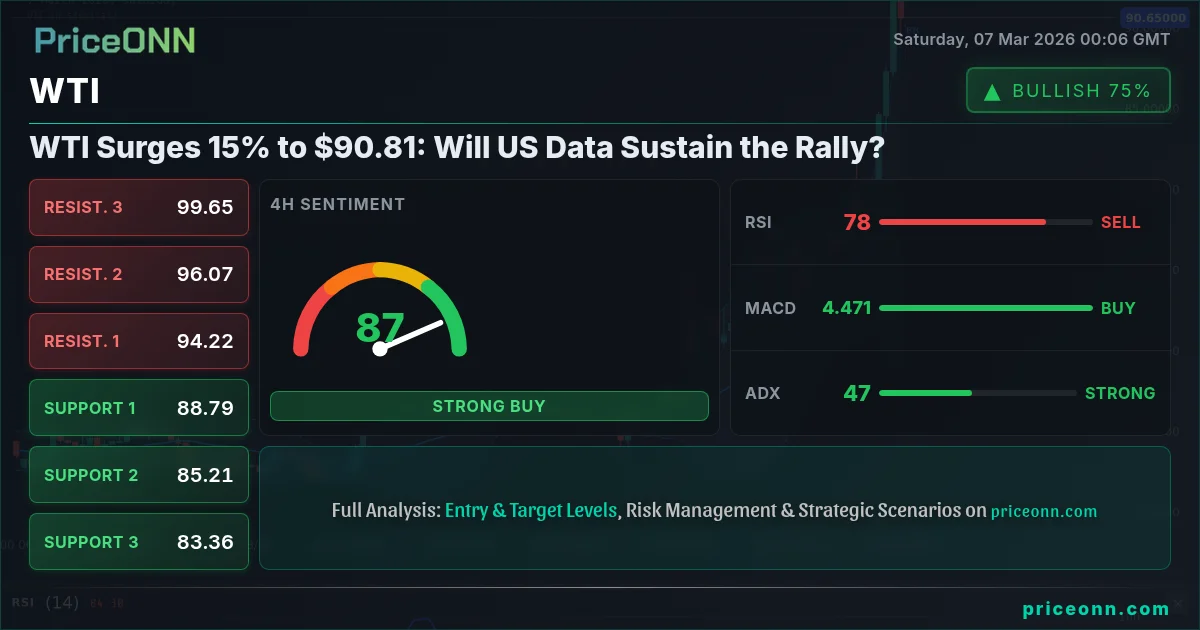
WTI crude oil's dramatic surge of 15% to $90.81 has traders on high alert. Can this rally hold, or is it a flash in the pan? The answer hinges on upcoming US economic data releases, particularly those related to inflation and employment, which will shape the Federal Reserve's policy outlook.
- WTI crude oil price surged 15% to $90.81 amid escalating Middle East tensions.
- Key support levels to watch are $89.90 (1H), $84.67 (4H), and $75.18 (1D).
- Resistance levels are at $92.84 (1H), $88.86 (4H), and $82.29 (1D).
- Overbought conditions, with RSI at 76.86 on the 1H chart, suggest potential for a pullback.
The Geopolitical Spark and Market Reaction
The initial catalyst for WTI's explosive move was the intensification of geopolitical tensions in the Middle East. As reports of escalating conflict surfaced, concerns about potential supply disruptions rippled through the market, triggering a wave of buying. This safe-haven demand, coupled with pre-existing supply constraints, created a perfect storm for higher prices. As PriceONN market news noted, "Middle East conflict drives oil surge: Implications for New Zealand and WTI Crude." The immediate reaction saw WTI blow past several key technical levels, catching many traders off guard. The sustainability of this rally, however, remains uncertain.
Technical Indicators Flash Overbought Signals
A quick glance at the technical indicators reveals a market stretched to its limits. On the 1-hour chart, the Relative Strength Index (RSI) sits at a lofty 76.86, firmly in overbought territory. This suggests that the current pace of gains is unsustainable and a period of consolidation or even a pullback is likely. Similarly, the Stochastic oscillator, with %K at 89.67 and %D at 93.37, confirms the overbought condition. The Average Directional Index (ADX) at 47.92 indicates a strong uptrend on the 1H timeframe, but overextended conditions often precede corrections. The 4H timeframe also shows overbought conditions with an RSI of 83.72 and Stochastic K at 95.09.
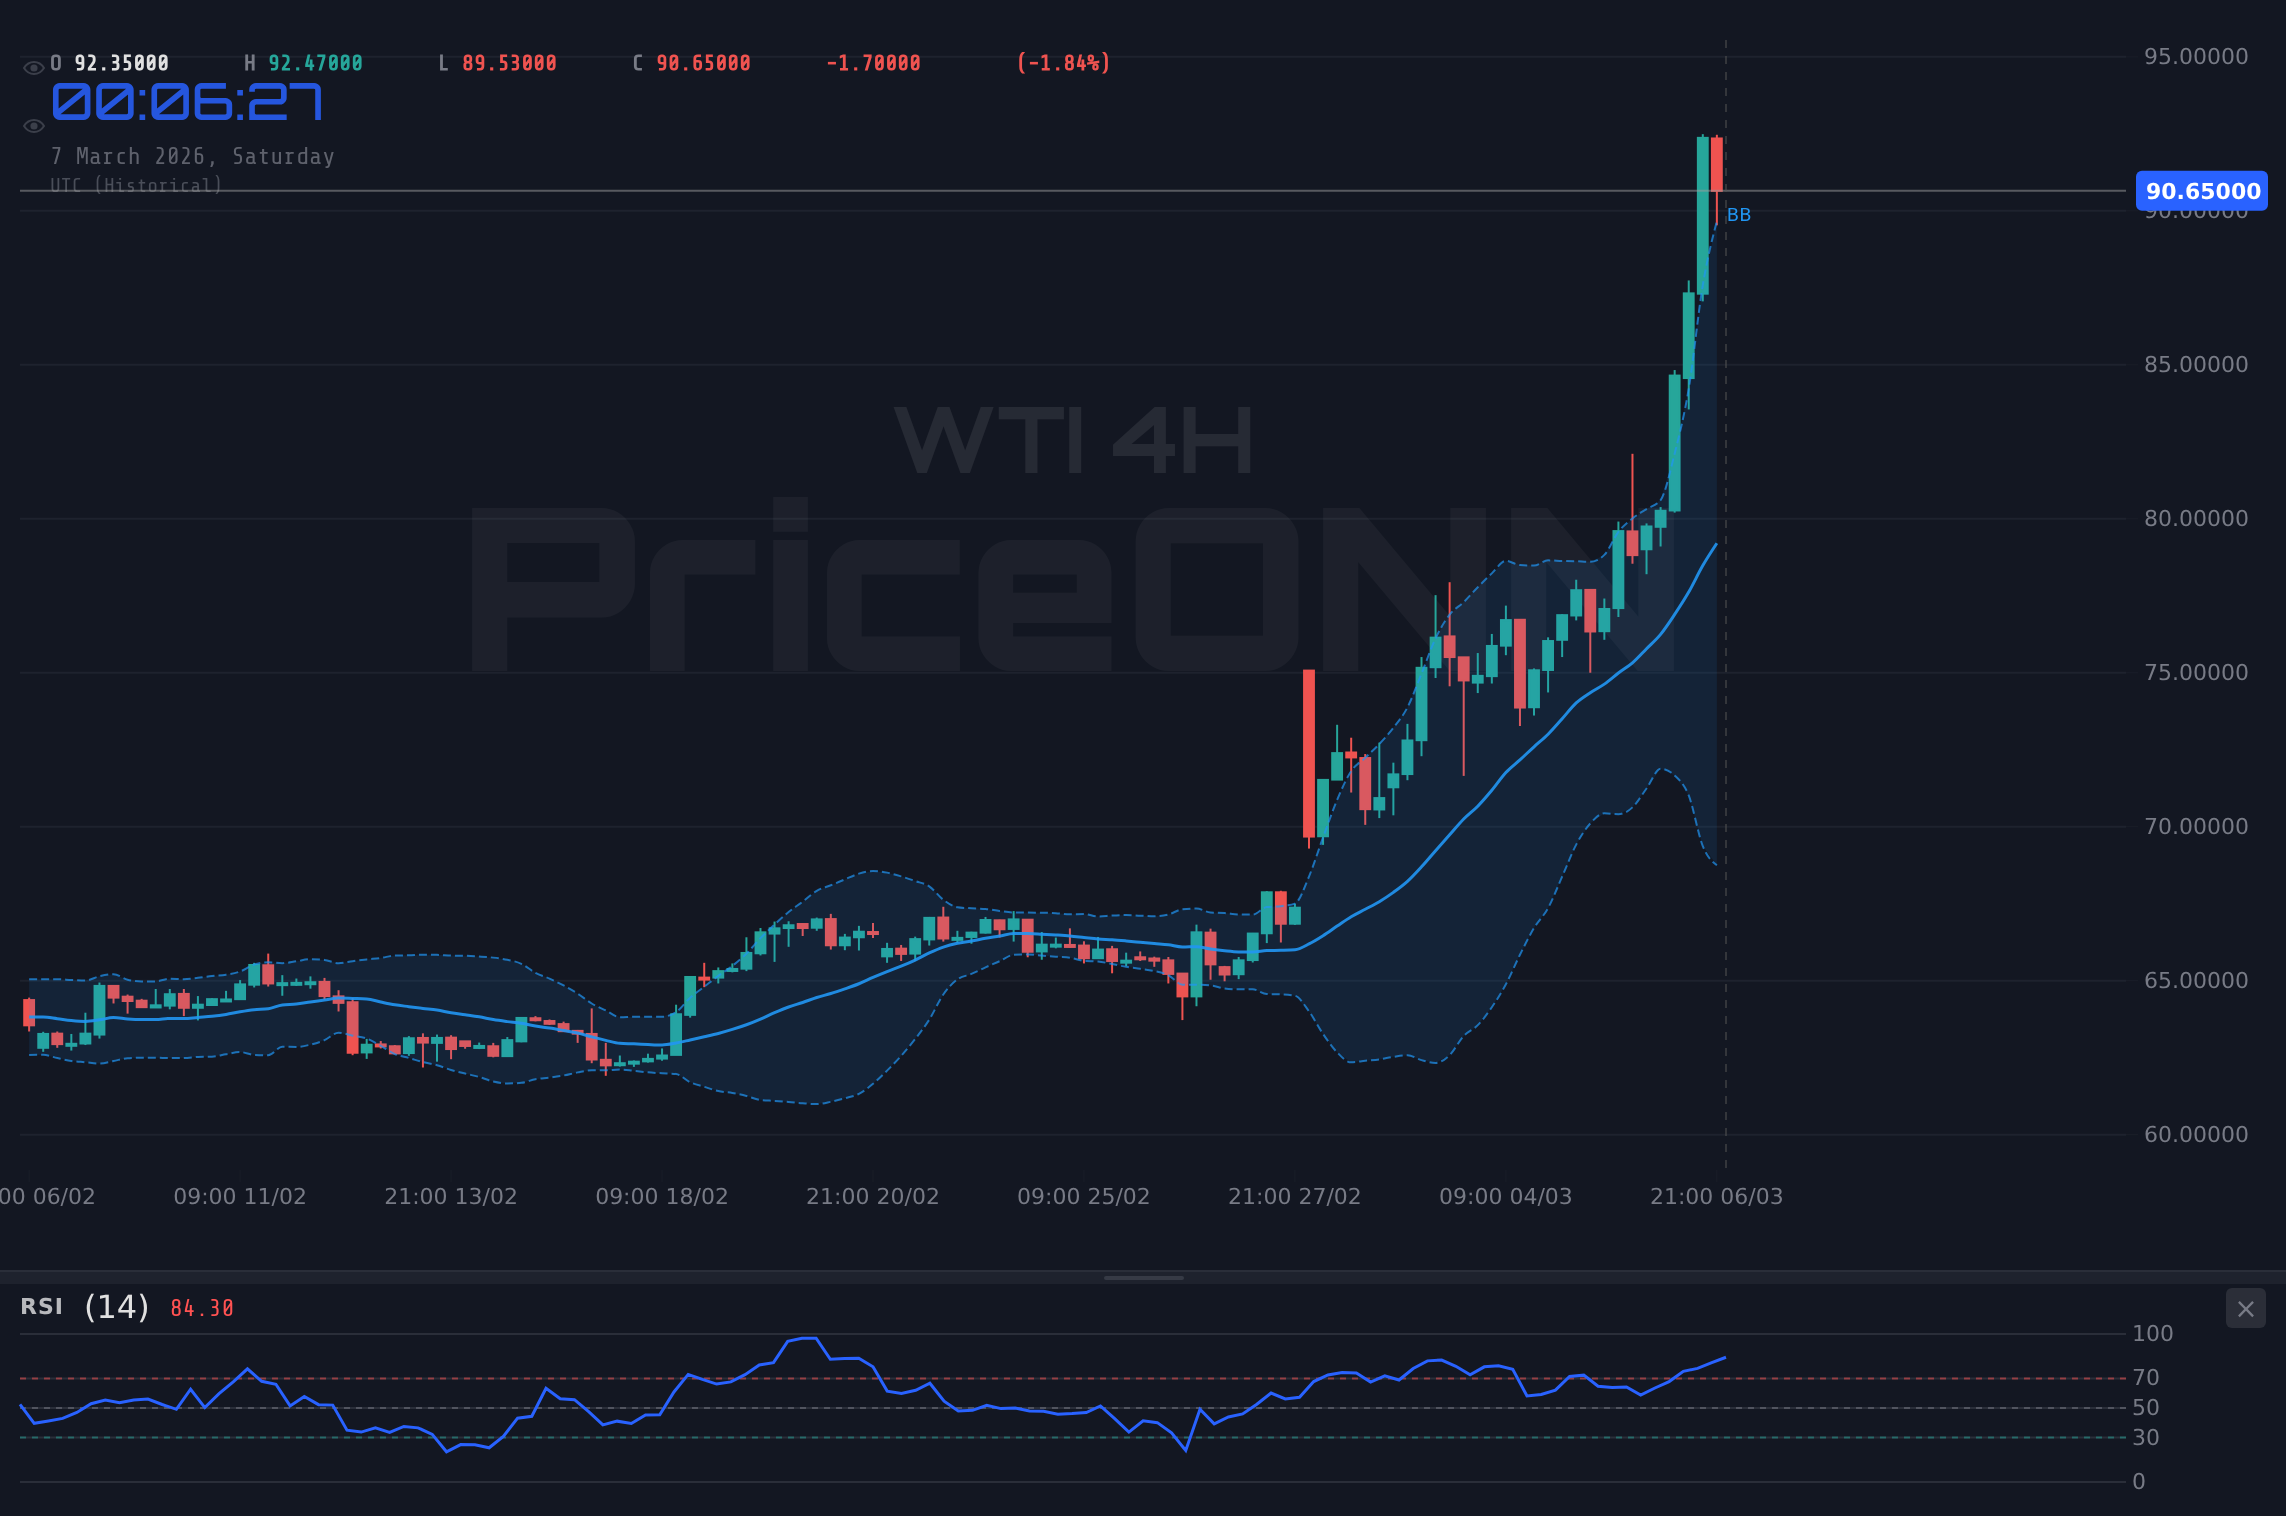
Analyzing WTI's Support and Resistance Levels
Despite the overbought signals, WTI's bullish momentum is undeniable. To gauge potential entry points and profit targets, it's crucial to identify key support and resistance levels. On the 1-hour chart, immediate support lies at $89.90, followed by $88.25 and $86.96. These levels could act as potential bounce zones if the price retraces. Resistance, on the other hand, is clustered around $92.84, $94.13, and $95.78. A decisive break above these levels could pave the way for further gains. Looking at the 4-hour timeframe, support levels are at $84.67, $82.01 and $80.48. Resistance levels are at $88.86, $90.39 and $93.05. It's important to note that the daily timeframe paints a similar picture with support at $75.18, $71.53 and $68.07 and resistance at $82.29, $85.75 and $89.4.
The Dollar's Role and the DXY Correlation
The movement of the Dollar Index (DXY) plays a crucial role in shaping WTI's price dynamics. Currently, the DXY sits at 98.71, showing a slight downward direction. A weaker dollar typically provides a tailwind for commodity prices, including oil, as it makes them more affordable for international buyers. However, if the DXY were to reverse course and strengthen, it could exert downward pressure on WTI. Traders should closely monitor the DXY for clues about the potential direction of oil prices. If the DXY finds support around 98.37, this may lead to further weakening. However, if the DXY breaks above resistance at 99.12, this may lead to further strengthening of the dollar and a downtrend in WTI.
Upcoming US Data: The Make-or-Break Moment
The fate of WTI's rally rests heavily on upcoming US economic data releases. The market awaits key figures on inflation, employment, and economic growth. A stronger-than-expected inflation reading could prompt the Federal Reserve to adopt a more hawkish stance, potentially leading to higher interest rates and a stronger dollar- both of which could weigh on oil prices. Conversely, weaker-than-expected data could signal a slowdown in the US economy, reducing demand for oil and putting downward pressure on prices. The forex market is bracing for volatility as traders await the latest US Nonfarm Payrolls (NFP) data.
Central Bank Action: Will Rising Prices Force a Response?
Crude oil prices surged, with Brent nearing $85 a barrel, amid Middle East tensions, raising concerns that central banks may take action. Central bank policy will be a key factor in the direction of oil prices. Rising oil prices can contribute to inflationary pressures, which may force central banks to tighten monetary policy. Higher interest rates can, in turn, dampen economic activity and reduce demand for oil. The market will be closely watching central bank communications and policy decisions for any signs of a response to rising oil prices.
Looking at the Broader Energy Market Context
The surge in WTI isn't happening in isolation. Brent crude is also experiencing upward pressure, driven by similar geopolitical and supply-side factors. In addition, news that Ecopetrol, Colombia's state oil company, is considering boosting output amid Middle East tensions highlights the complex interplay of supply and demand in the global energy market. While increased production could help alleviate some of the upward pressure on prices, it also underscores the vulnerability of the market to geopolitical shocks.
The Contrarian View: A Potential Bear Trap?
While the prevailing sentiment is bullish, it's crucial to consider the possibility of a bear trap. Overbought conditions, combined with the potential for a stronger dollar and weaker economic data, could trigger a sharp reversal. A close below the $89.90 level on the 1-hour chart would be an early warning sign, potentially opening the door for a move towards the $88.25 and $86.96 support levels. Traders should be prepared to adjust their positions if the market narrative shifts.
CAD/JPY and Oil: A Key Correlation to Watch
The Canadian dollar (CAD) is often correlated with oil prices, given Canada's status as a major oil producer. The CAD/JPY pair, in particular, can offer insights into the relationship between oil and currency markets. News surrounding the Bank of Canada (BoC) and the Bank of Japan (BoJ) can also influence this pair, creating a complex interplay of factors. Traders should monitor CAD/JPY for potential trading opportunities, as it can provide a leading indicator for WTI's direction. If CAD/JPY shows strength, it could signal further upside for oil prices. Conversely, weakness in CAD/JPY could suggest a potential pullback in WTI.
Frequently Asked Questions: WTI Analysis
Is WTI a good buy right now?
Given the current overbought conditions and dependence on geopolitical tensions, a cautious approach is warranted. A pullback to the $89.90 support level could offer a more attractive entry point, but traders should wait for confirmation of renewed bullish momentum.
What is the WTI price forecast for this week?
The short-term outlook is highly uncertain, with potential for both upside and downside. A break above $92.84 could target $94.13, while a break below $89.90 could lead to a test of $88.25. The probability depends heavily on upcoming US economic data.
What are the key support and resistance levels for WTI?
Key support levels are $89.90, $88.25, and $86.96 on the 1-hour chart, while resistance levels are $92.84, $94.13, and $95.78. A break of either support or resistance could signal the next major move.
Why is WTI moving today?
WTI is primarily moving due to escalating geopolitical tensions in the Middle East, which are raising concerns about potential supply disruptions. The surge is also amplified by existing supply constraints and a weaker dollar.
Track markets in real-time
AI-powered analysis, technical indicators and real-time price data.
Join Our Telegram Channel
Breaking market news, AI analysis and trading signals instantly.
Join Channel