WTI Surges to $90.81 Amid Middle East Tensions; Jobs Data Looms
WTI crude oil hits $90.81 amid escalating Middle East tensions, with markets eyeing upcoming US jobs data for further direction. Will rising prices force central bank action?
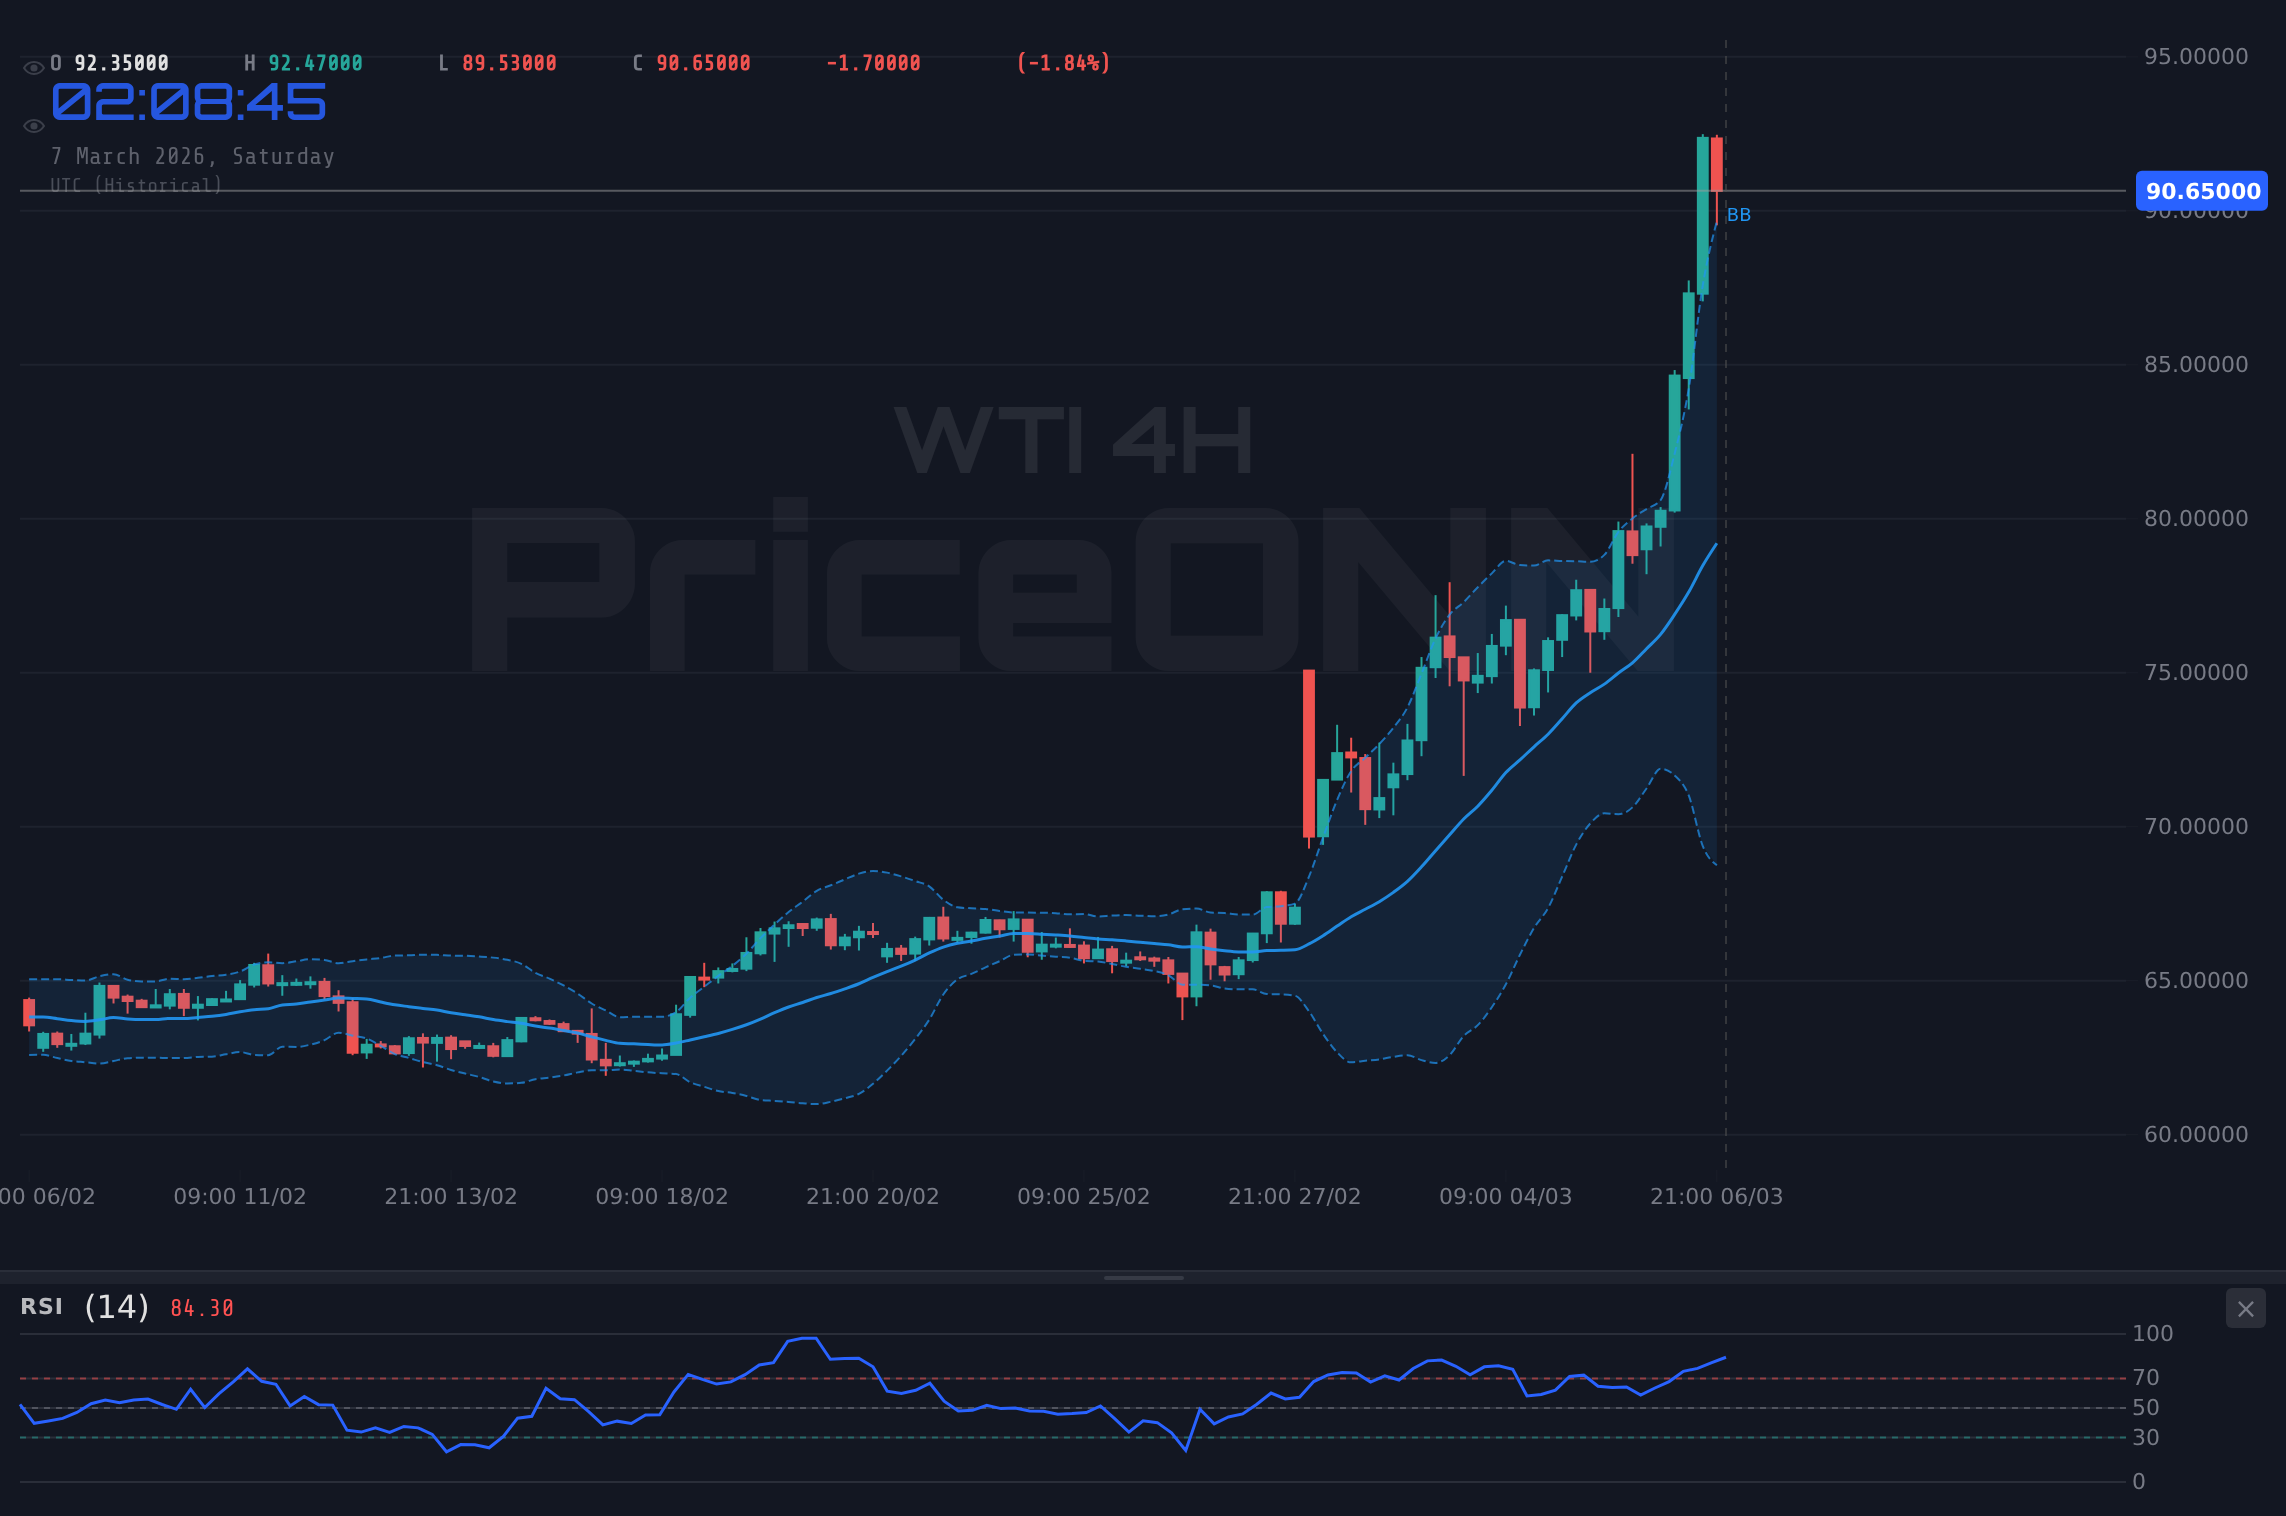
The escalating conflict in the Middle East, coupled with anticipation surrounding the upcoming US jobs data, has sent West Texas Intermediate (WTI) crude oil soaring to $90.81. This surge raises concerns about potential inflationary pressures and how central banks might respond.
- WTI crude oil reached $90.81, driven by geopolitical tensions and supply concerns.
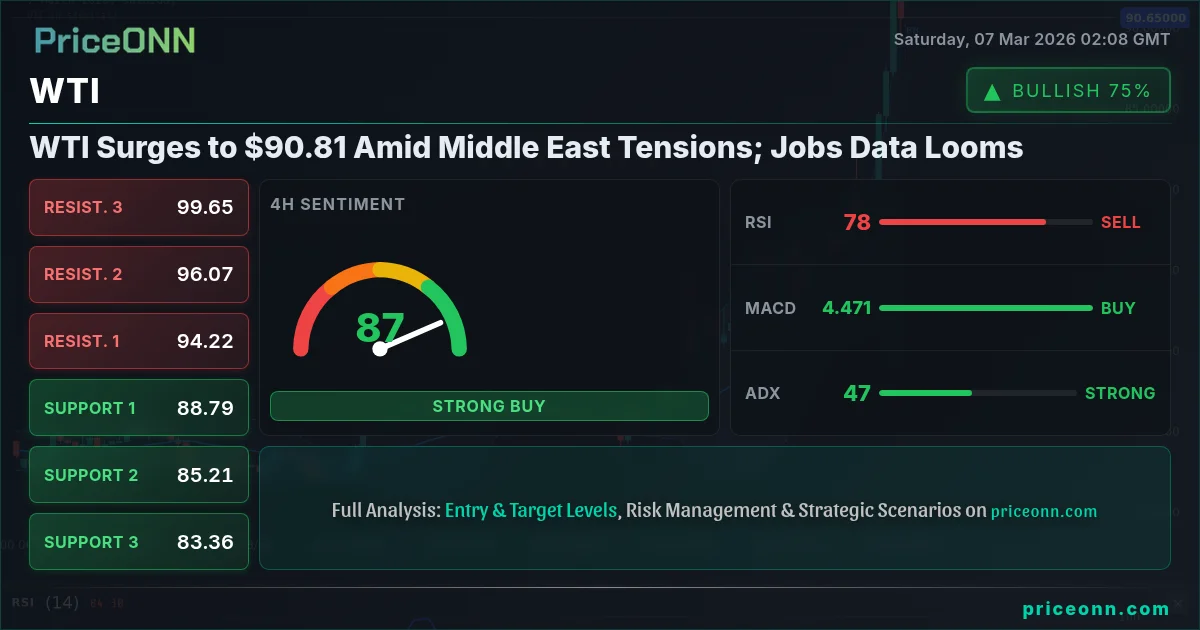
- The RSI at 76.86 on the 1H chart suggests overbought conditions, potentially signaling a near-term pullback.
- Strong resistance is observed at $92.84, a level to watch for potential breakouts.
- Upcoming US jobs data could influence the Federal Reserve's monetary policy, impacting oil prices.
Geopolitical Tensions Fueling WTI's Ascent
The primary driver behind WTI's recent surge is the escalating conflict in the Middle East. As reported by PriceONN Market News, Middle East tensions are disrupting global energy flows, leading to supply fears and increased demand for crude oil. The market is particularly sensitive to any news suggesting potential disruptions to oil production or transportation routes. This geopolitical uncertainty is a key factor underpinning the current bullish sentiment in the oil market.
According to Qatar's Energy Minister, the ongoing conflicts could potentially push oil prices to $150 a barrel as reported by PriceONN. While such a forecast might seem extreme, it underscores the severity of the risks currently weighing on the energy market. Traders are closely monitoring developments in the region, with any escalation likely to exacerbate the upward pressure on oil prices.
Technical Indicators Suggest Overbought Conditions
While fundamental factors are driving the current rally, technical indicators suggest that WTI may be entering overbought territory. The 1-hour chart shows the Relative Strength Index (RSI) at 76.86, indicating that the commodity is overbought and a pullback may be imminent. However, strong upside momentum could keep the price elevated for longer than anticipated. The Average Directional Index (ADX) at 47.92 on the 1H timeframe signifies a strong uptrend.
The Moving Average Convergence Divergence (MACD) on the 1H timeframe shows positive momentum, supporting the bullish trend. However, traders should be aware that overbought conditions can lead to sharp reversals, especially if negative news or data emerges. The Stochastic oscillator, with K=89.67 and D=93.37, also confirms the overbought status, suggesting that a period of consolidation or correction may be on the horizon.
Key Levels to Watch: Support and Resistance
Traders should pay close attention to key support and resistance levels to gauge the potential for further price movements. Immediate resistance lies at $92.84, followed by $94.13 and $95.78 on the 1-hour chart. A breakout above $92.84 could signal a continuation of the uptrend, potentially targeting higher levels. Conversely, failure to breach this resistance could indicate a period of consolidation or a potential reversal.
On the downside, immediate support is found at $89.90, followed by $88.25 and $86.96 on the 1-hour chart. A break below $89.90 could trigger a deeper correction, potentially testing lower support levels. These levels will act as key areas of interest for both buyers and sellers, and price action around these levels will provide valuable clues about the market's future direction.
Upcoming US Jobs Data: A Potential Game-Changer
The upcoming US jobs data, particularly the Nonfarm Payrolls (NFP) report, is a major event risk that could significantly impact WTI prices. A strong NFP number could boost the US dollar, putting downward pressure on WTI. Conversely, a weak NFP number could weaken the dollar and support higher oil prices. The forex market awaits US jobs data, as USD/JPY eyes 158.00, EUR/USD under pressure.
The economic calendar highlights several high-impact USD events including the recent data on March 4th and the upcoming releases on March 6th. The previous NFP was at 130, while the unemployment rate stood at 4.3%. Traders will be closely watching these figures, as they could influence the Federal Reserve's monetary policy decisions. Any surprises in the data could trigger significant volatility in the oil market.
Central Bank Action: A Double-Edged Sword
Rising oil prices, if sustained, could force central banks to take action to combat inflationary pressures. This could involve raising interest rates or tightening monetary policy, which could have a dampening effect on economic growth and oil demand. However, as crude oil nears $85, the question is whether rising prices will force central bank action. The potential for central bank intervention adds another layer of complexity to the oil market outlook.
On the other hand, central banks might choose to tolerate higher oil prices if they believe the inflationary pressures are temporary. This could be the case if the supply disruptions in the Middle East are resolved quickly. The central bank's response will depend on a variety of factors, including the overall state of the economy, the level of inflation, and the outlook for future growth. Market participants will be closely scrutinizing central bank communications for clues about their policy intentions.
Correlation with Other Markets: DXY and Equities
WTI's price movements are often correlated with other markets, particularly the US dollar and equities. A stronger dollar, as measured by the Dollar Index (DXY) at 98.71, tends to put downward pressure on WTI, as oil is priced in dollars. Conversely, a weaker dollar can support higher oil prices. The DXY is currently showing a direction of decrease.
The SP500 and Nasdaq indices also play a role in influencing WTI prices. A decline in these indices, as seen with the SP500 currently at 6737.1, with a negative daily change of -1.16%, indicates a decrease in risk appetite, which can lead to increased demand for safe-haven assets and a potential decrease in demand for riskier assets like oil. Traders should therefore monitor these correlations to gain a more comprehensive understanding of the factors driving WTI prices.
Long-Term Outlook: Geopolitical Risks and Supply Dynamics
Looking ahead, the long-term outlook for WTI will depend on a combination of geopolitical risks and supply dynamics. Continued instability in the Middle East could keep prices elevated, while increased oil production from other regions could put downward pressure on prices. The market will also be closely watching developments in Iran, as any changes in Iranian oil production or exports could have a significant impact on global oil supply.
The rise of shale oil production in the United States is another key factor to consider. Increased shale production could help offset any supply disruptions from the Middle East, potentially limiting the upside for oil prices. However, the extent to which shale production can ramp up quickly enough to meet demand remains to be seen. The market will also be closely watching the actions of OPEC+ (Organization of the Petroleum Exporting Countries and its allies), as they have the power to influence oil prices by adjusting production levels.
WTI Oil Crosses 80 after White House Timeline Uncertainty, 84.3 Now Key
According to PriceONN, WTI Oil crosses 80 after White House timeline uncertainty, and 84.3 is now key. The article also suggests that WTI rebounded above $79.00 as Middle East war disrupted global energy flows. Traders should always manage risk and wait for their setup, as the market always gives a second chance.
Frequently Asked Questions: WTI Analysis
Is WTI a good buy right now?
With WTI at $90.81, the high RSI suggests caution. A pullback to the $89.90 support level could present a more attractive entry point if the bullish trend is expected to continue.
What is the WTI price forecast for this week?
If geopolitical tensions persist, WTI could test the $92.84 resistance. However, a strong US jobs report could trigger a correction towards the $89.90 support level.
What are the key support and resistance levels for WTI?
Key support levels are at $89.90, $88.25, and $86.96. Resistance levels are at $92.84, $94.13, and $95.78, based on the 1H timeframe.
Why is WTI moving today?
Escalating Middle East tensions and anticipation of the US jobs report are the primary catalysts. Supply concerns are driving prices higher, while jobs data will influence the dollar's strength.
Volatility creates opportunity-those prepared will be rewarded.
Track markets in real-time
AI-powered analysis, technical indicators and real-time price data.
Join Our Telegram Channel
Breaking market news, AI analysis and trading signals instantly.
Join Channel