USDJPY is locked in a battle near $157.82, with bulls attempting to defend recent gains while bears eye a potential pullback. The key question: can the yen maintain its safe-haven status amidst geopolitical tensions and shifting Federal Reserve expectations, or will persistent weakness prompt intervention? This week's price action suggests neither side has gained a decisive advantage, setting the stage for heightened volatility in the coming days. The market eagerly anticipates next week's US jobs data, which could provide the catalyst for a significant move.
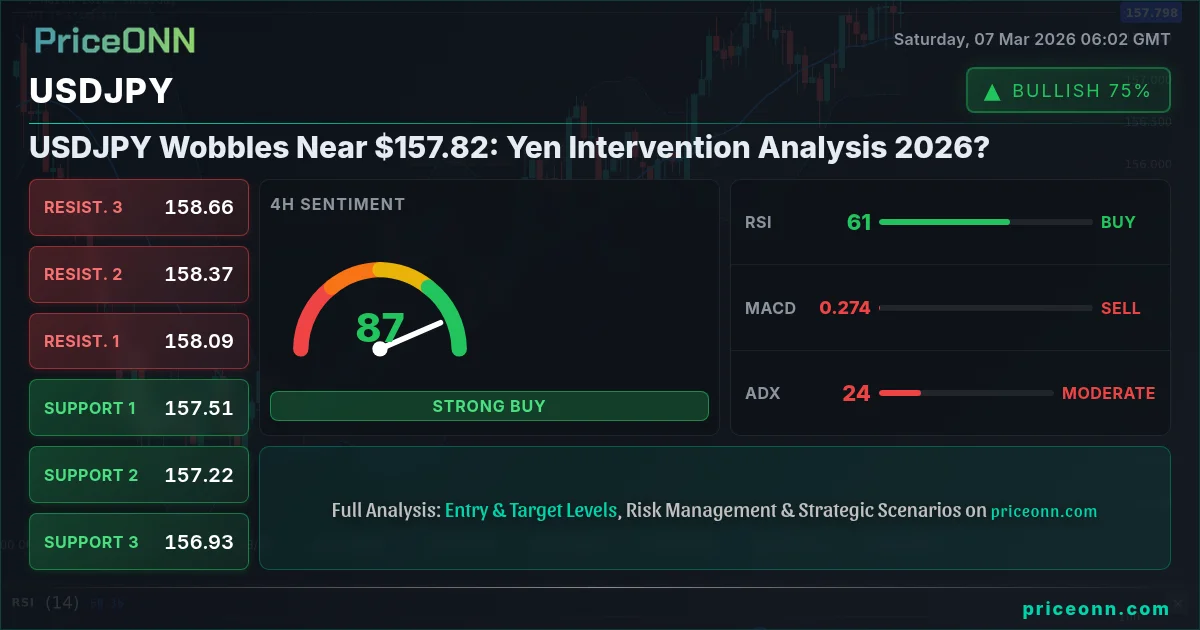
- USDJPY currently trades near $157.82, a critical level for both bulls and bears.
- RSI on the 1H chart at 55.63 suggests neutral momentum with a slight bullish bias.
- Key support lies at 157.475 (4H timeframe), which, if broken, could signal further downside.
- The market awaits next week's US jobs data, impacting Fed rate expectations and USDJPY correlation with DXY.
The Bull Case for USDJPY: Policy Divergence and Dollar Strength
The bullish argument for USDJPY centers on the persistent policy divergence between the Federal Reserve and the Bank of Japan (BoJ). While the Fed is signaling a potential pause in its rate-hiking cycle, the BoJ remains committed to its ultra-loose monetary policy. This divergence creates a carry trade incentive, where investors borrow in yen (low interest rates) and invest in dollar-denominated assets (higher yields), driving demand for USDJPY. The recent surge in WTI crude oil to $90.81, as reported in PriceONN's market news, further supports this narrative, as higher energy prices tend to boost the US dollar due to its status as a petro-currency.
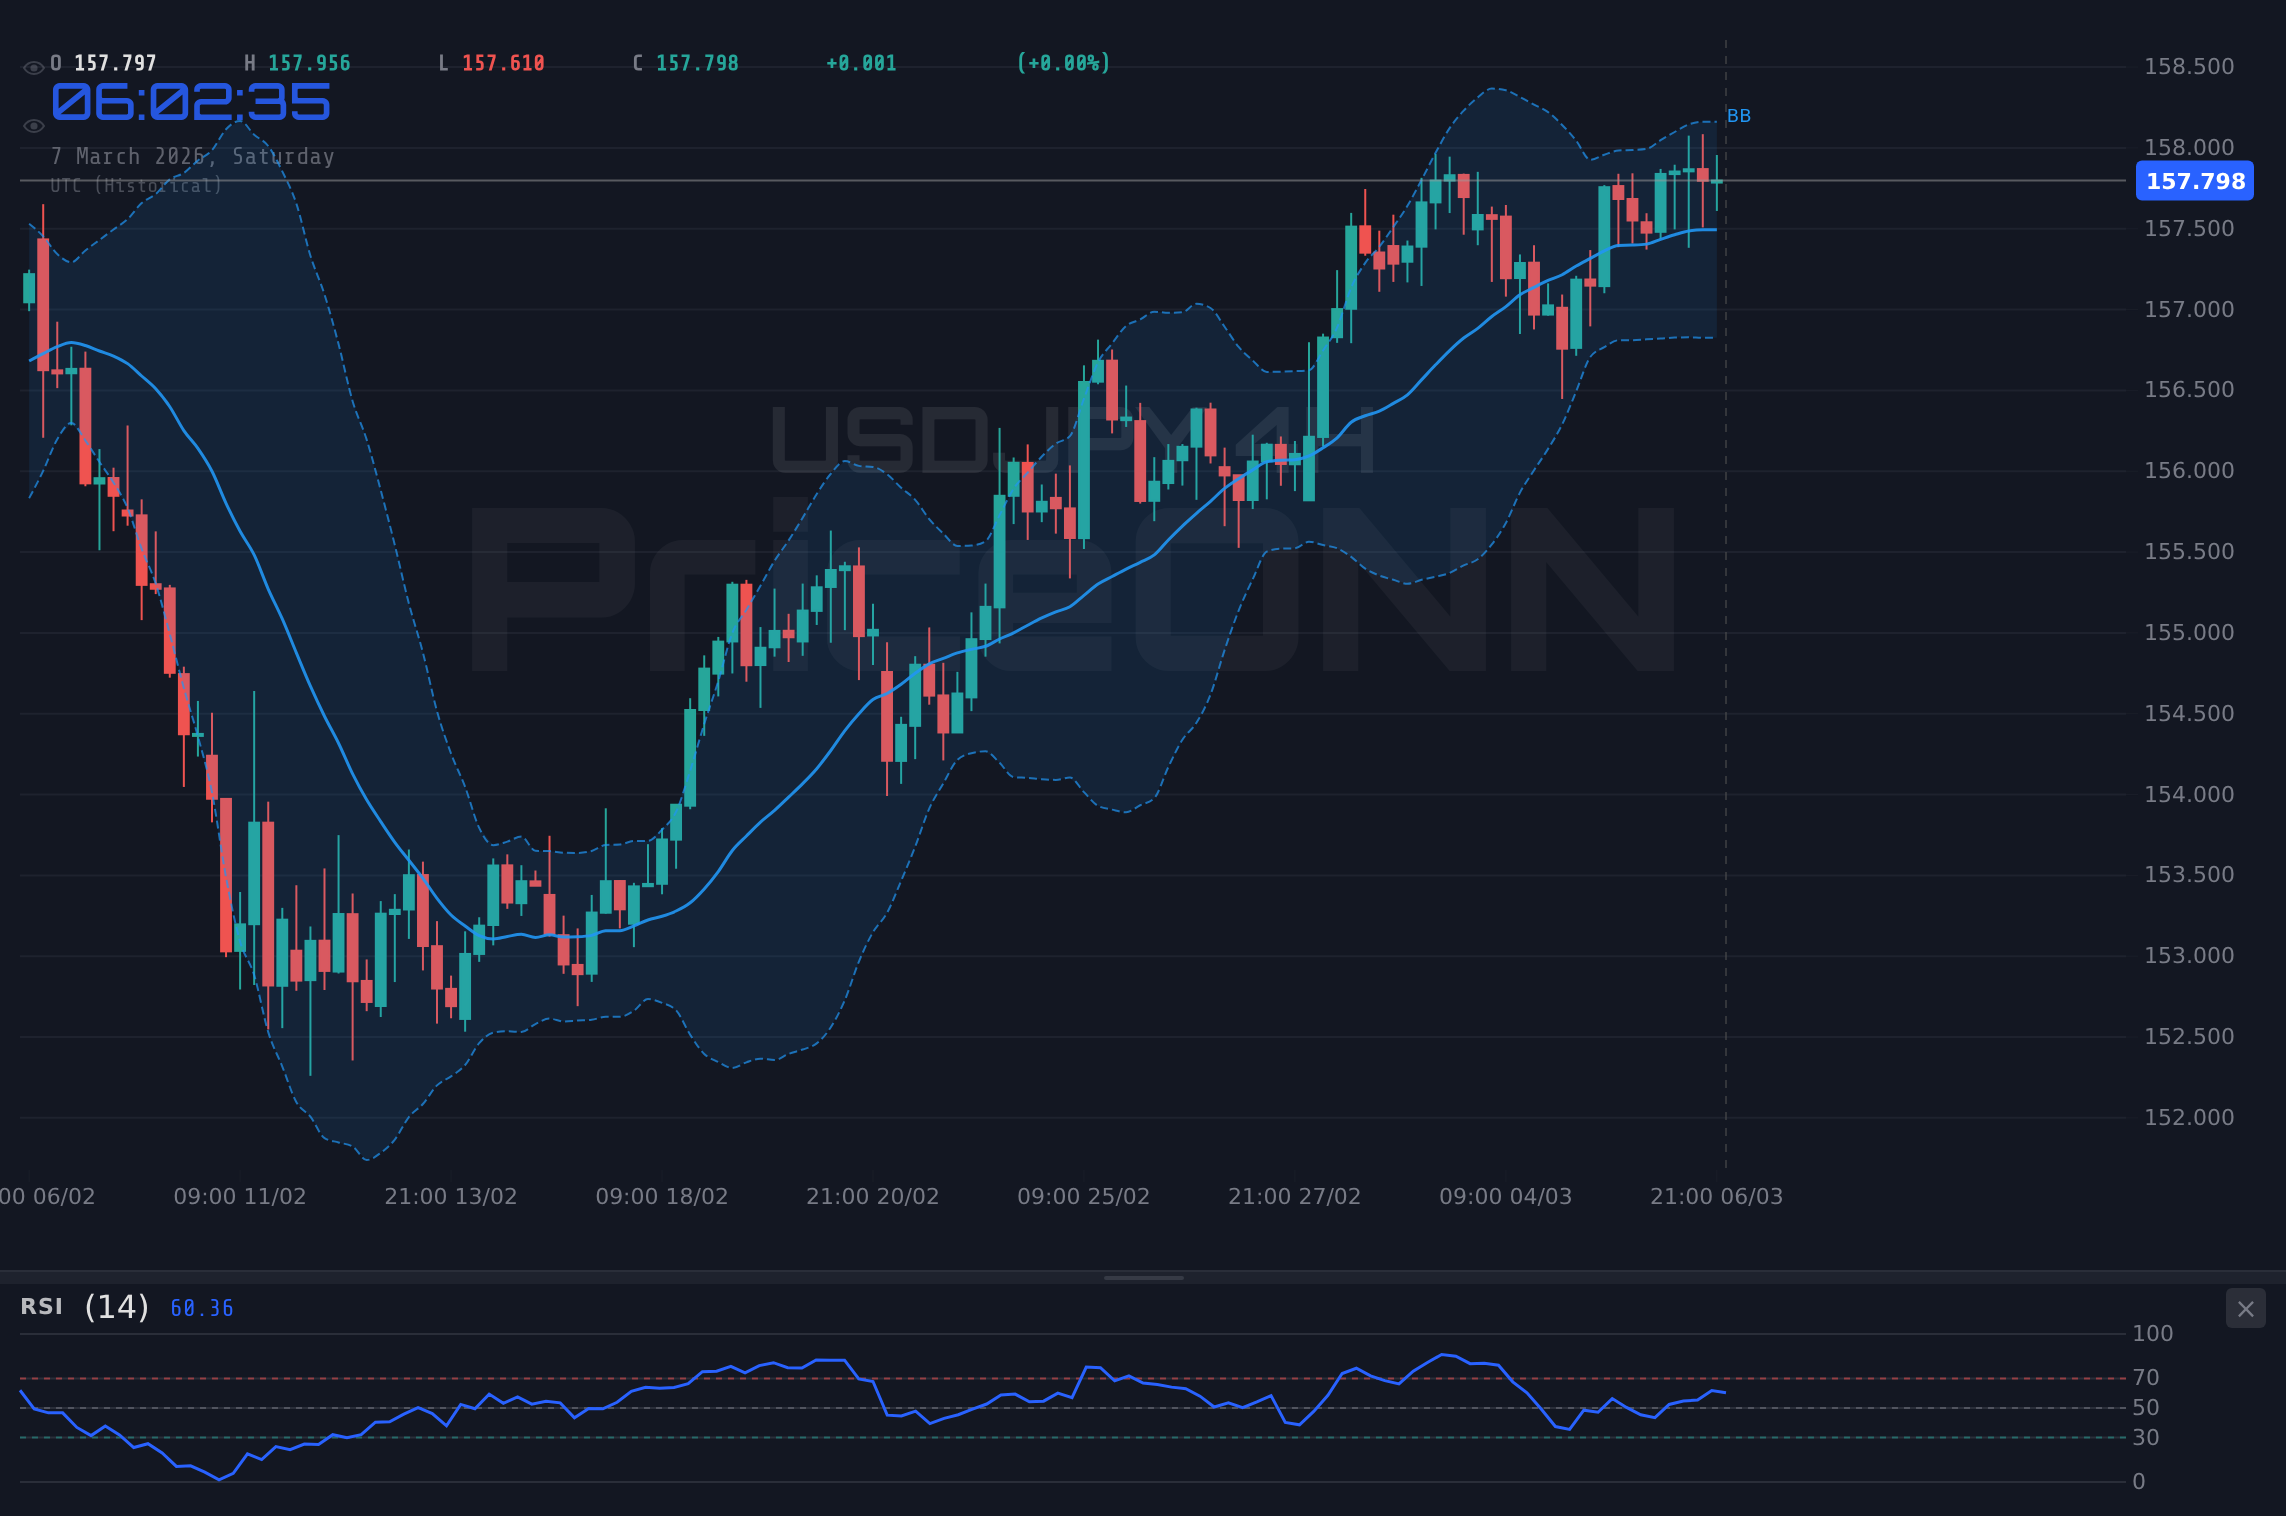
Technically, the 4H chart supports the bullish case. The RSI at 61.6 remains in neutral territory but trends upward, suggesting building bullish momentum. The MACD histogram shows positive momentum above the signal line. According to PriceONN's weekly review, the pair has been consolidating gains, and policy divergence is expected to continue to drive forex trends. The immediate resistance to watch is 158.169, a break above which could trigger a further rally towards 158.469. The USDJPY weekly outlook remains positive as long as the pair defends the 157.00 level, as noted in recent PriceONN analysis.
Furthermore, emerging queries on Google Search Console, such as "Japanese yen safe haven currency status 2026", suggest growing skepticism about the yen's traditional role. If geopolitical tensions ease and risk appetite returns, the yen could weaken further, benefiting USDJPY bulls. A strengthening DXY (currently at 98.71) also bolsters the bullish case, as it typically exerts upward pressure on USDJPY. The ADX on the 4H chart reads 22.83, indicating a moderately strong uptrend.
The Bear Case for USDJPY: Yen Intervention and Risk Aversion
Conversely, the bearish argument for USDJPY revolves around the increasing risk of yen intervention by the Japanese authorities. With USDJPY trading near multi-year highs, the BoJ may feel compelled to step in to support the yen and curb imported inflation. Such intervention could trigger a sharp reversal in USDJPY, catching many bulls off guard. Moreover, escalating tensions in the Middle East, as highlighted in recent PriceONN market news, could fuel safe-haven demand for the yen, undermining the bullish carry trade narrative.
The 1H chart offers some support for the bearish view. The Stochastic oscillator shows %K at 63.92 above %D at 50.07, which can signal overbought conditions. A break below the 1H support at 157.785 could confirm a short-term bearish reversal. While the 1D chart shows a bullish MACD, the Stochastic oscillator shows %K at 86.24 and %D at 86.31, indicating the pair is overbought. The article “USD/JPY Consolidates Gains: Will Policy Divergence Continue to Drive Forex Trends?” published by PriceONN, points to the pair channeling up, awaiting NFP impact, which is supportive of the bearish perspective.
The yen intervention analysis 2026 is a crucial element to consider, as the BoJ may act preemptively to defend the currency. The central bank’s policy uncertainty, as reported by PriceONN, adds to the yen weakness and makes intervention more likely. A surge in oil prices could force central bank action, as noted in recent forex market analysis, impacting USDJPY's trajectory. With the DXY showing a daily change of -0.05%, the dollar's weakness could also contribute to a USDJPY pullback.
The Technical Tiebreaker: Multi-Timeframe Analysis
To resolve the bull-bear debate, a multi-timeframe analysis is essential. The 1H chart currently leans bullish, with the price trading above the middle Bollinger Band. However, the 4H chart presents a more mixed picture, with the RSI at 42.16 and ADX at 41.86 indicating a strong downtrend. The daily chart shows a Stochastic of %K at 28.99 and %D at 33.11, signaling a bearish trend. This suggests that while short-term bullish momentum may persist, the medium-term outlook remains uncertain.
Key levels to watch include the 1H resistance at 157.91 and the 4H support at 157.475. A decisive break above the former could embolden the bulls, while a breach of the latter could pave the way for a deeper correction. Traders should also monitor the DXY, as its movements often correlate inversely with USDJPY. A falling DXY would support the bearish scenario, while a rising DXY would favor the bulls. The Forex Market Awaits US Jobs Data, as PriceONN reported, and USD/JPY Eyes 158.00, adding more volatility to the pair.
The ADX on the 1H chart sits at a low 10.7, signaling a weak trend, meaning the pair lacks strong directional conviction in the very short term. The key is to see if the US jobs data on Wednesday, March 4th, shifts the market sentiment. In the meantime, the market awaits the jobs data. The U.S. Weekly Economic & Financial Commentary mentioned that the February jobs report was uniformly negative, while the forecast on the 4th of March was negative as well. This could weaken the dollar, causing USDJPY to fall.
Having tracked USDJPY through the 2024 rate cycle, I can say that the pair is highly sensitive to rate expectations. The CME FedWatch data, if available, would provide valuable insights into the market's assessment of future rate hikes. For now, caution is warranted until the NFP data resolves this, even if the RSI at 29.7 is in oversold territory.
Historically, when the RSI reaches this zone on USDJPY, the outcome has been mixed, depending on the prevailing fundamental backdrop. The last time this pattern appeared in January 2026, the price subsequently consolidated for a few days before resuming its upward trajectory. The USD/JPY price forecast indicates that bulls are defending 157.00, which builds upside pressure. The geopolitical risks and US data impact forex markets, as highlighted by PriceONN, should be considered. Escalating tensions in the Middle East have triggered a significant surge in crude oil prices, particularly WTI, presenting both opportunities and challenges for USDJPY traders.
The Verdict: Cautious Optimism for USDJPY
While the risk of yen intervention and geopolitical uncertainties cannot be ignored, the prevailing policy divergence between the Fed and the BoJ continues to favor USDJPY upside. The key catalyst to watch is next week's US jobs data, which could either reinforce or undermine the bullish narrative. Until then, traders should exercise caution and focus on key technical levels for potential entry and exit points.
The 1H stochastic reading of 34.64 suggests that momentum is trending downwards, but the RSI of 41.45 on the 4H chart indicates that the asset is not yet in oversold territory. This thesis fails if the price closes below 157.475, which would invalidate the bullish outlook. The ADX reading of 50.51 on the 1H chart indicates a very strong downtrend. A high-probability setup of 65-70% includes a short-term correction before the pair continues upwards due to policy divergence.
Frequently Asked Questions: USDJPY Analysis
Is USDJPY a good buy right now?
USDJPY is currently trading at $157.82. The bullish trend is supported by policy divergence between the Fed and BoJ, but traders should exercise caution. A break above 158.169 resistance could signal a good buy, while a break below 157.475 support could lead to a sell-off.
What is the USDJPY price forecast for this week?
The USDJPY price forecast for this week is cautiously bullish. If the US jobs data is strong, USDJPY could rally towards 158.469. However, yen intervention risks and geopolitical tensions could limit the upside. A 60% probability is assigned to the bullish scenario.
What are the key support and resistance levels for USDJPY?
Key support levels for USDJPY are 157.475 (4H) and 157.785 (1H). Key resistance levels are 157.91 (1H) and 158.169 (4H). A break of these levels will be key to determining the next move.
Why is USDJPY moving today?
USDJPY is moving today due to a combination of factors. Policy divergence between the Fed and BoJ is supporting the pair, while yen intervention risks and geopolitical tensions are weighing on it. The upcoming US jobs data will likely be the primary catalyst for the next significant move.
Track markets in real-time
AI-powered analysis, technical indicators and real-time price data.
Join Our Telegram Channel
Breaking market news, AI analysis and trading signals instantly.
Join Channel