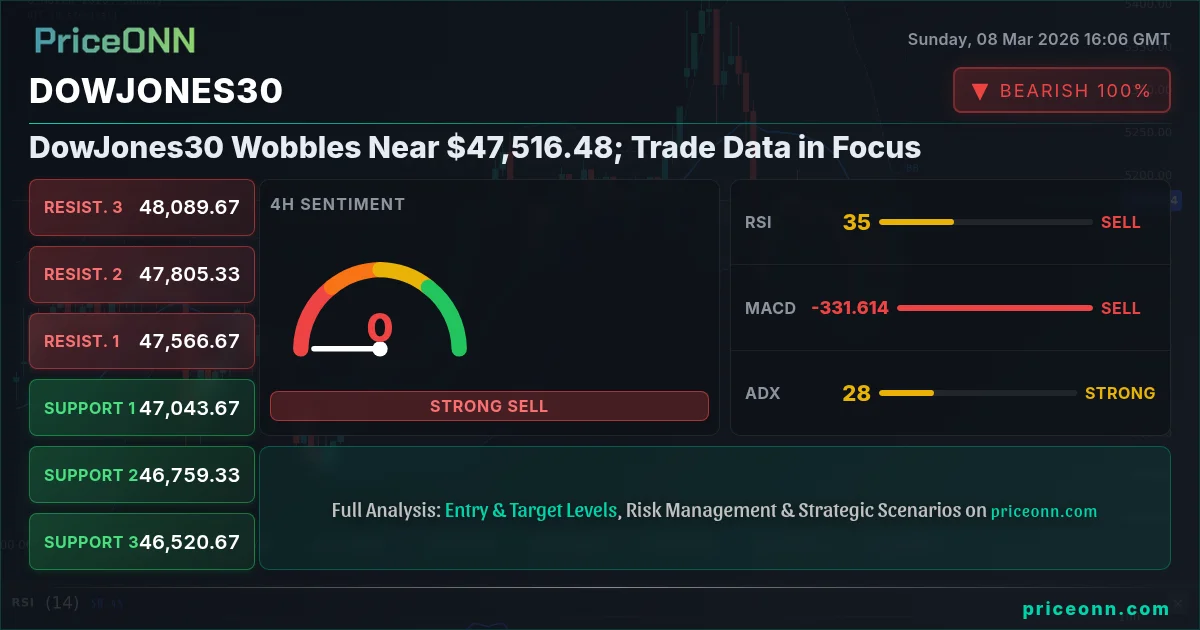
The DowJones30 is locked in a battle between bulls and bears near the $47,516.48 level, as of last Friday's close, struggling to establish a clear direction. With a relatively flat week behind us, all eyes are now turning to the upcoming trade data releases next week, which could provide the necessary impetus for a decisive move.
- DowJones30 is trading near $47,516.48, facing resistance at 47,645.33 on the 1H timeframe.
- Key support lies at 47,344.33, a level that needs to hold to prevent further downside.
- The 1H RSI, currently at 42.04, suggests that the index is neither overbought nor oversold, leaving room for potential movement in either direction.
- Next week's trade data releases are anticipated to be the primary drivers influencing DowJones30's price action.
The Bull Case for DowJones30
The bullish argument for DowJones30 centers around the underlying strength of the U.S. economy and the potential for a rebound in corporate earnings. Despite the recent negative jobs report, as reported by U.S. Weekly Economic & Financial Commentary, the overall economic outlook remains positive. The anticipation of favorable trade data next week could act as a catalyst, propelling the index higher.
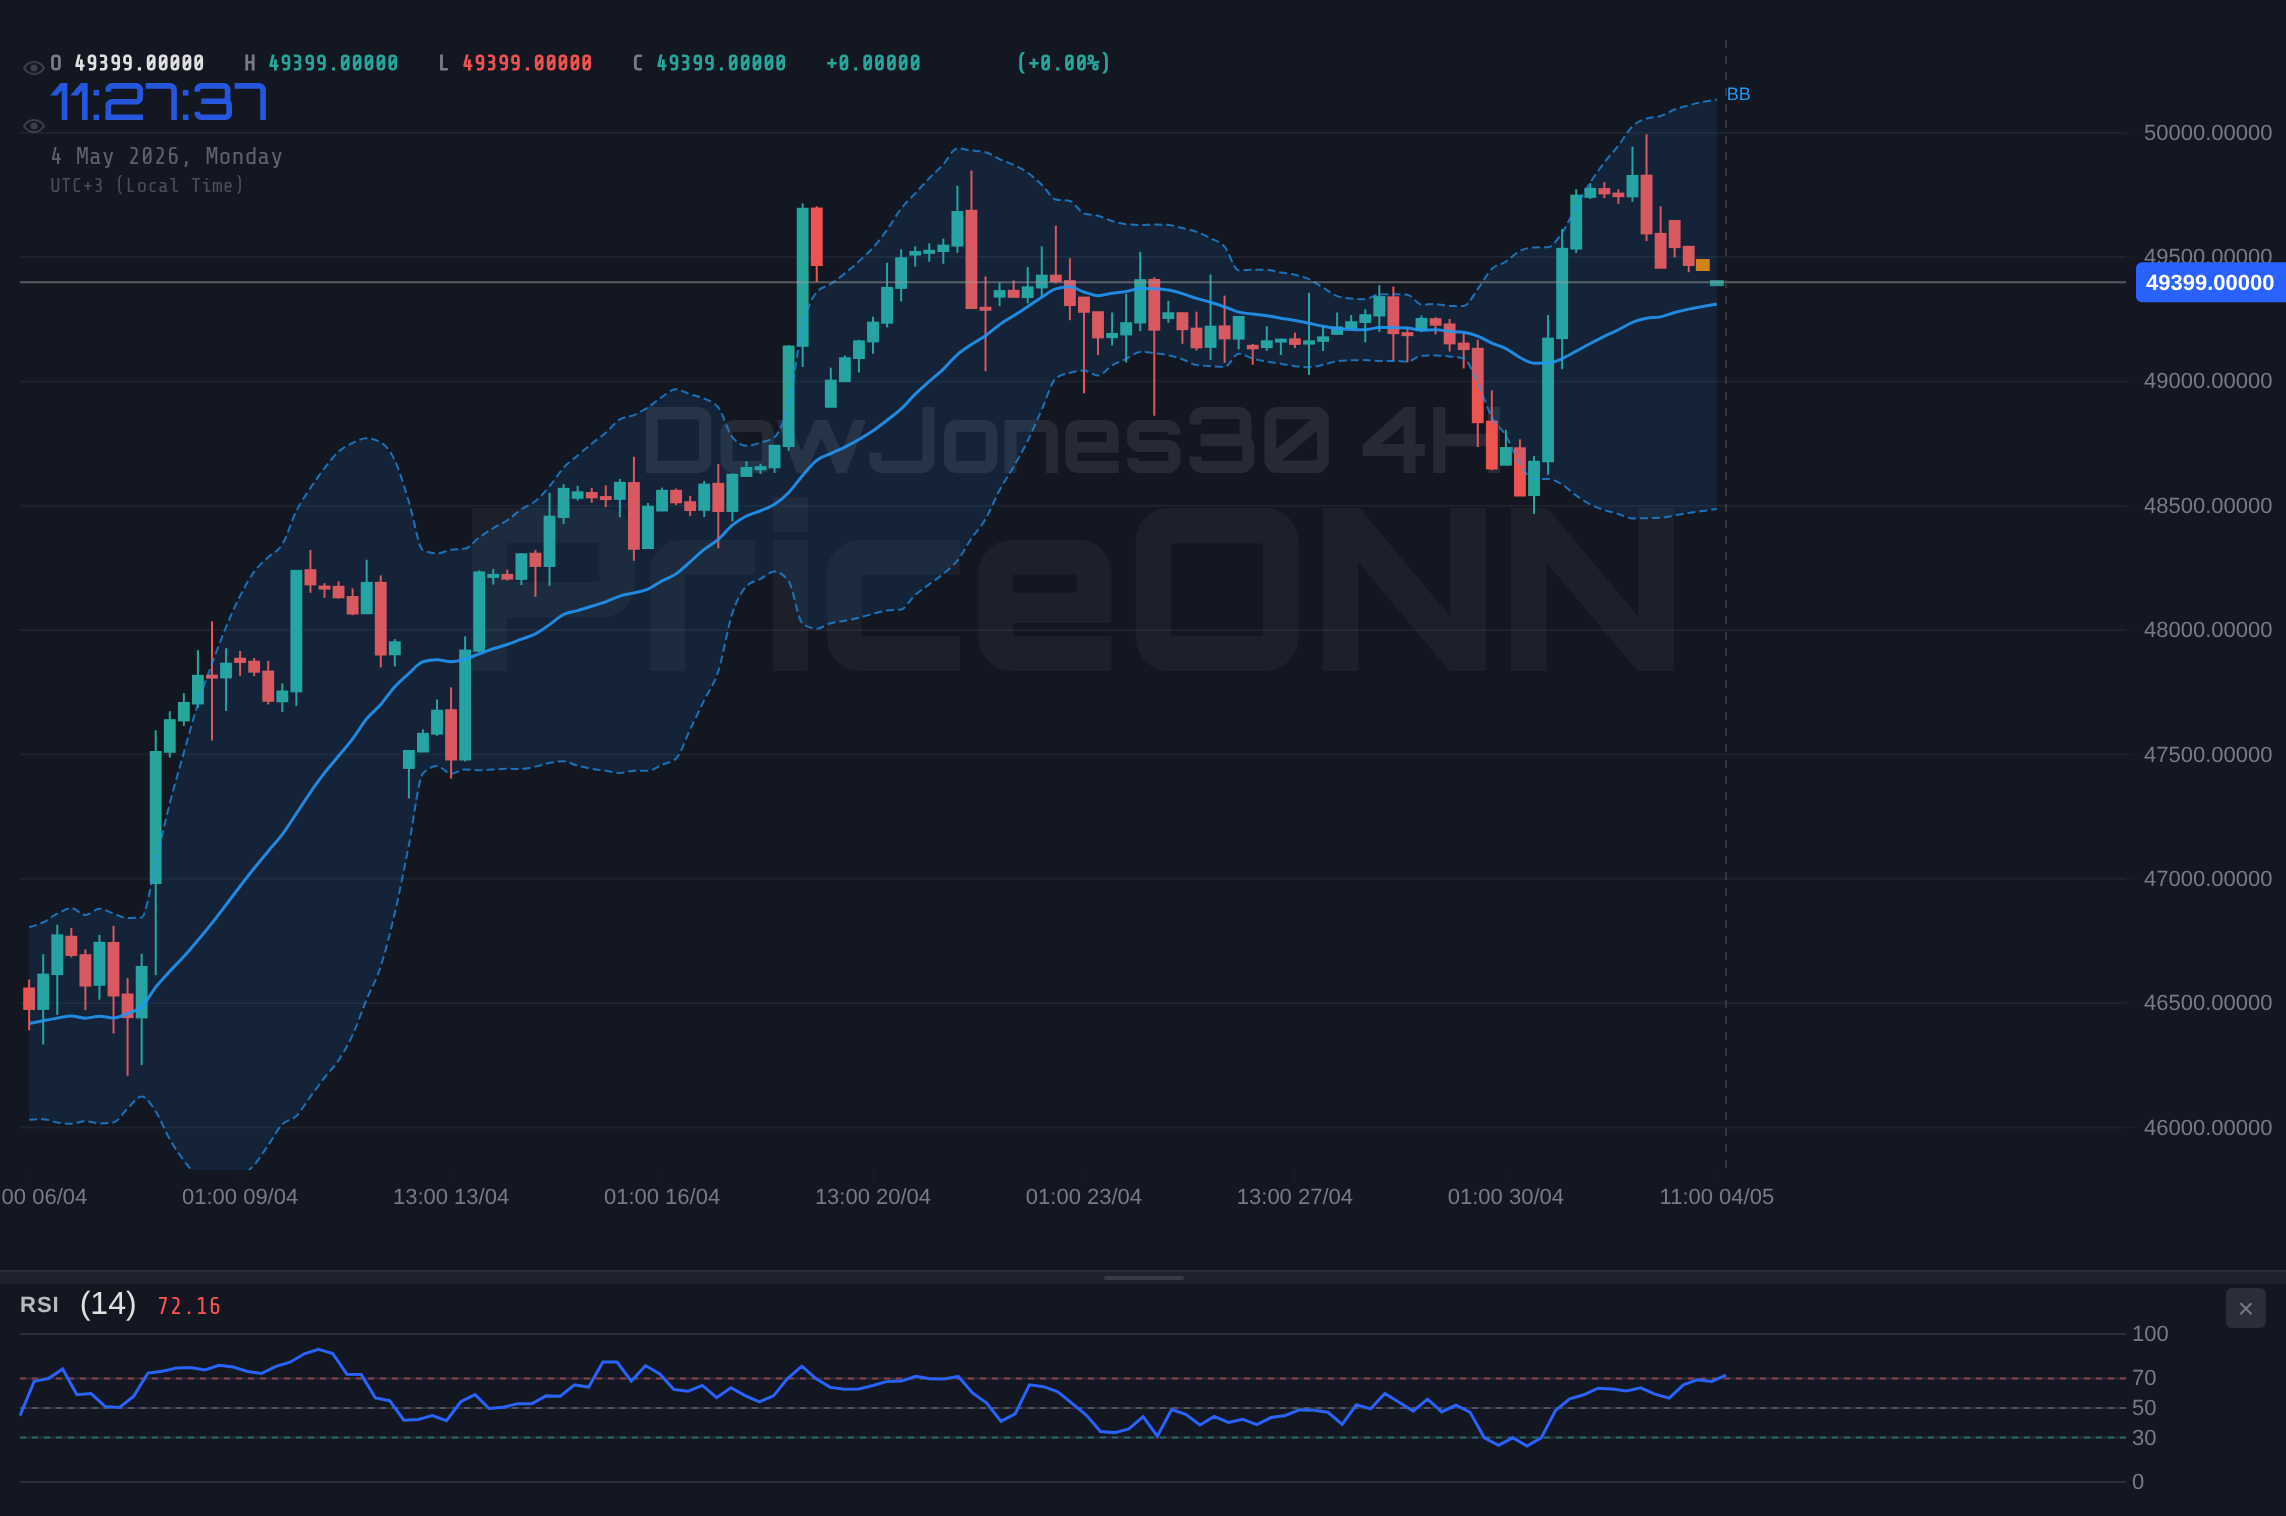
From a technical perspective, the 1D timeframe suggests that DowJones30 is currently in a neutral trend with a 50% strength. The RSI(14) is at 33.2, indicating that it is not yet in oversold territory, leaving room for a potential rally. The MACD histogram, although negative, shows signs of a potential crossover, which could signal a shift in momentum. Moreover, the index is currently trading near the middle Bollinger Band, suggesting that it is neither overbought nor oversold. If the index can break above the immediate resistance at 47,645.33, it could target the higher resistance levels at 48,107.67 and 48,337.33.
Furthermore, the Brent crude oil price, currently at $65.73, is showing signs of strength, which could positively impact the energy sector within the DowJones30. The WTI is even more bullish, trading at $90.66. According to Oil Price Surge, Brent Crude Nears $90 Amid Mideast Tensions, escalation of tensions in the Middle East have contributed to this surge. A rising oil price typically translates to increased profitability for energy companies, potentially boosting their stock prices and contributing to the overall performance of the index.
The Bear Case Against DowJones30
Conversely, the bearish perspective argues that DowJones30 is vulnerable to a correction due to concerns about slowing global growth and potential trade tensions. The recent drop in the SP500, down by 1.07% and Nasdaq100, down by 1.25%, indicates a broader risk-off sentiment in the market. This sentiment could be further exacerbated by disappointing trade data next week, leading to a sell-off in DowJones30.
Technically, the 1H timeframe reveals that DowJones30 is currently in a downtrend with a strength of 95%. The RSI(14) is at 42.04, suggesting that it is not yet in oversold territory, leaving room for further downside. The MACD histogram is negative, indicating bearish momentum, and the Stochastic is showing a potential bearish crossover. The immediate support lies at 47,281.67, and a break below this level could trigger a move towards the lower support levels at 47,185.33 and 47,051.67.
Moreover, the strength of the DXY (Dollar Index), currently at 98.57, could put pressure on DowJones30, as a stronger dollar typically leads to lower corporate earnings for multinational companies. The DXY's 4H timeframe reveals that it is in an uptrend with a strength of 100%, further supporting the bearish argument. The USD is expected to continue its climb next week, putting pressure on DowJones30.
Technicals as the Tiebreaker: A Multi-Timeframe Analysis
To gain a clearer picture of DowJones30's potential trajectory, it's essential to analyze the technical indicators across multiple timeframes. The 1H timeframe paints a bearish picture, with a strong downtrend and negative momentum. However, the 4H timeframe presents a more nuanced view, with the RSI(14) at 35.37 and the Stochastic showing a potential bullish crossover. This divergence suggests that the bearish momentum may be waning, and a potential reversal could be in the cards.
The 1D timeframe provides a longer-term perspective, indicating a neutral trend with a potential shift in momentum. The RSI(14) is at 33.2, suggesting that it is not yet in oversold territory, while the MACD histogram shows signs of a potential crossover. The key level to watch is the immediate resistance at 47,645.33. A break above this level would confirm the bullish thesis and pave the way for a move towards the higher resistance levels.
However, it's crucial to acknowledge the conflicting signals and potential risks. The ADX on the 1H timeframe is at 39.19, indicating a strong downtrend, while the ADX on the 1D timeframe is at 24.36, suggesting a moderate downtrend. This divergence highlights the uncertainty in the market and the need for caution. The key is to wait for confirmation from the trade data releases next week and to monitor the price action around the key support and resistance levels.
Looking at the 1H chart, the Stochastic K is at 45.64 and the D is at 29, suggesting a potential buy signal, but the RSI is at 42.04, which could still be an area for bears to take over. On the 4H chart, the RSI is 35.37, indicating that bears are still in control, but the stochastic is potentially crossing over to the bull side with a K of 15.92 and a D of 22.43. This is not enough to suggest a long position. The stochastic is also in a downtrend on the 1D chart, which is further evidence that bears are in control.
The near term support levels on the 1H timeframe are 47,281.67, 47,185.33, and 47,051.67. Resistance levels on the 1H timeframe are 47,511.67, 47,645.33, and 47,741.67. The 1D timeframe support levels are 47,344.33, 46,810.67, and 46,070.33. The 1D timeframe resistance levels are 48,618.33, 49,358.67, and 49,892.33. Given the range, it might be a good idea to wait for a breakout before making a decision.
Economic Calendar: Trade Data in the Spotlight
The economic calendar for the upcoming week is relatively light, but the trade data releases will be the primary focus for investors. The JPY data on Monday, the USD data on Tuesday, and the EUR data on Wednesday will be the key data points. The market will be looking for any signs of improvement or deterioration in the trade balance, which could significantly impact DowJones30. All of the USD data releases on Thursday and Friday are also important.
Any significant deviations from expectations could trigger a sharp reaction in the market, leading to increased volatility and potential trading opportunities. Traders should closely monitor the data releases and be prepared to adjust their positions accordingly. According to Forex Analysis: Global Economic Data Signals Mixed Trends, mixed trends across major economies have been impacting the forex markets. It is important to note that a lot of the economic data that has been released recently has been mixed.
Key Levels
Support Levels
Resistance Levels
Technical Outlook Summary
| Indicator | Value | Signal |
|---|---|---|
| RSI (14) | 42.04 | Neutral |
| MACD Histogram | Negative | Bearish |
| Stochastic | K=45.64, D=29 | Bullish |
| ADX | 39.19 | Strong Downtrend |
| Bollinger | Middle Band | Watch |
Frequently Asked Questions: DowJones30 Analysis
Is DowJones30 a good buy right now?
Given the current mixed signals, it's prudent to remain cautious. DowJones30 is trading near $47,516.48, and a confirmed breakout above 47,645.33 would signal a potential buying opportunity, while a break below 47,281.67 could lead to further downside.
What is the DowJones30 price forecast for this week?
The price forecast for DowJones30 this week is highly dependent on the upcoming trade data releases. A positive surprise could propel the index towards 48,107.67, while a negative surprise could trigger a move towards 47,051.67. A breakout can be expected in either direction.
What are the key support and resistance levels for DowJones30?
Key support levels for DowJones30 are 47,281.67, 47,185.33, and 47,051.67. Key resistance levels are 47,511.67, 47,645.33, and 47,741.67. A decisive break above or below these levels will dictate the short-term trend.
Why is DowJones30 moving today?
DowJones30 is currently moving due to a combination of factors, including broader market sentiment, economic data releases, and technical indicators. The upcoming trade data releases are expected to be the primary catalyst for the next significant move.
Track markets in real-time
AI-powered analysis, technical indicators and real-time price data.
Join Our Telegram Channel
Breaking market news, AI analysis and trading signals instantly.
Join Channel