ETHUSD ended last week at $1,947.45, showing a bearish dip that has traders wondering about the next move. This decline comes amid mixed signals in the broader market and increasing scrutiny of economic data. Is this a temporary pullback, or does it signal a more significant correction ahead? Let's dig into the technicals and fundamentals to get a clearer picture.
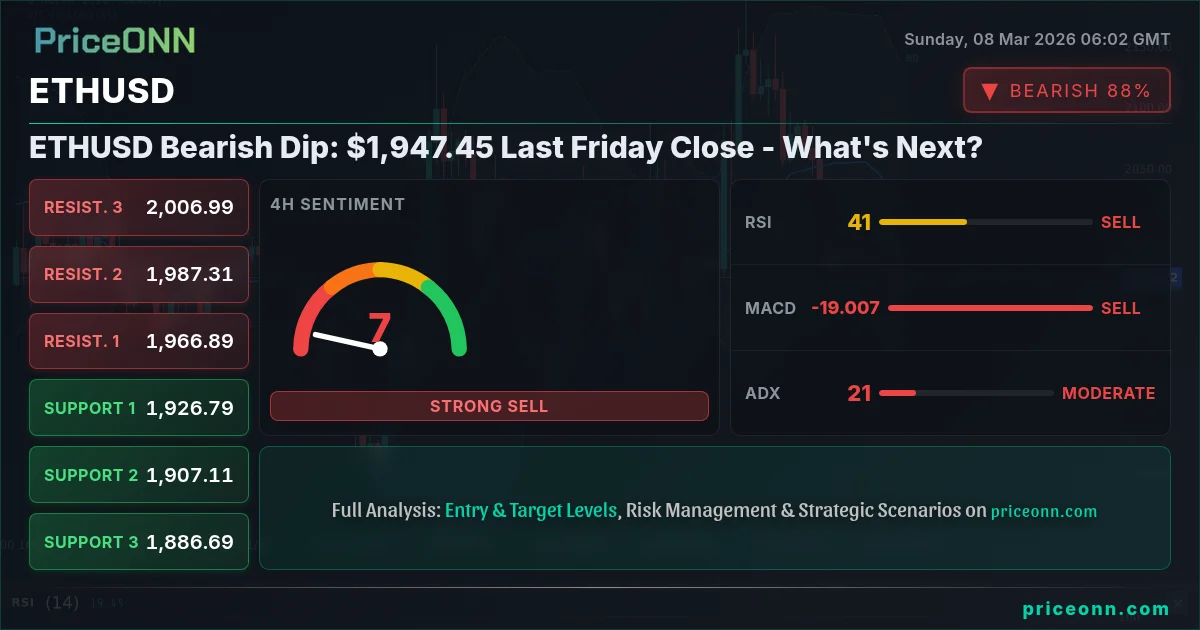
- RSI at 38.23 on the 1H chart indicates increasing selling pressure, but not yet oversold.
- Critical resistance at $1,948.66 must be broken for bullish momentum to resume.
- MACD histogram shows negative momentum: bearish trend may continue in the short term.
- Global economic data signals mixed trends, impacting forex markets and ETHUSD correlation with DXY.
ETHUSD Today Analysis: Technical Breakdown
Looking at the technical indicators, ETHUSD shows a mixed picture. On the 1-hour chart, the RSI sits at 38.23, indicating that sellers are in control, but the pair isn't yet in oversold territory. This suggests there's room for further downside if bearish momentum continues. The MACD histogram, which is negative, supports this view, signaling that the downward trend may persist in the short term. However, the Stochastic oscillator, with %K at 29.62 and %D at 39.88, is hinting at a potential oversold condition, suggesting a possible bounce in the near future. The ADX at 43.93 indicates a strong downtrend on the 1H timeframe, so any bounce should be viewed with caution. A weak trend reading like this means the breakout hasn't committed yet - it could go either way.
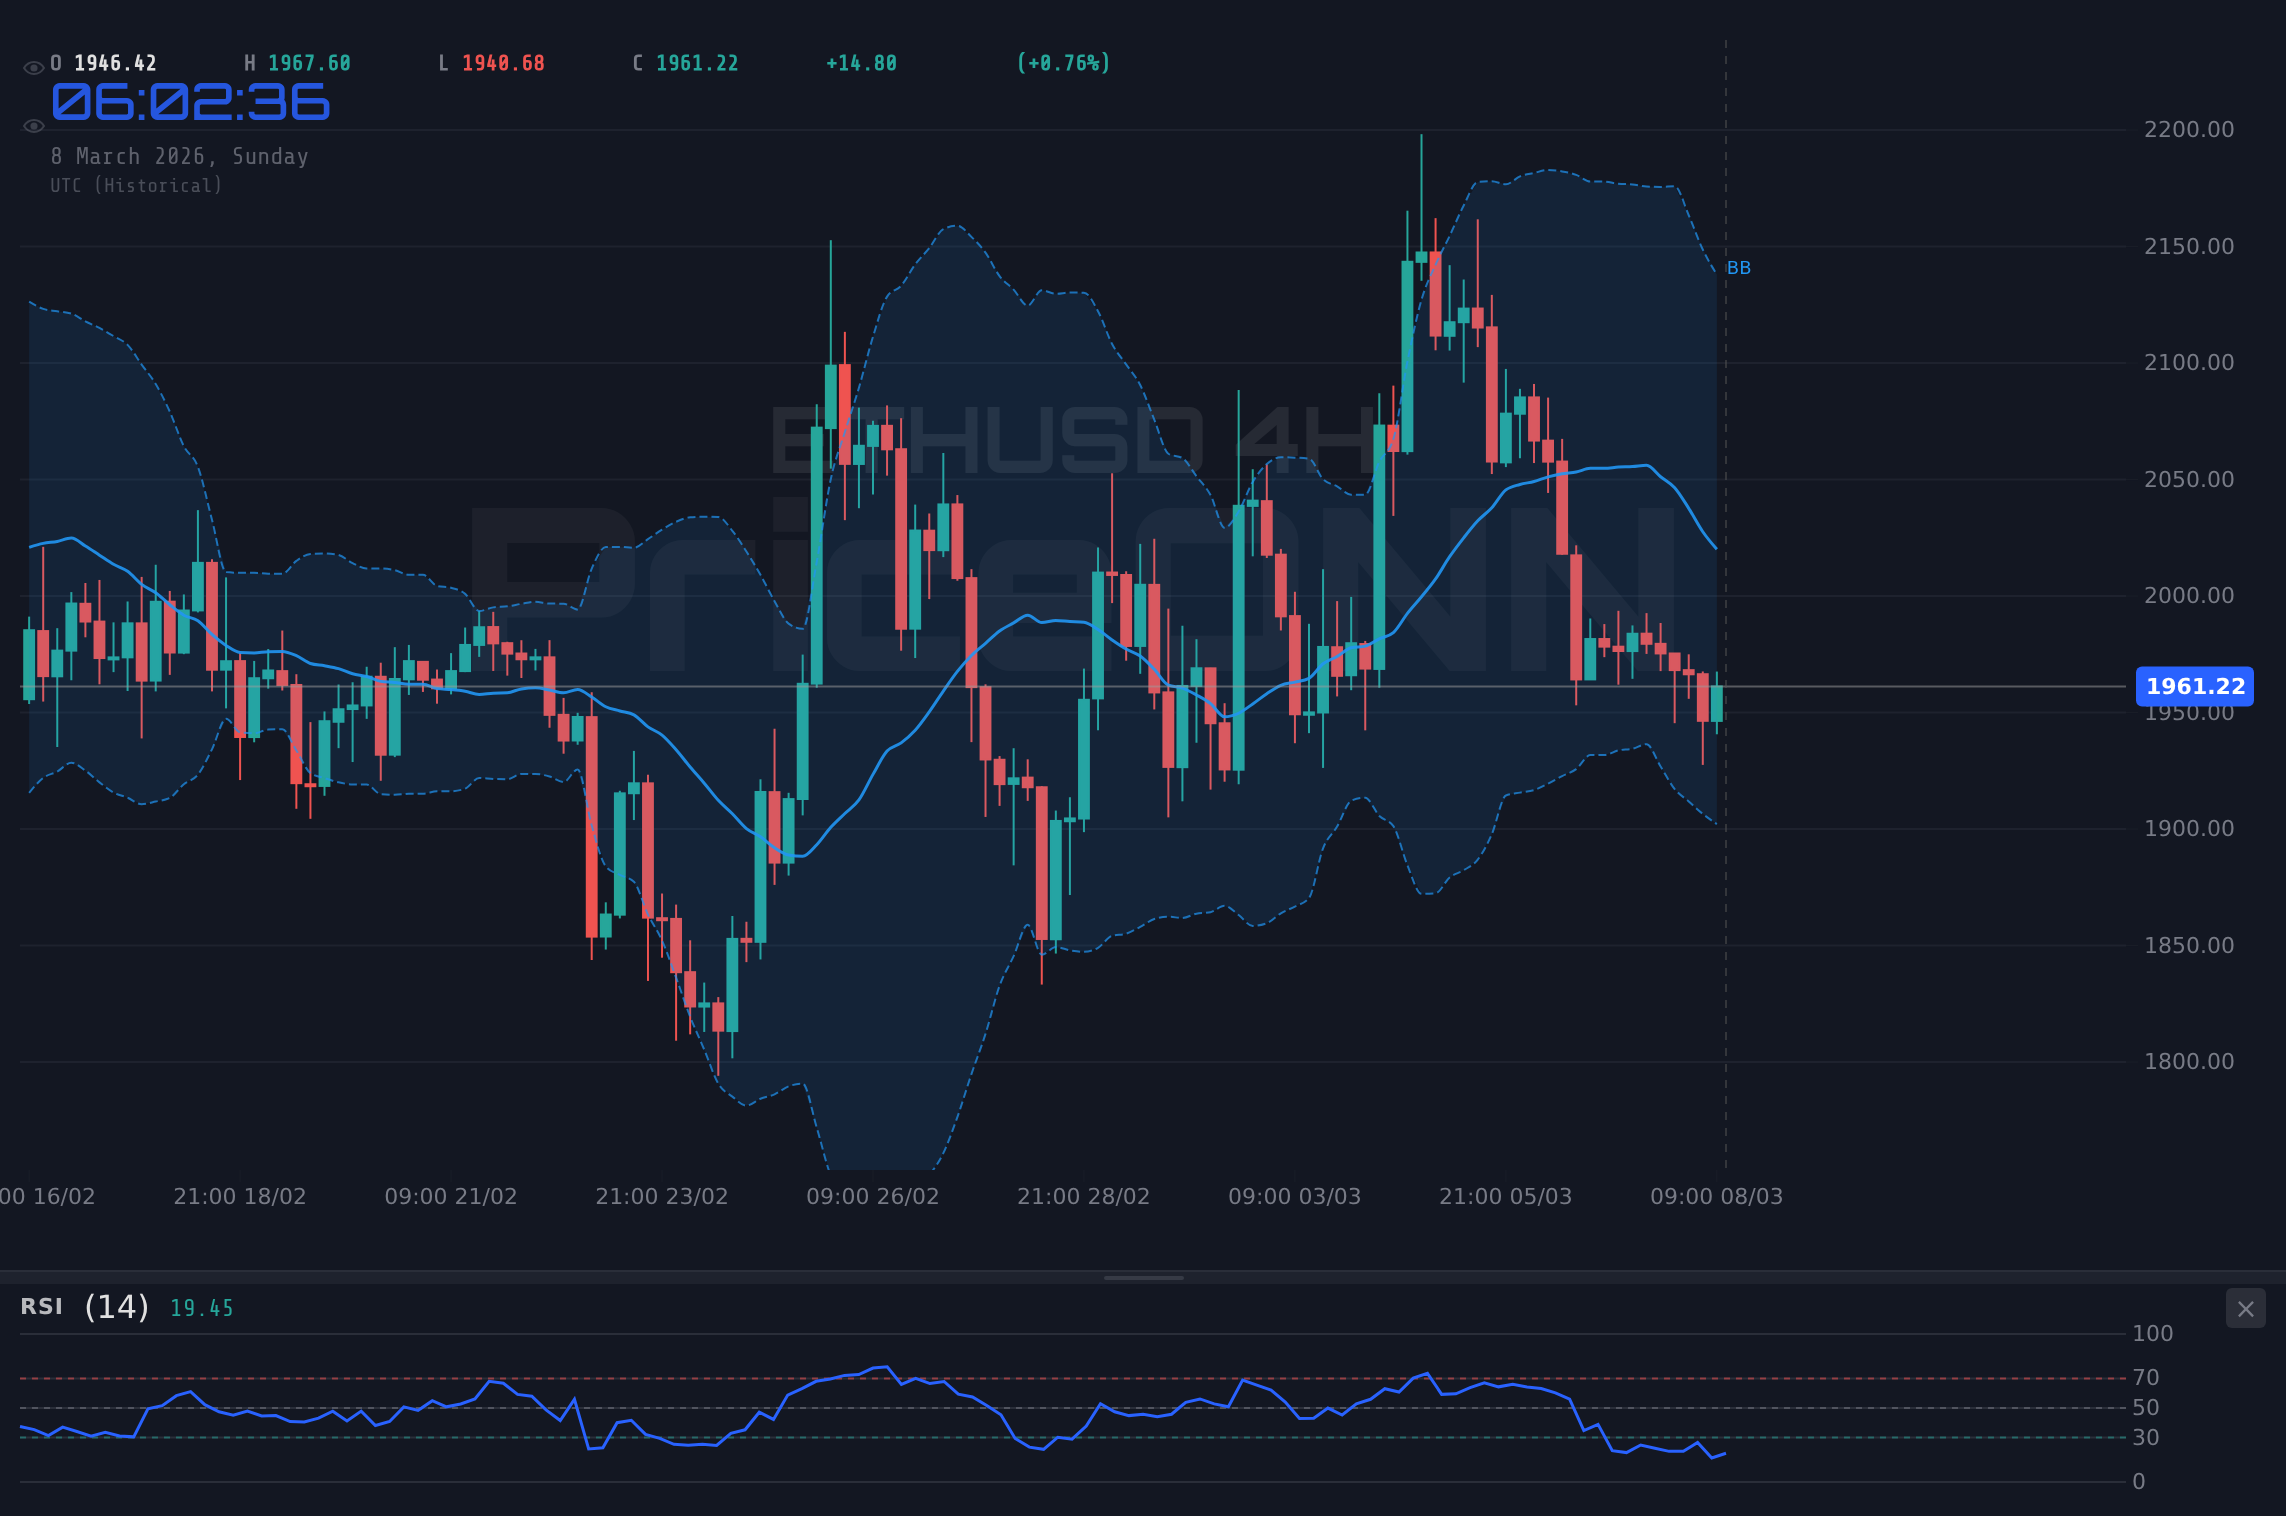
Switching to the 4-hour timeframe, the RSI is at 37.66, reinforcing the bearish sentiment. The MACD is also negative, further confirming the downward momentum. The Stochastic oscillator paints a slightly different picture, with %K at 25.43 and %D at 20.15, suggesting that ETHUSD may be approaching oversold conditions on this timeframe as well. The ADX reading of 20.44 on the 4H chart indicates moderate selling pressure, not a fully committed downtrend.
Zooming out to the daily chart, the RSI is at 43.83, showing that ETHUSD is neither overbought nor oversold on the longer timeframe. The MACD is positive, suggesting that the broader trend may still be bullish, but the current pullback could be a sign of waning momentum. The Stochastic oscillator, with %K at 36.30 and %D at 56.06, points to a potential bearish crossover, which could signal further downside in the coming days. The ADX at 30.12 indicates strong downtrend, and the overall signal on the daily timeframe is SELL.
It's crucial to consider the interplay of these indicators across different timeframes. While the short-term outlook appears bearish, the longer-term trend may still be intact. This highlights the importance of multi-timeframe analysis in ETHUSD trading. The ethereum vs bitcoin comparison 2026 will likely hinge on which trend prevails, making these technicals essential to watch.
Key Levels: Support and Resistance
From a price action perspective, several key levels are worth watching. Immediate resistance sits at $1,948.66, which needs to be broken for bullish momentum to resume. If ETHUSD can clear this hurdle, the next resistance level lies at $1,961.38. On the downside, immediate support can be found at $1,925.38. A break below this level could open the door for a test of $1,914.82, followed by $1,902.10.
For scalpers, these short-term levels are critical for identifying potential entry and exit points. Swing traders may want to focus on the 4-hour chart to gauge the overall trend and look for opportunities to trade in the direction of the prevailing momentum. Long-term investors should pay close attention to the daily chart and consider the broader macroeconomic backdrop when making investment decisions.
Be aware that the oil crisis, triggered by Middle East tensions, is sending shockwaves through forex markets. This situation adds to the uncertainty surrounding ETHUSD. Always manage your risk and use stop-loss orders to protect your capital.
Fundamental Drivers: Macroeconomic Context
Beyond the technicals, several fundamental drivers are influencing ETHUSD. The recent U.S. economic data has been mixed, with the February jobs report showing a slip in nonfarm payrolls by 92K. This negative data could weigh on the dollar, potentially providing some support for ETHUSD. However, the dollar index (DXY) is currently at 98.57, indicating that the greenback remains relatively strong. As the DXY strengthens, pressure is put on ETHUSD, and other major currency pairs.
Looking ahead, several key economic events could impact ETHUSD. On Monday, March 9, Japan will release its data, which could influence the yen and, in turn, impact USDJPY and other related pairs. On Tuesday, March 10, the U.S. will release data, which could provide further insights into the health of the American economy. On Wednesday, March 11, the Eurozone will release data, which could affect the euro and EURUSD.
Traders should also keep an eye on developments in the oil market. The escalating tensions in the Middle East and the resulting surge in crude oil prices are impacting global forex markets. The EUR/CAD pair, for example, has experienced a sharp decline due to the oil crisis. While the direct impact on ETHUSD may be limited, the broader risk-off sentiment could weigh on risk assets like cryptocurrencies.
Ethereum vs Bitcoin Comparison 2026: The Broader Landscape
When assessing ETHUSD's potential, it's impossible to ignore the larger context of the ethereum vs bitcoin comparison 2026. Bitcoin, still the dominant cryptocurrency, often sets the tone for the entire market. Any significant movements in Bitcoin's price tend to ripple through the altcoin space, including Ethereum. Therefore, monitoring BTCUSD is essential for ETHUSD traders.
Currently, BTCUSD is trading at $67,164, showing a slight daily decline. The technical indicators for Bitcoin are also mixed, with the short-term outlook appearing bearish. However, like Ethereum, the longer-term trend for Bitcoin may still be intact. The key difference lies in their utilities and potential future applications. Ethereum's smart contract capabilities and the ongoing development of DeFi (decentralized finance) give it a unique edge in the long run.
Institutional investors are also increasingly looking at the ethereum vs bitcoin comparison 2026. While Bitcoin is often seen as a store of value, Ethereum is viewed as a platform for innovation and disruption. This distinction could lead to increased institutional interest in Ethereum over time, potentially driving ETHUSD higher.
Correlations: DXY, Equities, and Oil
Understanding the correlations between ETHUSD and other asset classes is crucial for making informed trading decisions. As mentioned earlier, the dollar index (DXY) has an inverse relationship with ETHUSD. When the DXY rises, ETHUSD tends to fall, and vice versa. Therefore, monitoring the DXY is essential for ETHUSD traders. With DXY at 98.57, ETHUSD is under pressure.
Equities also play a role in ETHUSD's price action. When the SP500 and Nasdaq are rising, it indicates increased risk appetite, which can be positive for cryptocurrencies. Conversely, when equities are falling, it suggests a risk-off environment, which can weigh on ETHUSD. Currently, the SP500 is trading at 6743.17, showing a daily decline, while Nasdaq is at 24657.05, also in negative territory. This risk-off sentiment could put downward pressure on ETHUSD.
Oil prices can also impact ETHUSD through their influence on inflation expectations. Rising oil prices tend to fuel inflation, which can lead to increased demand for safe-haven assets like gold and potentially Bitcoin. This can indirectly impact ETHUSD as well. Currently, WTI crude oil is trading at $90.66, showing a significant daily gain. This could contribute to inflationary pressures and potentially support ETHUSD in the longer term.
Trading Strategy: Patience and Risk Management
Given the mixed technical signals and the uncertain macroeconomic backdrop, a patient approach is warranted for ETHUSD trading. It's essential to wait for clear confirmation of a trend before entering a position. For scalpers, this means focusing on short-term levels and trading in the direction of the prevailing momentum. Swing traders may want to wait for a break above $1,948.66 or a break below $1,925.38 before initiating a position.
Long-term investors should consider the broader ethereum vs bitcoin comparison 2026 and assess the potential for increased institutional interest in Ethereum over time. However, it's crucial to manage risk and diversify your portfolio. Cryptocurrencies are inherently volatile, and it's essential to only invest what you can afford to lose.
Risk management is paramount in ETHUSD trading. Always use stop-loss orders to protect your capital and avoid over-leveraging your positions. Be aware of the potential for sudden price swings and adjust your trading strategy accordingly.
| Indicator | Value | Signal | Interpretation |
|---|---|---|---|
| RSI (1H) | 38.23 | Bearish | Increasing selling pressure |
| MACD (1H) | Negative | Bearish | Downward momentum |
| Stochastic (1H) | K=29.62, D=39.88 | Neutral | Potential oversold |
| ADX (1H) | 43.93 | Bearish | Strong downtrend |
| RSI (1D) | 43.83 | Neutral | Neither overbought nor oversold |
Frequently Asked Questions: ETHUSD Analysis
Is ETHUSD a good buy right now?
Given the current bearish dip to $1,947.45 and mixed signals from technical indicators, it's prudent to wait for confirmation. A break above $1,948.66 could signal a buying opportunity, while a break below $1,925.38 may warrant caution.
What is the ETHUSD price forecast for this week?
The ETHUSD price forecast for this week is uncertain, with potential for both upside and downside. A bullish scenario could see ETHUSD testing $1,961.38, while a bearish scenario could see it falling to $1,914.82.
What are the key support and resistance levels for ETHUSD?
Key support levels for ETHUSD are $1,925.38, $1,914.82, and $1,902.10. Key resistance levels are $1,948.66, $1,961.38, and $1,971.94, all based on current market data.
Why is ETHUSD moving today?
ETHUSD is moving today due to a combination of factors, including mixed U.S. economic data, strength in the dollar index (DXY), and broader risk-off sentiment in the market. The oil crisis adds to the uncertainty.
Track markets in real-time
AI-powered analysis, technical indicators and real-time price data.
Join Our Telegram Channel
Breaking market news, AI analysis and trading signals instantly.
Join Channel