BRENT Bulls Grip Market at $65.73 Amid Quiet Data
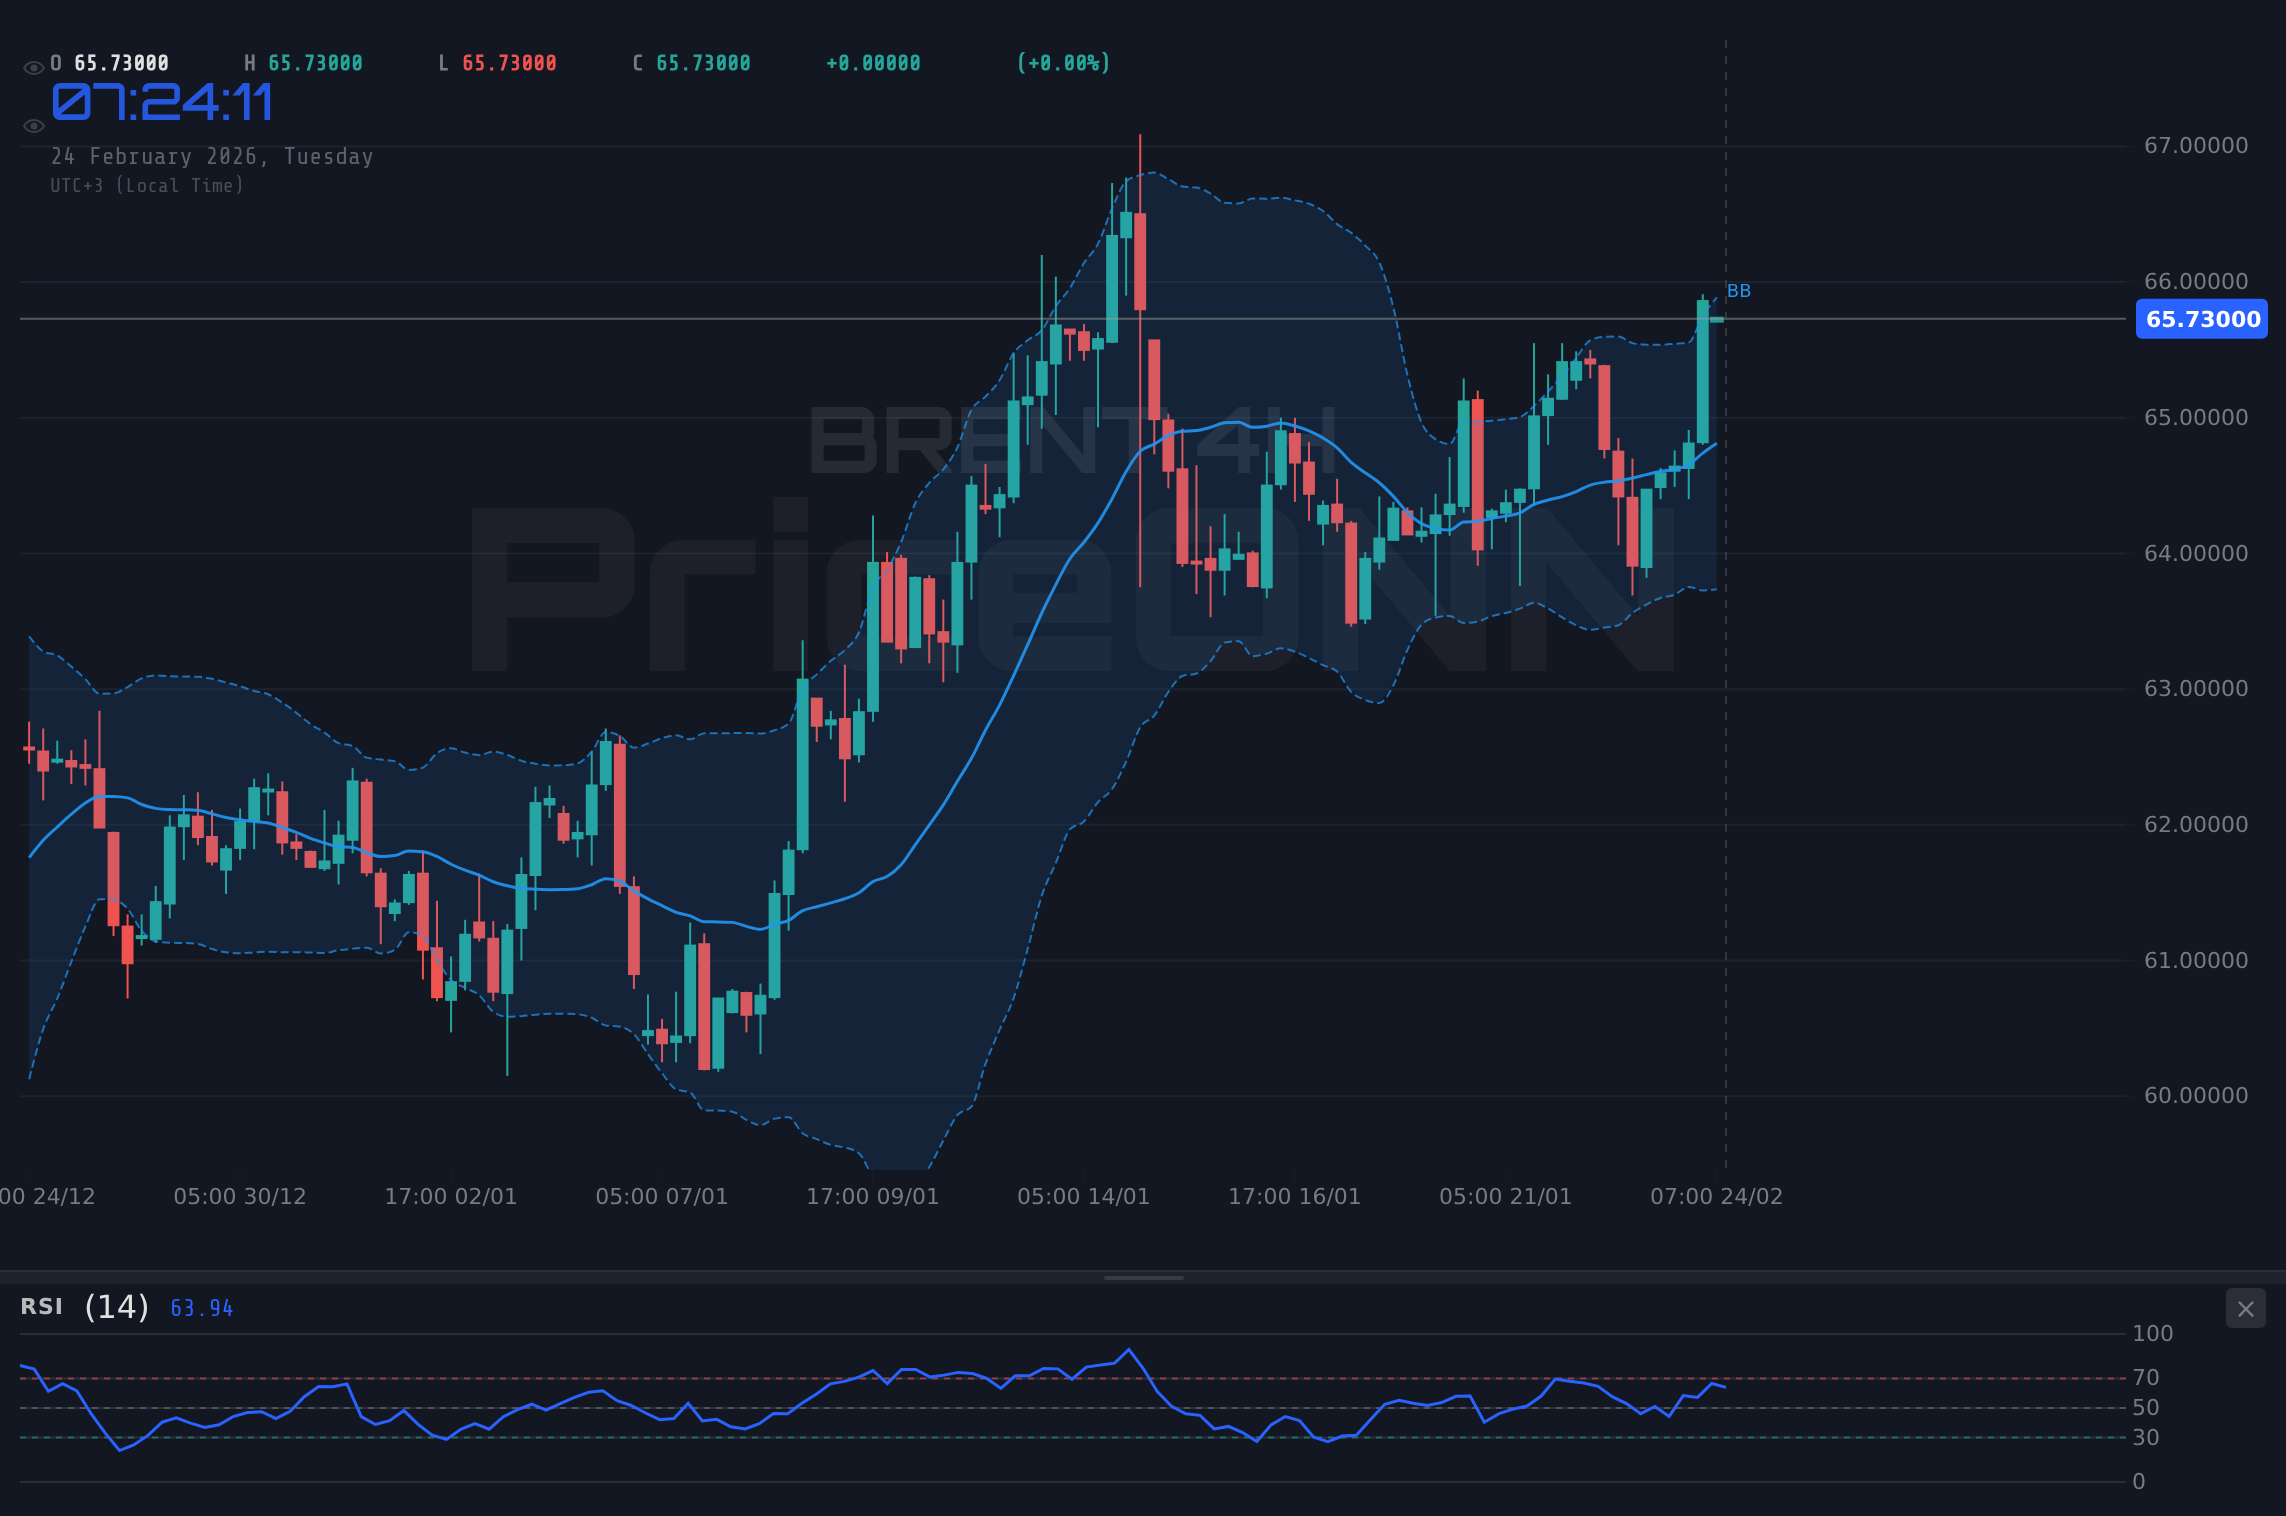
BRENT crude oil is trading at $65.73, up 1.96% today, as bulls maintain control despite a quiet economic calendar. Key resistance levels are being tested.
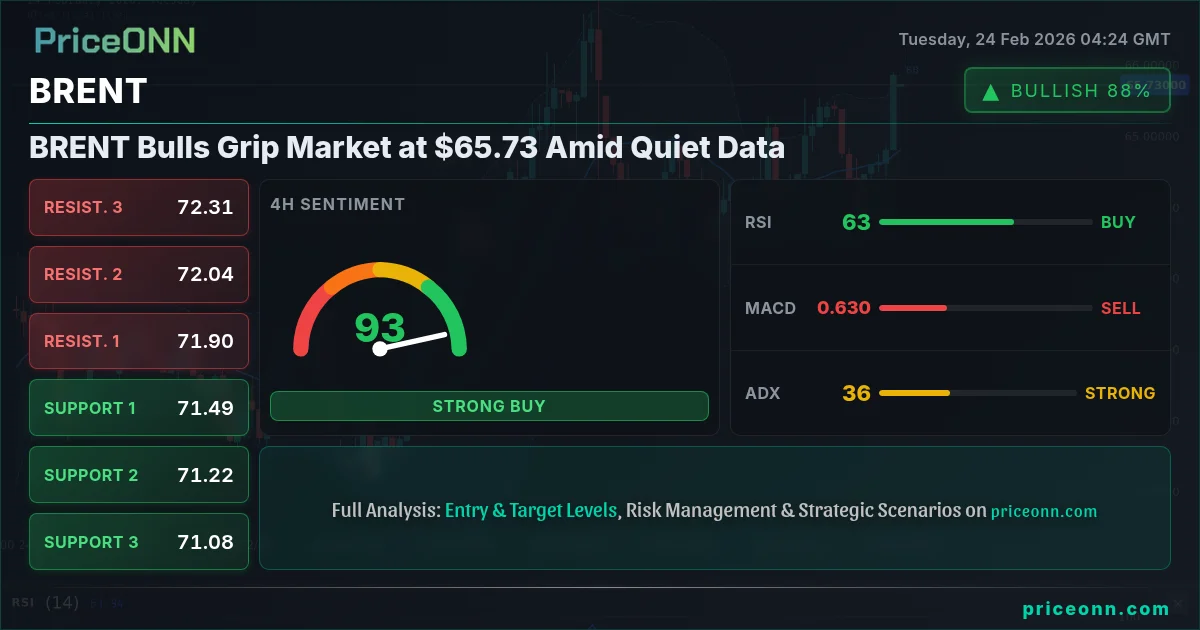
BRENT crude oil is currently trading at $65.73, marking a 1.96% increase on the day. This bullish momentum is occurring despite a relatively quiet economic calendar, suggesting underlying strength in the market driven by factors beyond immediate data releases. The bulls appear to be firmly in control, pushing prices towards key resistance levels that could dictate the short-term trajectory of BRENT.
- RSI at 71.16 signals overbought conditions, potentially leading to a pullback.
- Key resistance sits at $67.33, a break above which could trigger further upside.
- Stochastic at 90.49 in the 1H timeframe suggests short-term overbought conditions.
- Geopolitical factors and OPEC+ supply decisions are key drivers of BRENT's correlation with DXY.
Looking at the hourly chart, BRENT's RSI is currently at 71.16, indicating that the market may be approaching overbought territory. This suggests that the current bullish momentum might be unsustainable in the short term and a period of consolidation or a minor pullback could be on the cards. However, it's important to note that overbought conditions don't necessarily signal an immediate reversal, and prices can remain elevated for an extended period, especially if strong underlying demand persists. The hourly Stochastic, with %K at 90.49 and %D at 81.87, reinforces this overbought view, hinting at a potential near-term cooling-off period.
On the 4-hour timeframe, the RSI stands at 62.33, still within neutral territory but trending upwards, suggesting that the bullish momentum has room to continue. The MACD shows positive momentum, further supporting the bullish outlook. The ADX, however, is at a relatively weak 13.59, indicating a lack of strong trend conviction. This suggests that while the price is moving upwards, the trend is not particularly strong and could be susceptible to reversals. The Stochastic, with %K at 68.29 and %D at 44.75, also points to continued bullishness, but the divergence between the %K and %D lines warrants caution.
Zooming out to the daily chart, the RSI is at 59.99, also in neutral territory and trending upwards, suggesting that the longer-term trend remains bullish. The MACD also supports this view, showing positive momentum. The ADX is at 28.64, indicating a strong trend, confirming the daily chart's bullish outlook. The Stochastic indicator, with %K at 54.52 and %D at 58.52, presents a bearish crossover, signaling potential downward pressure in the near term. This divergence between the momentum indicators suggests that the daily chart's bullishness may face some headwinds.
Key support levels to watch are $65.20, $65.10, and $64.99 on the hourly chart. A break below these levels could signal a weakening of the bullish momentum and a potential shift towards a more bearish outlook. On the upside, resistance levels to watch are $65.41, $65.52, and $65.62. A decisive break above these levels could pave the way for further gains and a test of higher price targets. The daily resistance level at $67.33 is particularly significant, as a sustained break above this level would confirm the longer-term bullish trend and open the door for a move towards $68 and beyond.
It's also important to consider the broader market context. The DXY (Dollar Index) is currently at 97.55, up 0.14% on the day. A stronger dollar typically puts downward pressure on commodity prices, including BRENT. However, the current bullish momentum in BRENT suggests that other factors, such as supply constraints or geopolitical risks, are outweighing the impact of the stronger dollar. The SP500 is up 0.2% at 6857.5, while the Nasdaq100 is up 0.39% at 24822.27, indicating a positive risk sentiment in the market. This positive sentiment could be contributing to the bullishness in BRENT, as investors seek exposure to risk assets.
Geopolitical tensions in key oil-producing regions also play a significant role in supporting BRENT prices. Any escalation of conflicts or disruptions to supply chains could lead to a sharp increase in prices. Therefore, traders should closely monitor geopolitical developments and their potential impact on the oil market. OPEC+ supply decisions are also crucial to watch. Any announcements regarding production cuts or increases could have a significant impact on BRENT prices. According to Reuters, OPEC+ is scheduled to meet next month to discuss its production policy. The market will be closely watching this meeting for any signals regarding future supply levels.
The conflicting signals from the technical indicators across different timeframes highlight the importance of considering multiple factors when trading BRENT. While the hourly and daily charts suggest potential overbought conditions and downward pressure, the 4-hour chart and the longer-term trend remain bullish. Traders should therefore exercise caution and wait for confirmation signals before entering any positions. A break above the $65.62 resistance level on the hourly chart would confirm the short-term bullish momentum, while a break below the $65.20 support level would signal a potential shift towards a bearish outlook.
The current market environment presents both opportunities and risks for BRENT traders. The bullish momentum suggests that there is potential for further gains, but the overbought conditions and the potential for a stronger dollar warrant caution. Traders should therefore carefully manage their risk and wait for confirmation signals before entering any positions. The key levels to watch are the $65.62 resistance and the $65.20 support on the hourly chart, as well as the $67.33 resistance on the daily chart.
Looking ahead, BRENT prices are likely to remain volatile in the near term, as the market grapples with conflicting signals and uncertainties surrounding supply and demand. Traders should therefore be prepared for choppy trading conditions and be nimble in their approach. The key drivers to watch will be geopolitical developments, OPEC+ supply decisions, and the broader macroeconomic environment. The next few weeks could be crucial in determining the longer-term trajectory of BRENT prices.
| Indicator | Value | Signal | Interpretation |
|---|---|---|---|
| RSI (1H) | 71.16 | Overbought | Potential for a pullback |
| MACD (1H) | Positive | Bullish momentum | |
| Stochastic (1H) | 90.49/81.87 | Overbought | Near-term cooling off |
| ADX (1H) | 19.03 | Weak Trend | Trend strength is weak |
| RSI (1D) | 59.99 | Neutral | Longer-term trend remains bullish |
Frequently Asked Questions: BRENT Analysis
Is BRENT a good buy right now?
BRENT presents a mixed picture. While it is currently trading at $65.73 and showing bullish momentum, the RSI at 71.16 suggests it may be overbought in the short term. Waiting for a pullback towards the $65.20 support level before considering a long position may be prudent.
What is the BRENT price forecast for this week?
The BRENT price forecast for this week is cautiously bullish. A break above the $65.62 resistance level could lead to a test of the $67.33 daily resistance. However, overbought conditions suggest a potential pullback towards $65.20 before further upside.
What are the key support and resistance levels for BRENT?
Key support levels for BRENT are $65.20, $65.10, and $64.99. Key resistance levels are $65.41, $65.52, and $65.62. A break of these levels could dictate the short-term trajectory of BRENT.
Why is BRENT moving today?
BRENT is moving higher today, up 1.96% to $65.73, due to a combination of factors including positive risk sentiment in the market and potential concerns about future supply, outweighing the negative impact of a stronger dollar.
Track markets in real-time
AI-powered analysis, technical indicators and real-time price data.
Join Our Telegram Channel
Breaking market news, AI analysis and trading signals instantly.
Join Channel