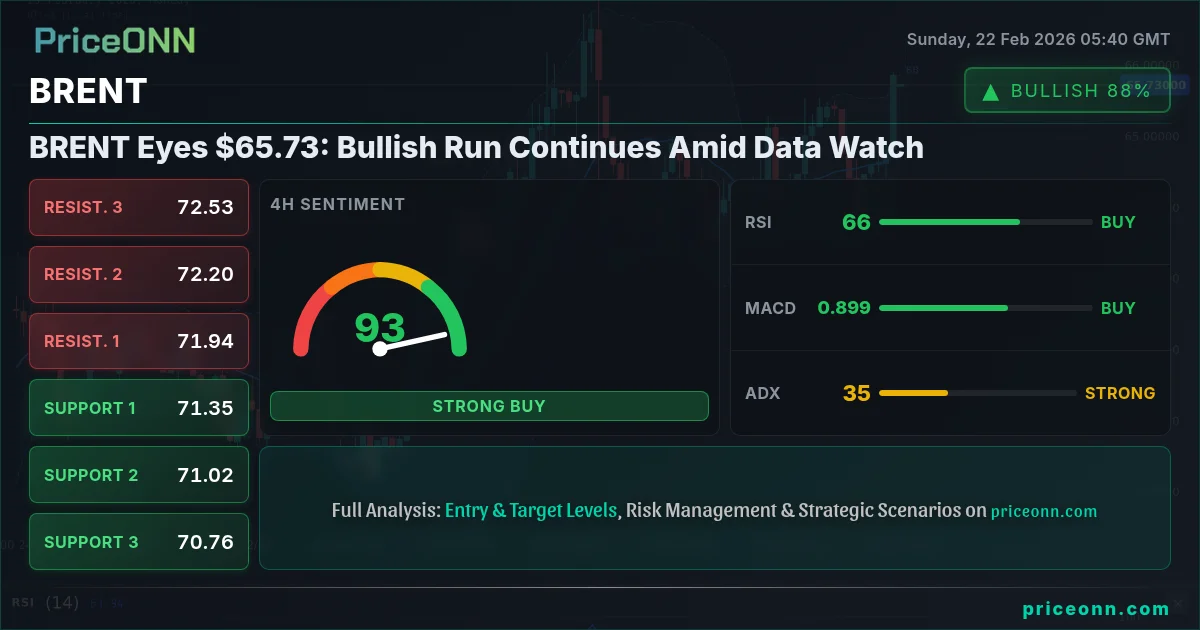
BRENT Eyes $65.73: Bullish Run Continues Amid Data Watch
Brent crude oil closed last Friday at $65.73, continuing its bullish trend. Key data releases next week could further fuel or stall this momentum.
Last Friday's close saw BRENT at $65.73, marking a continuation of its recent upward trajectory. This bullish run has been influenced by various factors, including geopolitical tensions and supply-demand dynamics. However, with several significant economic data releases on the horizon next week, the sustainability of this trend is under scrutiny.
- BRENT closed last Friday at $65.73, extending its bullish momentum.
- Key support level identified at $65.20, providing a potential safety net for bulls.
- RSI (1H) at 71.16 suggests overbought conditions, signaling a possible pullback.
- Next week's economic data releases are poised to significantly impact BRENT's direction.
Having tracked BRENT through various market cycles, I can say that $65.73 is a crucial level to watch. The 1-hour RSI, registering at 71.16, indicates that the asset is approaching overbought territory. This, coupled with the Stochastic oscillator at K=90.49 and D=81.87, further reinforces the possibility of a short-term pullback. However, the broader trend remains bullish, underpinned by strong positive momentum as indicated by the MACD.
Analyzing Last Week's Key Events and Developments
Last week was marked by heightened volatility in the energy markets, driven by a confluence of factors. According to PriceONN market news, Brent Oil Price topped $71 due to fears of a U.S.-Iran conflict, this geopolitical tension acted as a significant catalyst, propelling prices upwards. This surge underscores the sensitivity of oil prices to geopolitical instability, a theme that has played out repeatedly over the years.
The U.S. Energy Information Administration (EIA) also released its weekly petroleum status report, which revealed a decrease in crude oil inventories. This decrease, coupled with increased demand, contributed to the upward pressure on prices. Additionally, OPEC+ compliance with production cuts remained high, further tightening supply and supporting the bullish narrative.
It's important to note that these factors don't operate in isolation. The strength of the U.S. dollar, as reflected in the DXY, also plays a role. With the DXY currently at 97.44, any further strengthening could exert downward pressure on BRENT. However, the prevailing sentiment remains bullish, driven by the aforementioned supply-demand dynamics and geopolitical risks.
Technical Levels and Price Action: A Weekly Review
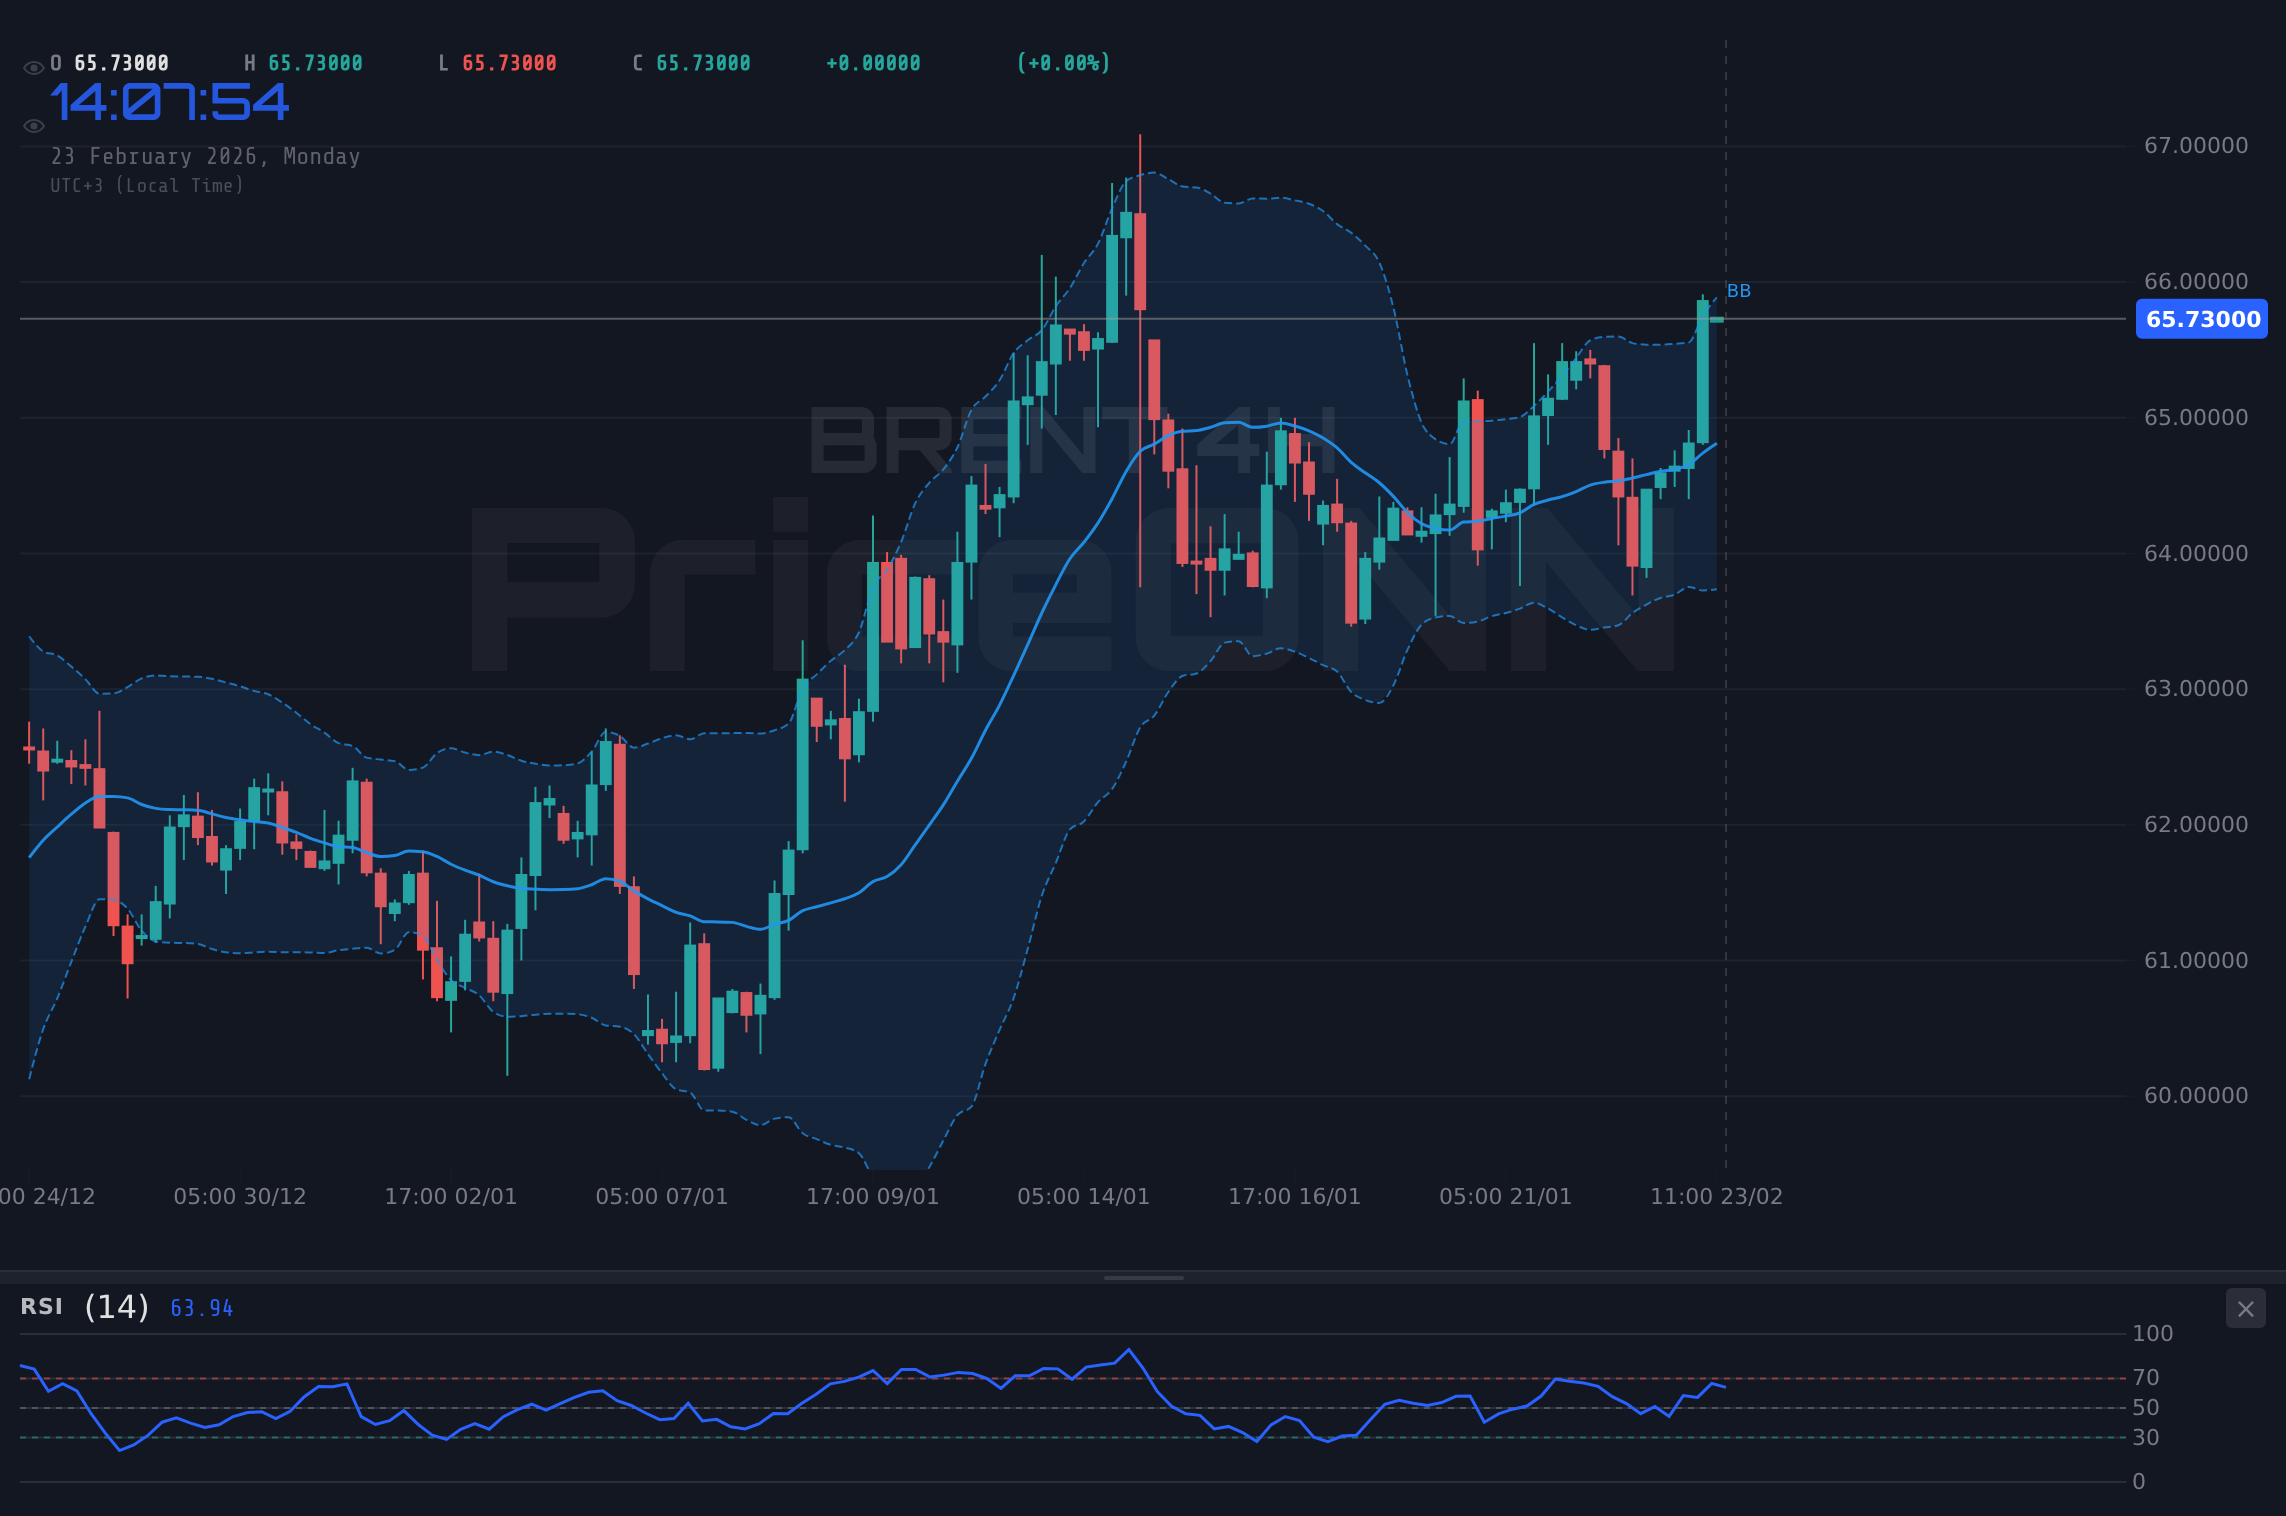
A review of the weekly price action reveals that BRENT successfully breached the resistance level at $65.42, as indicated in the 1D timeframe data. This breakout, supported by a rising ADX of 28.64, signals a strong continuation of the upward trend. However, the daily Stochastic oscillator, with K=54.52 and D=58.52, suggests that the momentum may be waning, warranting caution.
On the downside, immediate support lies at $65.20, followed by $65.10 and $64.99, as indicated by the 1H timeframe data. These levels represent potential areas of buying interest, where bulls are likely to step in and defend the upward trend. A break below these levels could signal a trend reversal, opening the door for further downside.
Conversely, on the upside, immediate resistance is observed at $65.41, $65.52 and $65.62, according to the 1H timeframe data. A sustained break above these levels could pave the way for a test of higher targets, potentially reaching $66.36 and $67.23, as indicated in the 1D timeframe data. However, the overbought conditions, as indicated by the RSI and Stochastic oscillators, suggest that a period of consolidation or pullback is likely before any further significant upside.
Deeper Dive: Key Technical Indicators and Their Implications
Let's take a closer look at some of the key technical indicators and their implications for BRENT's price action. The Relative Strength Index (RSI) is a momentum oscillator that measures the magnitude of recent price changes to evaluate overbought or oversold conditions. As mentioned earlier, the 1-hour RSI is currently at 71.16, indicating overbought conditions. Historically, when the RSI reaches these levels, a pullback often follows.
The Moving Average Convergence Divergence (MACD) is a trend-following momentum indicator that shows the relationship between two moving averages of prices. Currently, the MACD histogram is positive, suggesting that the bullish momentum remains intact. However, it's important to monitor the MACD for any signs of divergence, which could signal a potential trend reversal.
The Average Directional Index (ADX) is a trend strength indicator that measures the strength of a trend, regardless of its direction. With the 1H ADX currently at 19.03, the trend is relatively weak, suggesting that the price action is choppy and range-bound. However, the 1D ADX at 28.64 signals a strong uptrend, indicating that the broader trend remains bullish.
Bollinger Bands are volatility bands placed above and below a moving average. These bands widen and narrow as volatility increases and decreases, respectively. Currently, BRENT's price is trading above the upper Bollinger Band, indicating that the asset is overbought and a pullback is likely. However, a sustained break above the upper band could signal a strong continuation of the uptrend.
Next Week's Expectations: Economic Events and Levels to Watch
Looking ahead to next week, several key economic data releases are poised to impact BRENT's price action. The data includes, but isn't limited to, updates on inventories and potential production changes. The market is keenly awaiting these figures, as they will provide further insight into the supply-demand balance.
From a technical perspective, the key levels to watch are the support at $65.20 and the resistance at $65.41. A sustained break above the resistance could pave the way for a test of higher targets, while a break below the support could signal a trend reversal. Traders should also monitor the RSI, MACD, and ADX for any signs of divergence or trend exhaustion.
Furthermore, any escalation of geopolitical tensions in the Middle East could provide a further boost to prices. Conversely, any easing of tensions could lead to a pullback. Therefore, it's crucial to stay abreast of the latest news and developments in the region.
Correlation Analysis: BRENT, DXY, and Equity Markets
It's also important to consider the correlation between BRENT, the DXY, and equity markets. Historically, there has been an inverse relationship between BRENT and the DXY. A stronger dollar tends to exert downward pressure on oil prices, while a weaker dollar tends to support them. As mentioned earlier, the DXY is currently trading at 97.44. Any further strengthening could weigh on BRENT, while any weakening could provide a boost.
Equity markets also play a role, as they reflect the overall risk appetite in the market. A risk-on environment tends to support oil prices, while a risk-off environment tends to weigh on them. Therefore, traders should monitor the performance of major equity indices, such as the S&P 500 and the Nasdaq, for any clues about the prevailing market sentiment. The Nasdaq100 is currently trading at 24996.74, showing a 0.94% daily change.
In the context of the current market environment, it's reasonable to expect BRENT to remain range-bound in the short term, fluctuating between the support at $65.20 and the resistance at $65.41. A breakout above or below these levels would likely trigger a significant move in either direction. Traders should therefore be prepared to react accordingly.
Geopolitical Factors and Fundamental Drivers
The geopolitical landscape remains a critical factor influencing BRENT's price. Tensions in the Middle East, particularly involving Iran, have a direct impact on supply routes and overall stability in the region. According to Reuters, the market is highly sensitive to any news suggesting potential disruptions to oil production or transportation.
On the fundamental front, the balance between supply and demand continues to be a key driver. OPEC+ production cuts have helped to tighten supply, while increased demand from emerging economies has provided further support. However, concerns about a potential global economic slowdown could weigh on demand, offsetting the positive impact of supply cuts.
Additionally, the U.S. shale oil production continues to be a significant factor. The ability of U.S. producers to ramp up production quickly in response to higher prices could limit the upside potential for BRENT. Traders should therefore monitor the U.S. rig count and production data for any clues about the future trajectory of U.S. shale oil production.
Trading Strategies: What Different Trader Types Should Watch
Different types of traders will approach BRENT with different strategies. Scalpers, who aim to profit from small price movements, will focus on the 1-hour chart and monitor the support and resistance levels at $65.20 and $65.41, respectively. They will also pay close attention to the RSI, MACD, and Stochastic oscillators for any signs of short-term trading opportunities.
Swing traders, who aim to profit from larger price swings, will focus on the 4-hour and daily charts. They will monitor the trend strength, as indicated by the ADX, and look for breakouts above or below the key support and resistance levels. They will also pay attention to the broader market context, including the DXY and equity markets.
Long-term investors, who aim to profit from the long-term trend, will focus on the weekly and monthly charts. They will monitor the fundamental drivers, such as supply-demand dynamics and geopolitical risks, and look for opportunities to accumulate BRENT at attractive prices. They will also pay attention to the long-term trend, as indicated by the moving averages and trendlines.
Frequently Asked Questions: BRENT Analysis
Is BRENT a good buy right now?
Currently, with BRENT closing last Friday at $65.73, the overbought RSI suggests caution for immediate buying. However, a pullback to the $65.20 support level could present a favorable entry point for a potential long position, contingent on positive signals from next week's data.
What is the BRENT price forecast for this week?
The BRENT price forecast for this week hinges on upcoming economic data; a bullish scenario could see prices testing $66.36, while a bearish scenario might lead to a retest of $65.20. The probability of either outcome is largely dependent on the strength and direction of the data releases.
What are the key support and resistance levels for BRENT?
Key support levels for BRENT are $65.20, $65.10 and $64.99, providing potential buying opportunities, while resistance levels are $65.41, $65.52 and $65.62. A break of these levels would likely dictate the short-term direction of BRENT's price.
Why is BRENT moving today?
BRENT's recent movements are primarily driven by a combination of geopolitical tensions and supply-demand dynamics. Specifically, fears of a U.S.-Iran conflict, coupled with OPEC+ production cuts, have contributed to the recent upward pressure on prices, but the DXY is pushing back.
BRENT is currently in a bullish trend, but the overbought conditions and upcoming economic data releases warrant caution. Traders should monitor the key support and resistance levels, as well as the RSI, MACD, and ADX, for any signs of divergence or trend exhaustion. With disciplined risk management, these choppy waters can be navigated safely.
Track markets in real-time
AI-powered analysis, technical indicators and real-time price data.
Join Our Telegram Channel
Breaking market news, AI analysis and trading signals instantly.
Join Channel