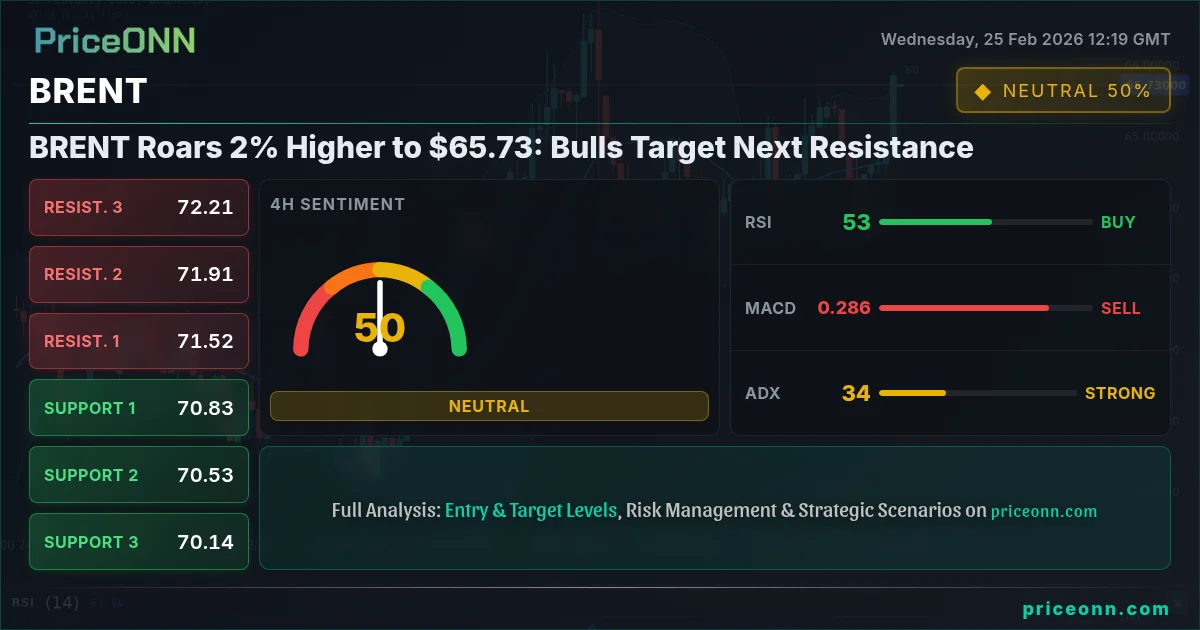
BRENT Roars 2% Higher to $65.73: Bulls Target Next Resistance
BRENT crude surges 2% to $65.73 amid renewed optimism. Will bulls sustain momentum ahead of key economic data?
BRENT crude oil finds itself at a pivotal juncture, with bulls and bears locked in a fierce battle around the $65.73 level. The recent surge, pushing prices up by 2%, has ignited speculation about the next directional move. This analysis delves into the arguments supporting both sides of the trade, examining technical indicators and fundamental drivers to determine the most likely outcome.
- BRENT crude surged to $65.73, marking a 2% increase, fueled by bullish sentiment.
- Key support lies at $65.20, representing a critical level for maintaining the upward trajectory.
- Resistance is observed at $66.20, a potential target for bulls if momentum persists.
- Market sentiment is mixed, with the RSI at 71.16 suggesting overbought conditions in the 1H timeframe, requiring careful monitoring.
The Bull Case: Momentum and Breakout Potential
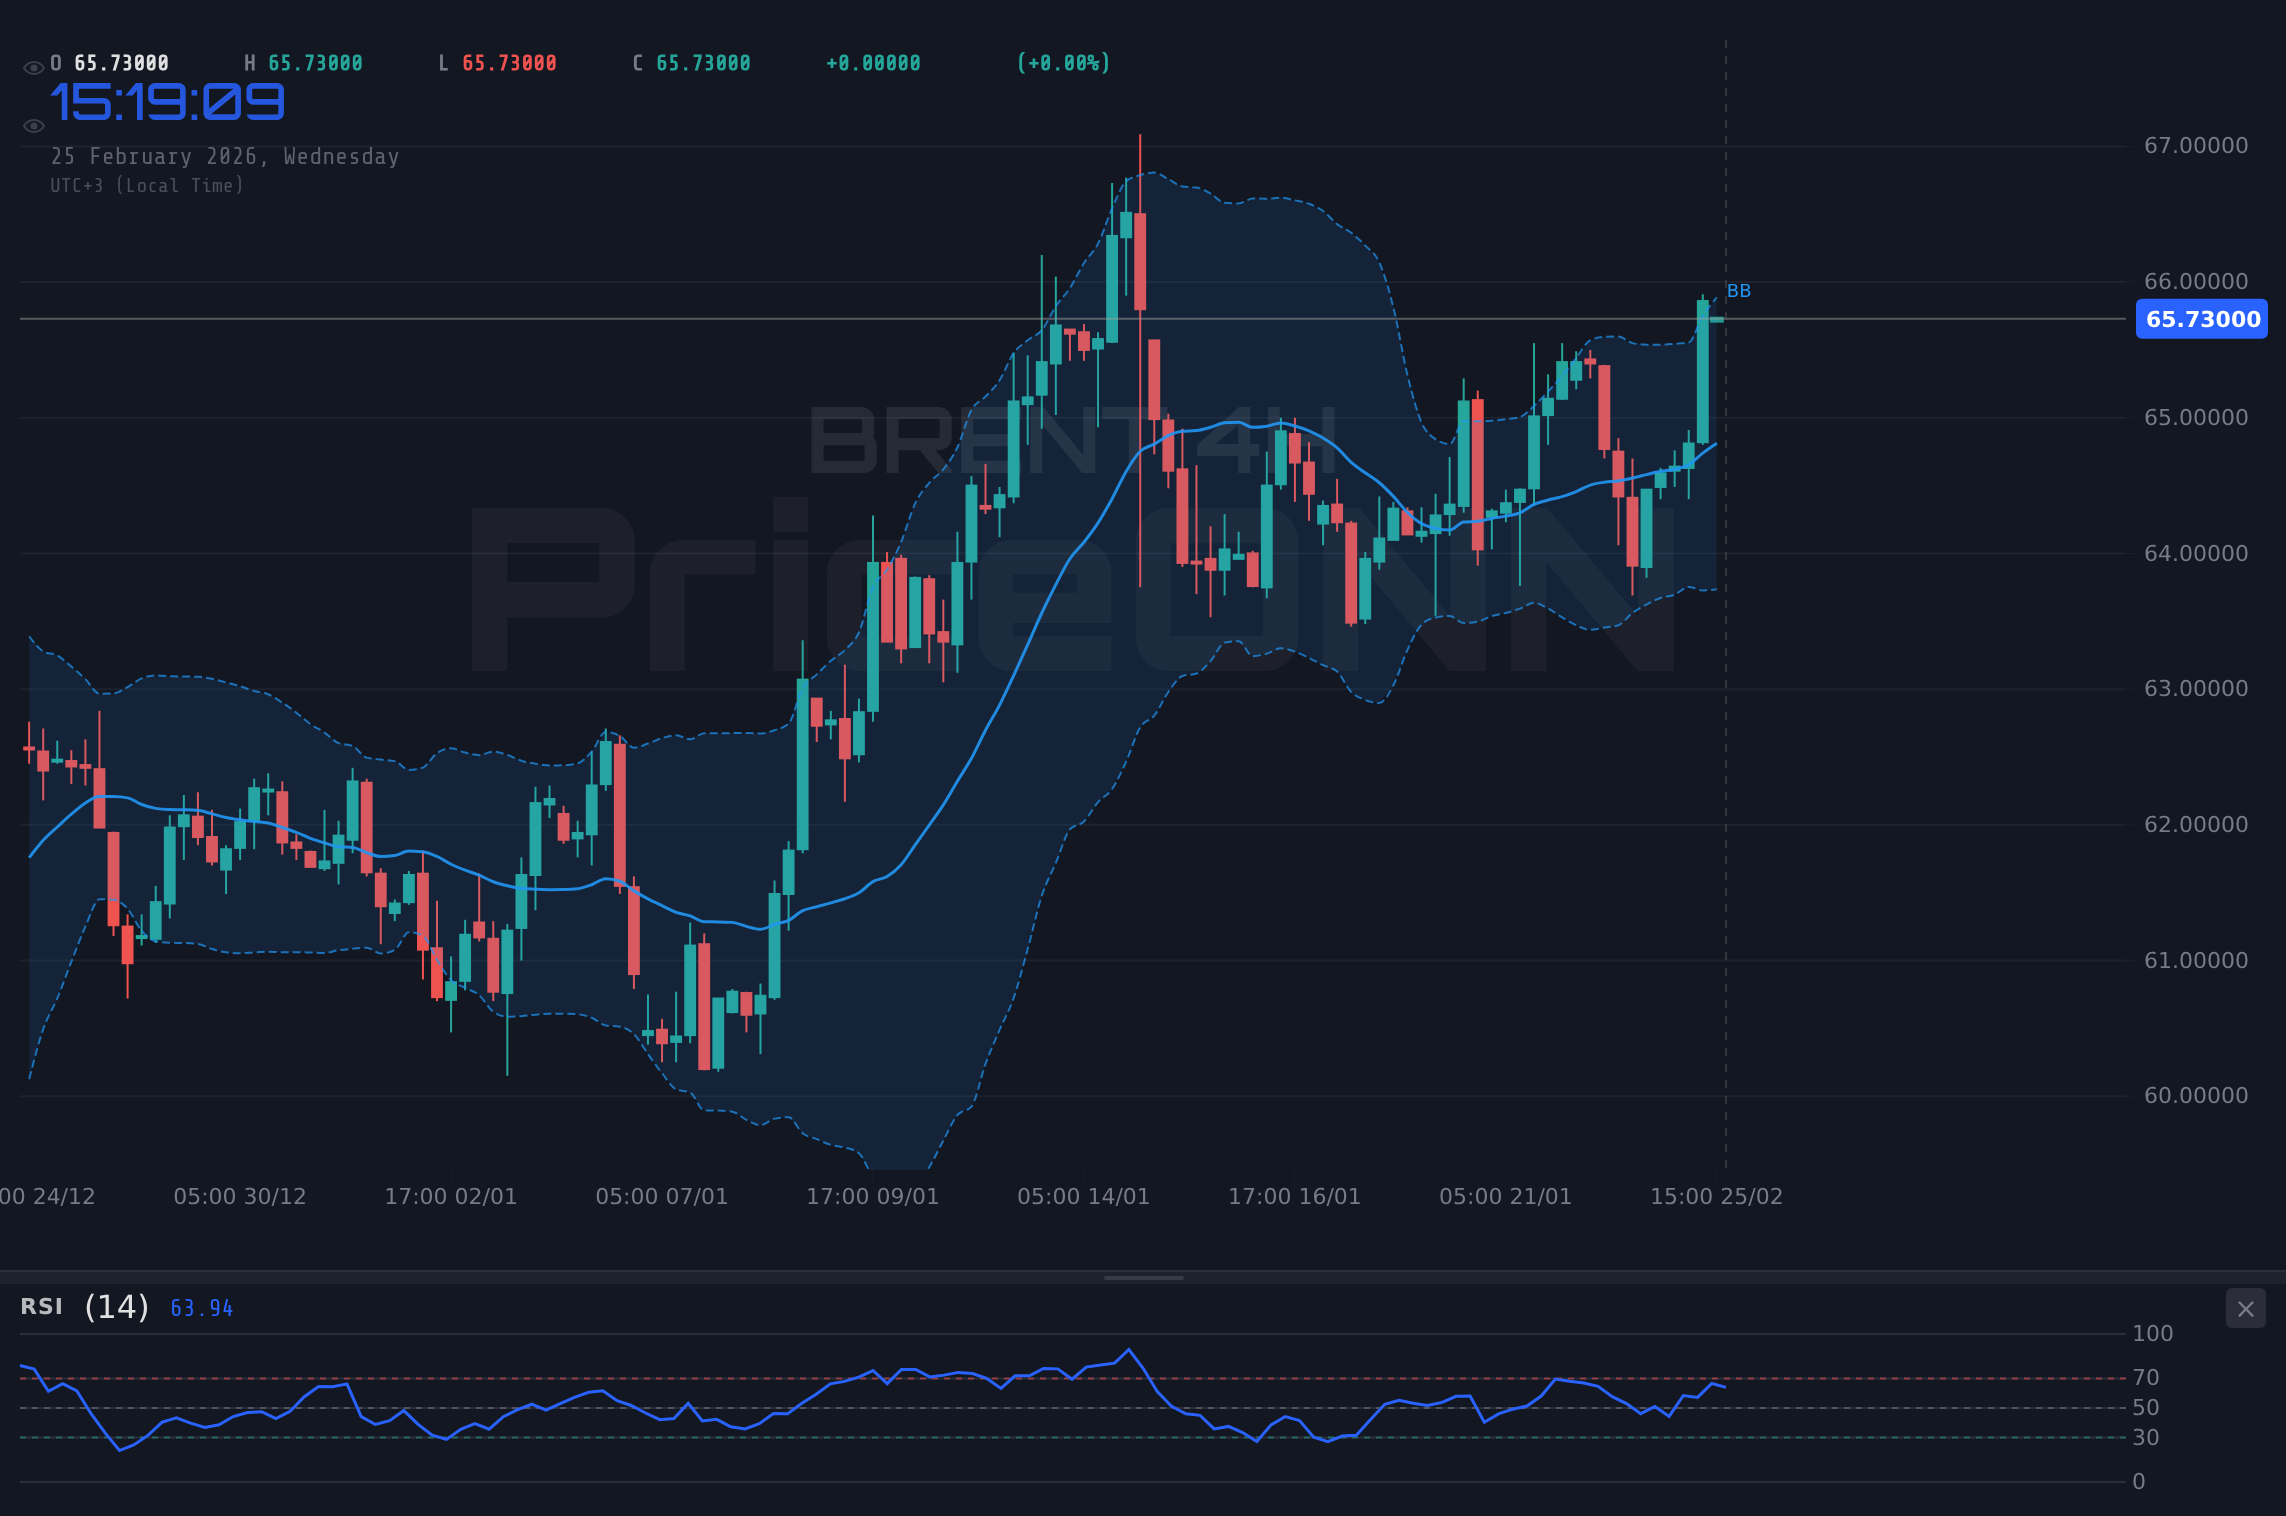
The bullish narrative for BRENT is anchored in the recent breakout above key resistance levels, signaling renewed buying interest. The 1-hour chart shows a strong uptrend, with the price currently hovering around $65.73. The momentum indicators support this view, with the MACD histogram showing positive momentum, indicating that buyers are in control. Furthermore, the Bollinger bands suggest that the price is testing the upper band, potentially leading to a breakout if the bullish pressure persists. Key support for the bullish case lies at $65.20, a level that must hold to sustain the upward momentum. A break above the $66.20 resistance could open the door for further gains, targeting $67.06 in the short term. The overall signal on the 1H timeframe is AL, reinforcing the bullish sentiment, though the RSI at 71.16 suggests caution due to overbought conditions.
The daily chart also provides support for the bullish scenario. The trend is upward, and the price is trading above the middle Bollinger band. The stochastic oscillator, while showing a sell signal with K at 54.52 and D at 58.52, needs to be carefully monitored. The ADX is at 28.64, which shows a strong bullish trend in the 1D timeframe. The overall signal on the 1D timeframe is AL, reinforcing the potential for further gains.
The Bear Case: Overbought Conditions and Weakening Trend
Conversely, the bearish argument rests on the premise that BRENT is currently overbought and due for a correction. The RSI on the 1-hour chart is at 71.16, signaling that the asset may be overvalued in the short term. This could trigger profit-taking, leading to a pullback towards lower support levels. The ADX, although showing a strong trend on the 1D timeframe, is only at 19.03 on the 1H timeframe, suggesting a weak trend and potential for a reversal. The stochastic oscillator on the 1H timeframe gives a sell signal with K at 90.49 and D at 81.87, reinforcing the bearish sentiment. The key resistance level for the bearish case is $66.20, a level that, if not broken, could lead to a decline towards $65.20 and potentially $64.50. The DXY is currently at 97.6, and its increase could put further pressure on BRENT.
Moreover, the 4-hour chart presents a mixed picture. While the MACD shows positive momentum, the stochastic oscillator gives a buy signal with K at 68.29 and D at 44.75. The overall signal on the 4H timeframe is AL, but the conflicting signals warrant caution. The RSI is at 62.33, indicating neutral conditions and further reinforcing the uncertainty.
Technicals as the Tiebreaker: A Multi-Timeframe Analysis
To reconcile the conflicting signals and determine the most likely direction for BRENT, a multi-timeframe analysis is essential. While the 1-hour chart shows overbought conditions and a potential for a pullback, the daily chart paints a more bullish picture. Therefore, the short-term outlook may be bearish, while the medium-term outlook remains bullish. The 1H timeframe shows that the price is trading above the middle Bollinger band, which indicates a bullish trend. However, the RSI is at 71.16, which indicates overbought conditions. The ADX is at 19.03, which indicates a weak trend. The stochastic oscillator gives a sell signal with K at 90.49 and D at 81.87. The overall signal is AL.
The 4H timeframe shows that the price is trading above the middle Bollinger band, which indicates a bullish trend. The RSI is at 62.33, which indicates neutral conditions. The ADX is at 13.59, which indicates a weak trend. The stochastic oscillator gives a buy signal with K at 68.29 and D at 44.75. The overall signal is AL.
The 1D timeframe shows that the price is trading above the middle Bollinger band, which indicates a bullish trend. The RSI is at 59.99, which indicates neutral conditions. The ADX is at 28.64, which indicates a strong trend. The stochastic oscillator gives a sell signal with K at 54.52 and D at 58.52. The overall signal is AL.
Economic Calendar and Market Drivers
The economic calendar reveals several key events that could influence BRENT prices in the coming days. The expected USD data, with a forecast of 1.8 compared to the previous -9.014, will be in focus. Additionally, the USD data forecast of 217 compared to the previous 206, and the EUR data forecast of 0.3 compared to the previous 0, could influence the market sentiment. These data releases could trigger volatility in the currency markets, impacting BRENT prices through its correlation with the dollar. According to Reuters, the market is pricing in a higher probability of a rate hike in the coming months, which could further strengthen the dollar and weigh on BRENT.
Geopolitical risks also play a crucial role in shaping BRENT prices. Tensions in the Middle East and supply disruptions could lead to a surge in prices, while easing tensions could have the opposite effect. Investors should closely monitor these developments and adjust their positions accordingly. Bloomberg data indicates that global oil demand is expected to increase by 1.5 million barrels per day in 2026, providing a long-term tailwind for BRENT prices. The current price of WTI is at $66.15, which is higher than BRENT at $65.73. The current price of BTCUSD is at $65489, and ETHUSD is at $1926.72. These assets could all be influenced by the economic calendar.
Key Levels
Support Levels
Resistance Levels
Technical Outlook Summary
| Indicator | Value | Signal |
|---|---|---|
| RSI (14) | 71.16 | Overbought |
| MACD Histogram | Positive | Bullish |
| Stochastic | K=90.49, D=81.87 | Overbought |
| ADX | 19.03 | Weak Trend |
| Bollinger | Upper Band | Watch |
Frequently Asked Questions: BRENT Analysis
Is BRENT a good buy right now?
BRENT is showing mixed signals. The 1H RSI at 71.16 suggests overbought conditions, while the MACD indicates positive momentum. A cautious approach is warranted, awaiting confirmation of a breakout or pullback before initiating a position.
What is the BRENT price forecast for this week?
The BRENT price forecast for this week depends on breaking resistance at $66.20. If this level is breached, a target of $67.06 is possible. Failure to break resistance could lead to a decline towards $65.20.
What are the key support and resistance levels for BRENT?
Key support for BRENT lies at $65.20, while resistance is found at $66.20. These levels represent critical areas for potential reversals or breakouts, influencing short-term trading strategies.
Why is BRENT moving today?
BRENT is moving today due to a combination of factors, including positive momentum and testing of upper Bollinger band on the 1H timeframe. Additionally, USD data release could have influenced the market sentiment.
Track markets in real-time
AI-powered analysis, technical indicators and real-time price data.
Join Our Telegram Channel
Breaking market news, AI analysis and trading signals instantly.
Join Channel