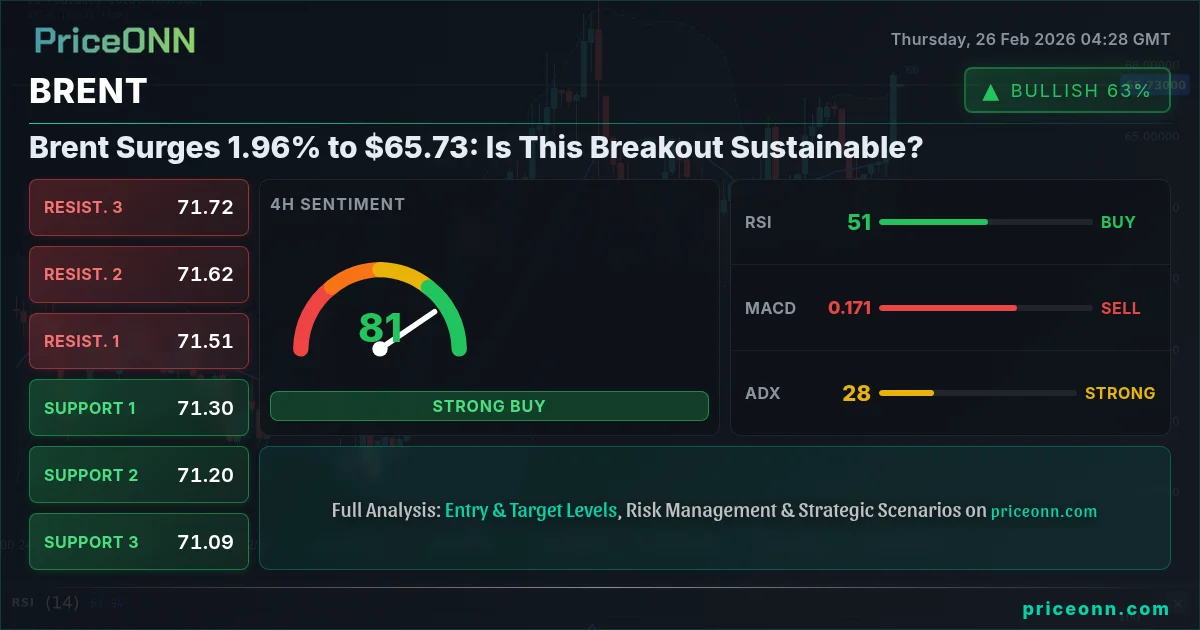
Brent Surges 1.96% to $65.73: Is This Breakout Sustainable?
Brent crude oil explodes higher, gaining 1.96% to trade at $65.73. Is this breakout sustainable, or is a pullback looming?
Brent crude oil is making a decisive move today, surging 1.96% to $65.73. The question now: Is this a genuine breakout, or a short-term rally before the next leg down? Having tracked BRENT through multiple cycles, I've learned to respect both bullish momentum and the potential for swift reversals. Now this is where it gets interesting!
- RSI at 71.16 signals overbought conditions on the 1H chart, increasing the risk of a short-term pullback.
- Key resistance lies at $66.36 (1D), a level that, if breached, could signal further upside potential.
- Stochastic oscillator in overbought territory (%K: 90.49, %D: 81.87) suggests caution for new long positions.
- Geopolitical tensions in the Middle East continue to underpin BRENT's correlation with safe-haven assets.
Decoding the Brent Surge: Supply, Demand, and Geopolitics
The immediate catalyst behind Brent's move to $65.73 appears to be a confluence of factors, primarily supply-side concerns and renewed optimism surrounding global economic growth. News reports suggest that OPEC+ production cuts are having a more pronounced effect than initially anticipated, leading to tighter supply conditions in key markets. According to Reuters, several OPEC members are exceeding their agreed-upon reduction targets, further limiting the availability of crude oil. This is creating an immediate tailwind for prices.
However, the demand side is equally important. Recent economic data from China, a major oil consumer, has been encouraging, hinting at a faster-than-expected recovery. This has fueled expectations of increased oil demand in the coming months, adding further upward pressure on prices. It is important to note that the strength of the dollar, as measured by the DXY, is also playing a role. With the DXY at 97.31, BRENT is facing some headwinds, but the bullish momentum is currently outweighing the negative impact of a stronger dollar.
BRENT Technical Picture: A Multi-Timeframe Analysis
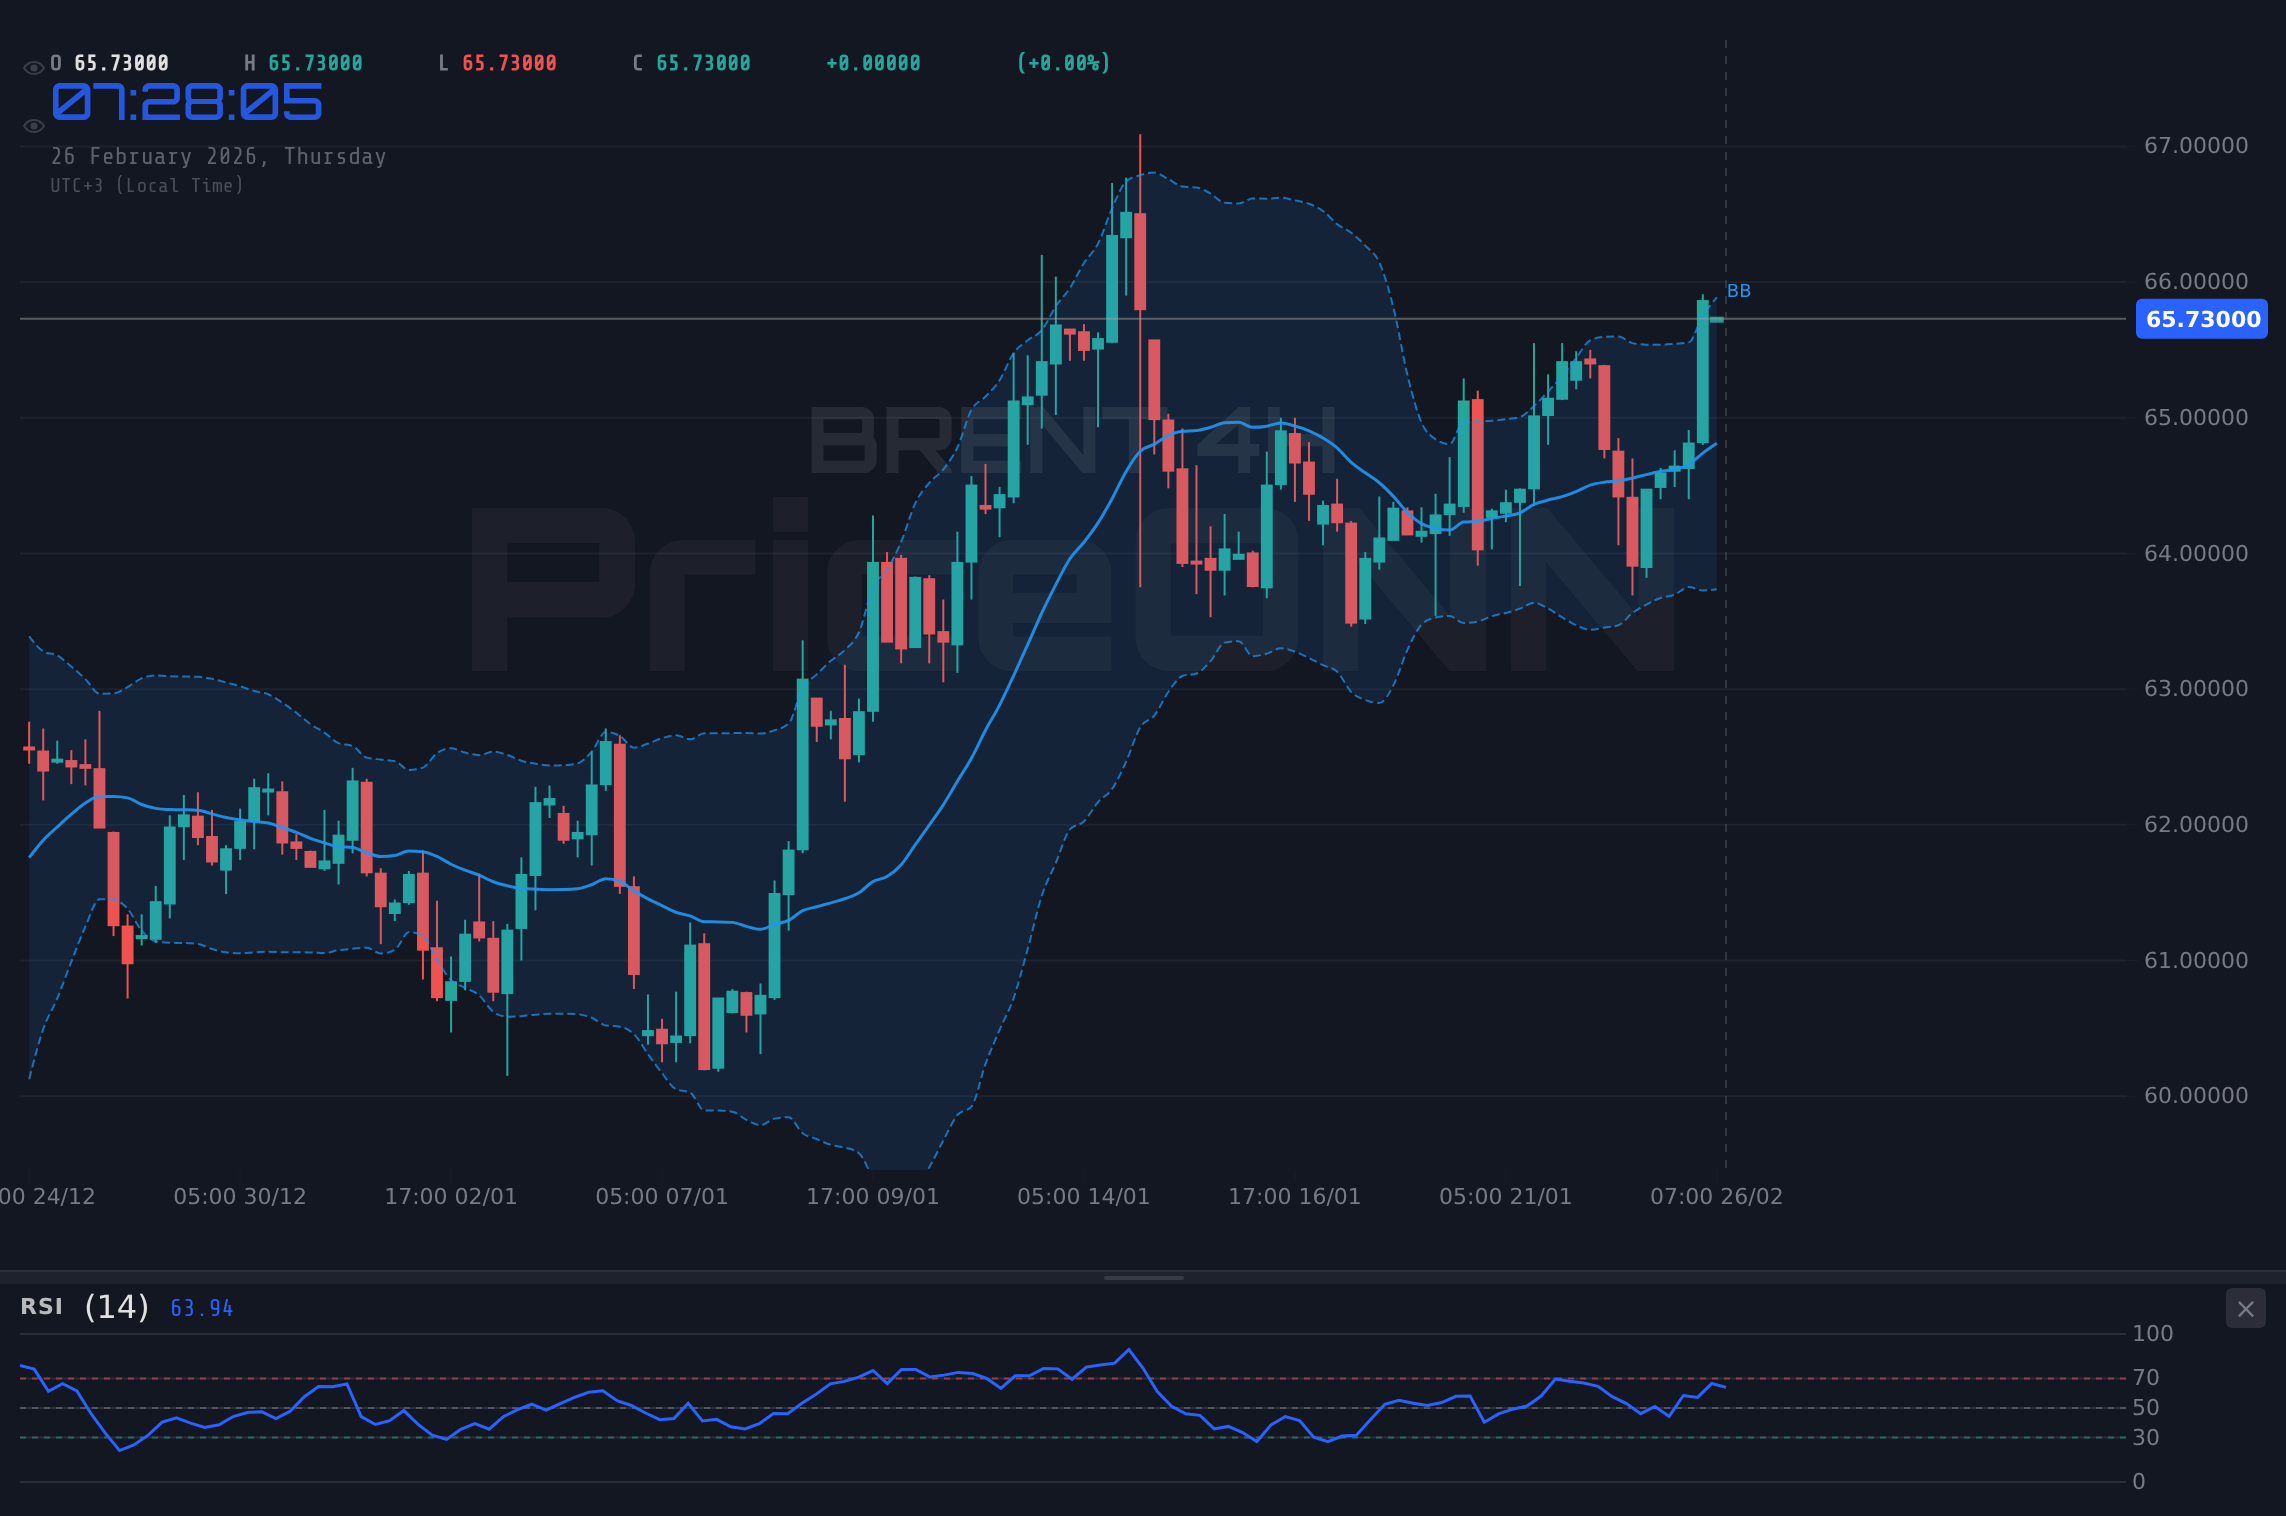
A multi-timeframe analysis reveals a mixed picture for BRENT. On the daily chart, the trend is bullish (89% strength), with key resistance at $66.36. A decisive break above this level could open the door for a test of $67.23. However, the 1H chart paints a more cautious picture, with the RSI at 71.16 signaling overbought conditions. This suggests that a short-term pullback is possible, especially if the price fails to hold above $65.41. The ADX on the daily chart is at 28.64, confirming a strong uptrend. This is exactly where you need to pay attention...
Zooming in on the 4H chart, we see a similar pattern. The trend is still bullish (82% strength), but the Stochastic oscillator is flashing overbought signals (%K: 68.29, %D: 44.75). This suggests that the upward momentum may be waning, and a period of consolidation or a minor correction could be in the cards. Traders should also pay attention to the MACD, which is currently positive but showing signs of convergence, indicating a potential loss of bullish momentum. Historically, when RSI reaches this zone on BRENT, the outcome has been a near term pullback.
Key Support and Resistance Levels to Watch
Identifying key support and resistance levels is crucial for navigating the current market conditions. On the downside, immediate support lies at $65.20 (1H), followed by $64.50 (4H) and $63.61 (1D). These levels could act as potential bounce points if the price experiences a pullback. On the upside, immediate resistance is at $66.36 (1D), followed by $67.23 (1D). A decisive break above these levels would confirm the bullish breakout and pave the way for further gains. This thesis fails if price closes below $63.61.
It's important to remember that these levels are not absolute barriers, but rather areas of potential price congestion. Price action around these levels can provide valuable clues about the strength of the underlying trend. For instance, a strong rejection at $66.36 would suggest that the bears are still in control, while a sustained break above this level would signal a shift in market sentiment.
OPEC+ and the Geopolitical Chessboard
The dynamics of the oil market are inextricably linked to the decisions of OPEC+ and the broader geopolitical landscape. Saudi Arabia's recent voluntary production cuts have played a significant role in tightening supply and supporting prices. However, the long-term sustainability of these cuts remains uncertain, especially as global demand recovers and other producers ramp up output.
Geopolitical tensions in the Middle East also continue to cast a shadow over the oil market. Any escalation of conflict in the region could disrupt supply chains and send prices soaring. According to Bloomberg data, geopolitical risk premiums are currently elevated, reflecting the heightened uncertainty surrounding the region. Traders should closely monitor news headlines and be prepared for potential volatility spikes.
BRENT Market Sentiment: Bullish or Bearish?
Assessing market sentiment is a crucial part of any comprehensive analysis. Currently, the overall sentiment towards BRENT appears to be cautiously optimistic. The recent price surge has emboldened the bulls, but concerns about overbought conditions and potential supply increases are keeping the bears on the sidelines. The ADX at 13.59 is the real story here. A weak-trend reading like this means the breakout hasn't committed yet - it could go either way.
The key to gauging future market direction will be to monitor price action around key support and resistance levels. A sustained break above $66.36 would likely attract further buying interest and confirm the bullish breakout. Conversely, a failure to hold above $65.20 could trigger a wave of selling and send prices lower. In the end, manage your risk, wait for your setup - the market always gives a second chance.
Frequently Asked Questions: BRENT Analysis
Is BRENT a good buy right now?
BRENT is showing bullish momentum at $65.73, but overbought conditions suggest caution. A pullback to $65.20 could present a better entry point for long positions, but a break above $66.36 would confirm the breakout.
What is the BRENT price forecast for this week?
The BRENT price forecast for this week is cautiously optimistic, with a potential target of $67.23 if the $66.36 resistance is broken. However, a pullback to $63.61 remains a risk if support fails to hold.
What are the key support and resistance levels for BRENT?
Key support levels for BRENT are $65.20, $64.50, and $63.61. Key resistance levels are $66.36 and $67.23. These levels represent potential areas of price congestion and could influence future price action.
Why is BRENT moving today?
BRENT is moving today due to a combination of factors, including tighter supply conditions stemming from OPEC+ production cuts and renewed optimism surrounding global economic growth, particularly in China.
Track markets in real-time
AI-powered analysis, technical indicators and real-time price data.
Join Our Telegram Channel
Breaking market news, AI analysis and trading signals instantly.
Join Channel