BRENT Surges on Bullish Momentum: $65.73 in Sight?
BRENT oil is riding high on bullish momentum, currently trading at $65.73. Can it sustain this rally and break through resistance levels?
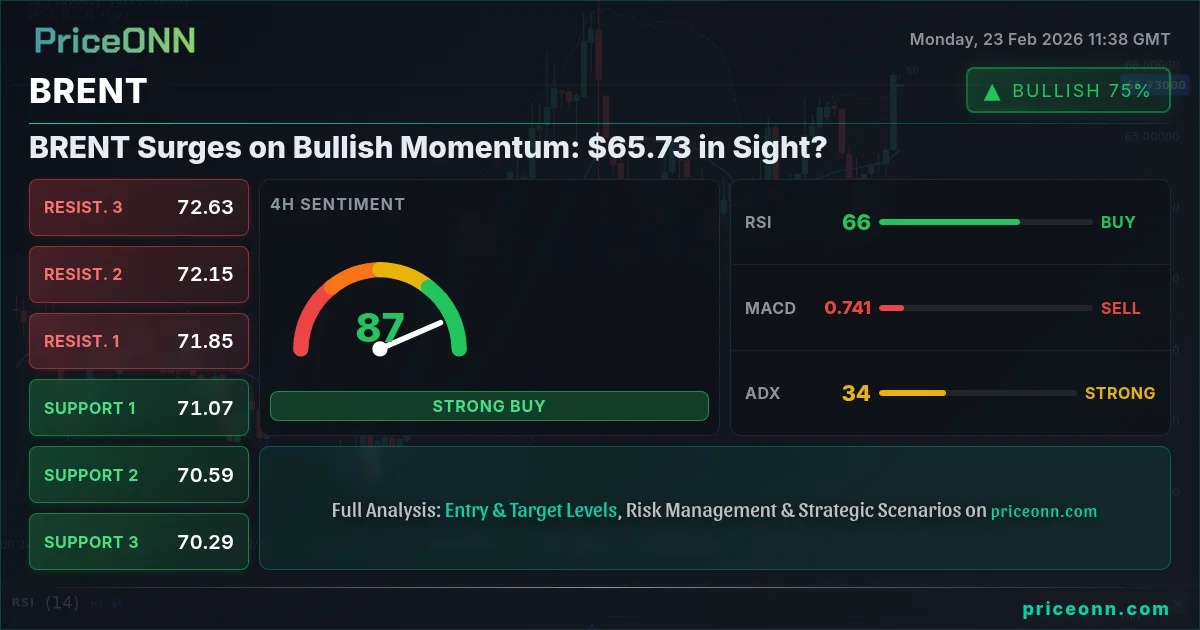
BRENT oil is currently trading at $65.73, fueled by bullish momentum that has traders eyeing the $66 mark. The question is whether this surge is sustainable, or if we're looking at a temporary spike before a correction.
- RSI at 71.16 signals overbought conditions, suggesting potential for a pullback.
- Key resistance lies at $65.42, a break above which could lead to further gains.
- ADX at a weak 19.03 indicates a lack of strong trend, making entry timing uncertain.
- DXY strength could put pressure on BRENT, correlated moves will be key.
BRENT's recent performance has been impressive, driven by a combination of factors that we'll delve into shortly. However, a closer look at the technical indicators reveals a mixed picture, demanding a cautious approach. Let's break down the key elements driving BRENT's price action and what traders should watch for.
On the hourly chart, the RSI sits at 71.16, pushing into overbought territory. This suggests that the current upward momentum may be losing steam, and a pullback could be on the horizon. However, overbought conditions don't automatically trigger a sell signal; they simply indicate that the asset is trading at the higher end of its recent range, and the bulls might be getting a little tired. The MACD, meanwhile, shows positive momentum, hinting at continued buying pressure. This divergence between RSI and MACD highlights the need for confirmation before making any trading decisions.
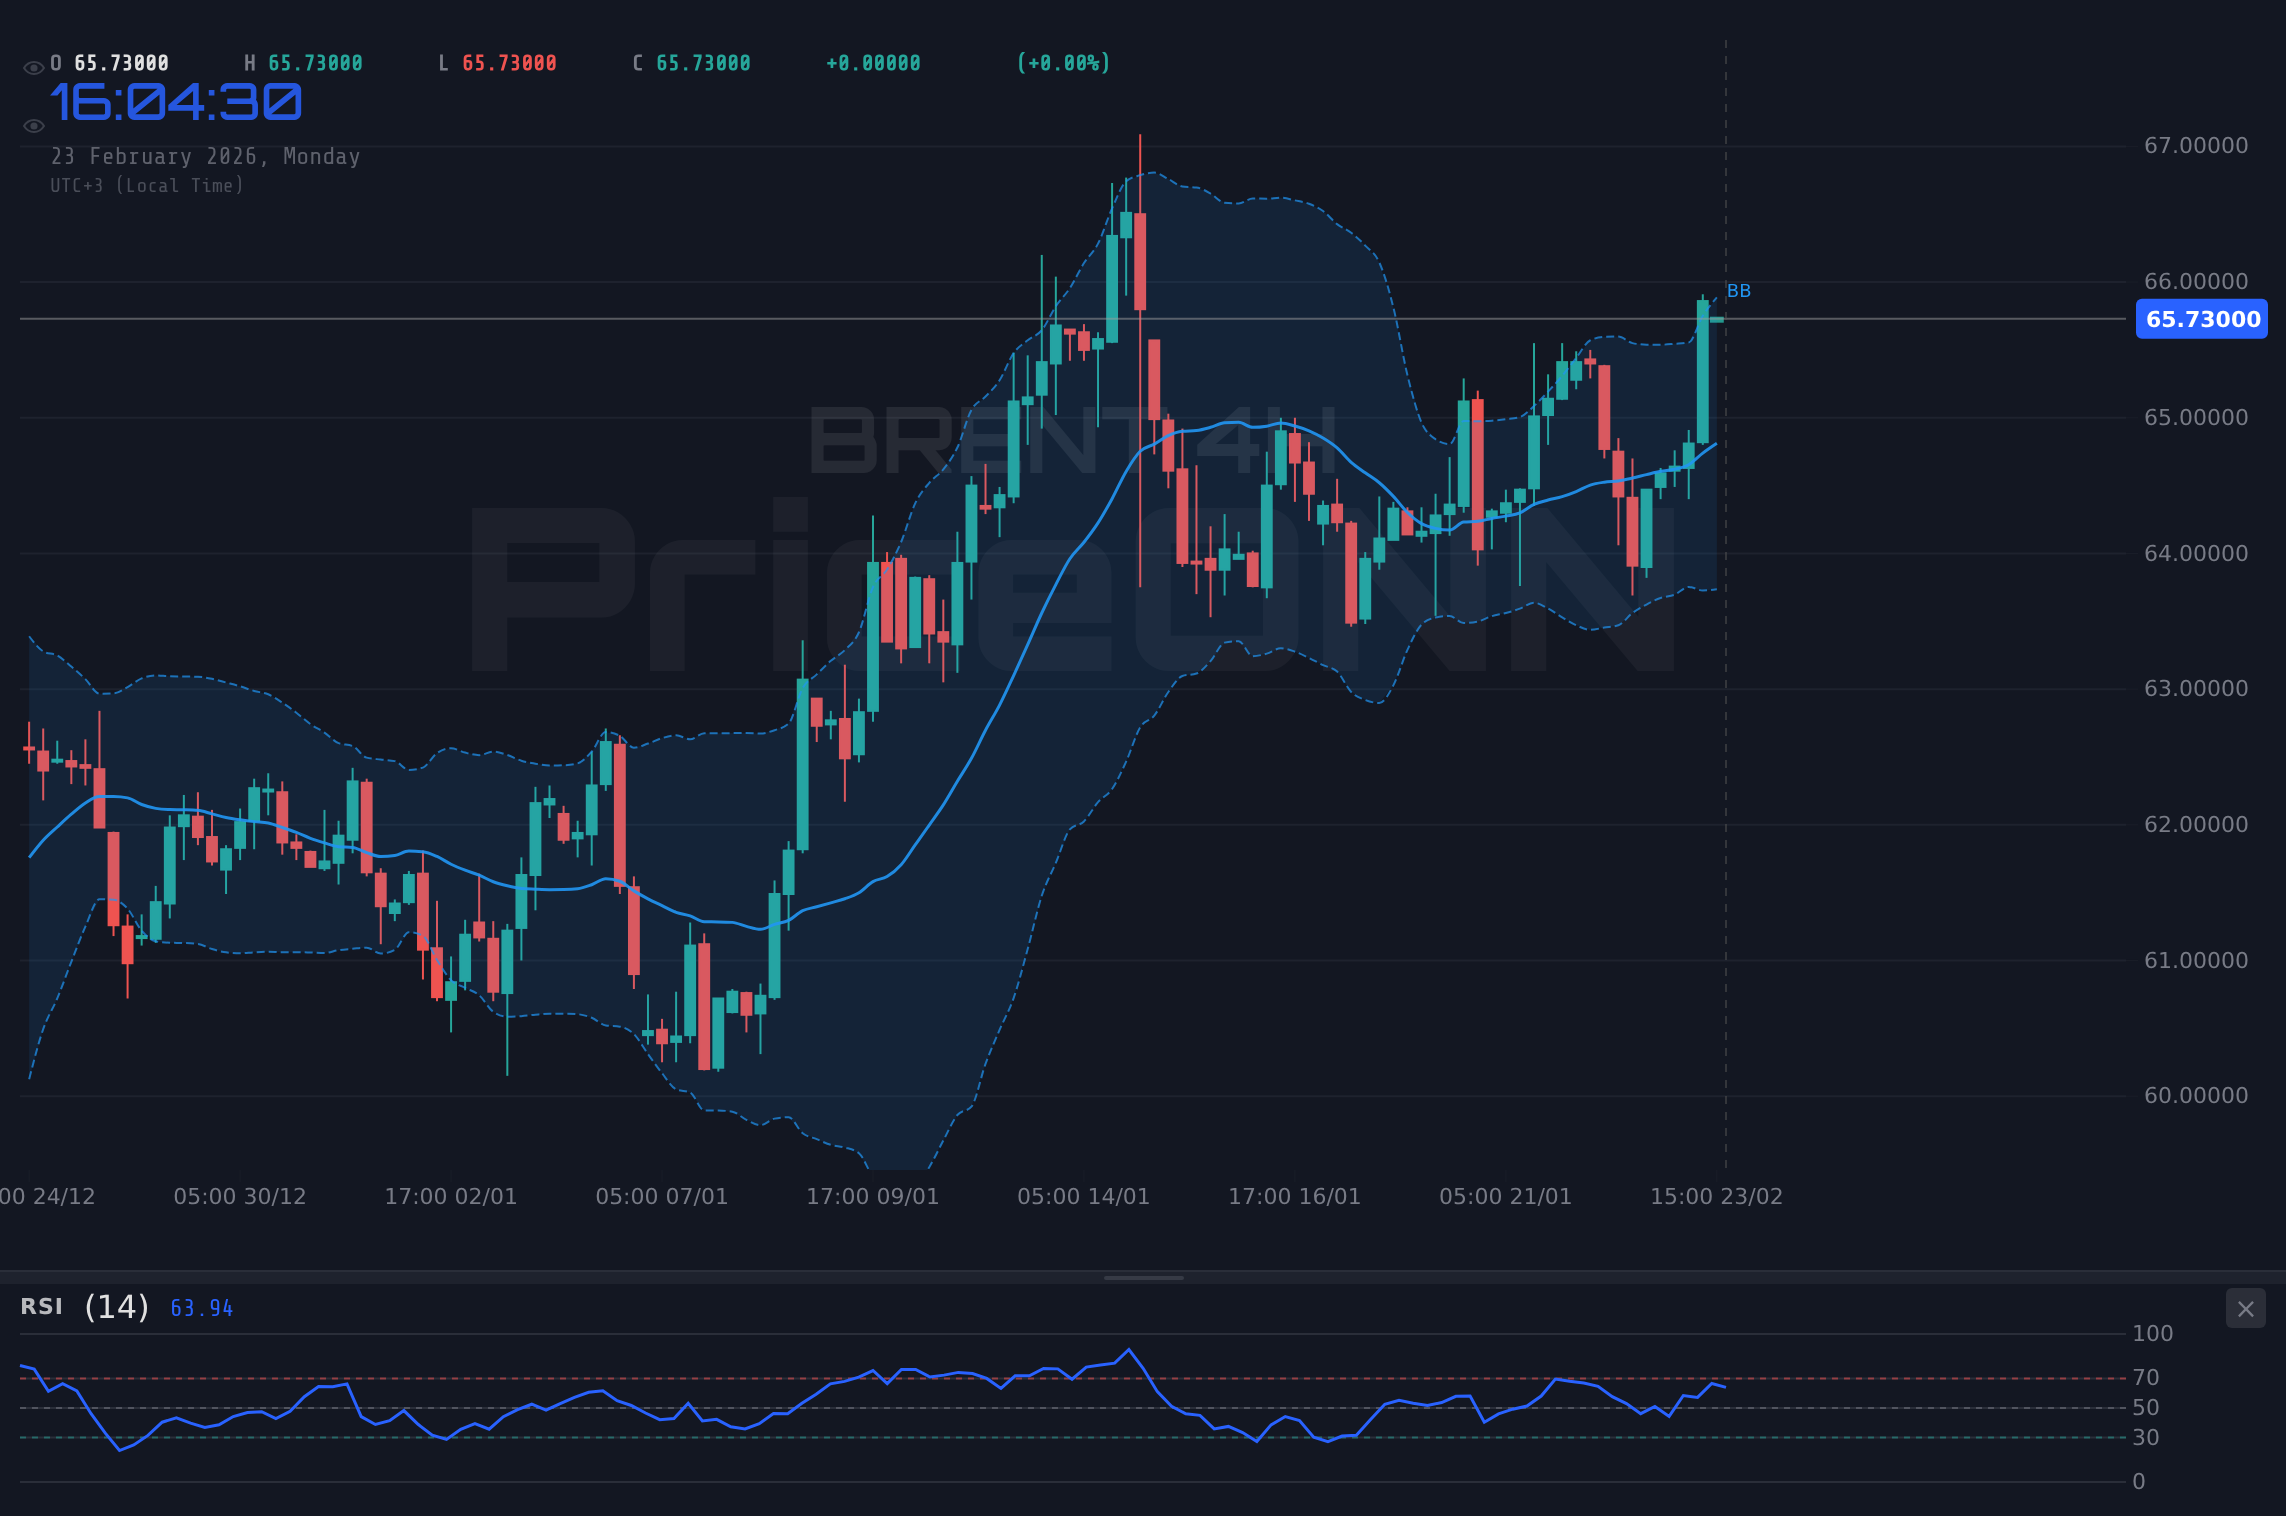
The Stochastic indicator, with K=90.49 and D=81.87, is also flashing overbought signals on the hourly timeframe. This adds further weight to the possibility of a short-term correction. However, the ADX, a measure of trend strength, is languishing at a weak 19.03, suggesting that the current uptrend lacks conviction. This lack of trend strength makes the overbought readings even more significant, as a weak trend is more susceptible to reversals.
Why $65.42 is the Line in the Sand
Key levels are always critical in technical analysis, and for BRENT, the immediate resistance to watch is $65.42, as shown in the daily timeframe data. A decisive break above this level could open the door for a test of higher resistance at $66.36. However, failure to overcome this resistance could signal a potential double top, leading to a pullback towards support levels. On the downside, immediate support lies at $65.20. A break below this level could trigger a deeper correction towards $65.10 and $64.99.
Traders should also pay close attention to the daily chart, where the RSI sits at 59.99, indicating neutral conditions. This suggests that there's still room for BRENT to move higher before reaching overbought territory on the daily timeframe. However, the MACD shows positive momentum, further supporting the bullish case. The Stochastic indicator, with K=54.52 and D=58.52, is signaling a potential downturn, adding to the mixed signals. The ADX at 28.64 indicates a strong uptrend on the daily chart.
Conflicting signals from technical indicators suggest caution is warranted. Traders should await confirmation before committing to a directional bias.
Geopolitical Tensions Fueling BRENT's Ascent
Beyond the technicals, geopolitical factors are playing a significant role in BRENT's price action. Ongoing tensions in the Middle East, coupled with concerns about supply disruptions, are providing underlying support to prices. According to Reuters, "geopolitical risks remain elevated, potentially impacting global oil supplies." These risks translate to a risk premium being factored into BRENT prices, bolstering its resilience even in the face of technical headwinds.
Furthermore, OPEC+ production cuts are continuing to tighten the supply side of the equation. While demand concerns linger due to the global economic slowdown, the supply-side constraints are proving to be a more dominant force in the short term. This dynamic is creating a tug-of-war between bullish and bearish factors, resulting in the choppy price action we're currently witnessing.
Monitor geopolitical news closely for any developments that could impact oil supply. This will provide valuable insights into potential price swings.
DXY Strength: A Headwind for BRENT?
The Dollar Index (DXY) is another key factor to watch. Currently at 97.46, a strengthening dollar can put downward pressure on BRENT, as oil is typically priced in USD. The DXY's strength is driven by expectations of further interest rate hikes by the Federal Reserve. As the dollar strengthens, it becomes more expensive for other countries to purchase oil, potentially dampening demand and weighing on prices. However, if risk sentiment declines, BRENT may decouple from this inverse relationship.
However, the relationship between BRENT and DXY is not always straightforward. At times, BRENT can rally even in the face of a strengthening dollar, particularly if there are significant supply disruptions or geopolitical events that outweigh the currency effect. Therefore, traders should avoid relying solely on the DXY as a predictor of BRENT's price action, and instead consider a broader range of factors.
Decoding the BRENT Market Sentiment
Market sentiment, often shaped by news headlines and analyst opinions, plays a crucial role in short-term price fluctuations. Currently, sentiment towards BRENT appears to be cautiously optimistic, with many analysts forecasting continued strength in the coming weeks. However, sentiment can shift rapidly, particularly in response to unexpected events. Bloomberg reported that "analysts are turning more bullish on oil as supply constraints bite."
Traders should be wary of relying solely on market sentiment, as it can often be a lagging indicator. By the time sentiment becomes overwhelmingly bullish or bearish, the price move may already be largely priced in. Instead, focus on identifying early signs of sentiment shifts by monitoring social media, news feeds, and analyst reports. This will allow you to anticipate potential price movements before they become widely recognized.
Different Trader Types, Different Strategies
The optimal strategy for trading BRENT depends largely on your time horizon and risk tolerance. Scalpers, who aim to profit from small price movements over short periods, may find opportunities in the intraday volatility. However, the choppy price action and conflicting signals from technical indicators make scalping particularly challenging at the moment. Swing traders, who hold positions for several days or weeks, may prefer to wait for a clearer trend to emerge before committing to a directional bias. Long-term investors, on the other hand, may view the current volatility as an opportunity to accumulate BRENT at attractive levels, betting on its long-term appreciation.
Regardless of your trading style, disciplined risk management is essential. Always use stop-loss orders to limit your potential losses, and avoid over-leveraging your positions. Patience and discipline are key to navigating the BRENT market successfully.
| Indicator | Value | Signal | Interpretation |
|---|---|---|---|
| RSI (14) | 71.16 | Overbought | Potential for pullback |
| MACD Histogram | Positive | Bullish | Continued buying pressure |
| Stochastic | K=90.49, D=81.87 | Overbought | Short-term correction possible |
| ADX | 19.03 | Weak | Lack of strong trend |
| Bollinger Bands | Upper Band | Testing | Price near upper range |
Frequently Asked Questions: BRENT Analysis
Is BRENT a good buy right now?
With BRENT trading at $65.73 and RSI in overbought territory, a cautious approach is advised. Wait for a pullback towards support levels before considering a long position, or a break above resistance to confirm further upside potential.
What is the BRENT price forecast for this week?
The BRENT price forecast for this week is mixed. A break above $65.42 could lead to a test of $66.36, while a break below $65.20 could trigger a correction towards $64.99. Geopolitical developments will likely play a key role.
What are the key support and resistance levels for BRENT?
Key support levels for BRENT are $65.20, $65.10, and $64.99. Key resistance levels are $65.42, $66.36, and $67.23. These levels should be closely monitored for potential breakouts or reversals.
Why is BRENT moving today?
BRENT is moving today due to a combination of factors, including geopolitical tensions, OPEC+ production cuts, and the strength of the US dollar. Market sentiment is also playing a role, with analysts turning more bullish on oil as supply constraints bite.
BRENT's current price action presents both opportunities and risks for traders. While the bullish momentum is undeniable, overbought conditions and conflicting signals from technical indicators warrant caution. By carefully monitoring key levels, geopolitical developments, and market sentiment, traders can position themselves to profit from BRENT's future movements.
Track markets in real-time
AI-powered analysis, technical indicators and real-time price data.
Join Our Telegram Channel
Breaking market news, AI analysis and trading signals instantly.
Join Channel