BRENT Surges to $65.73 on Bullish Trend; Durable Goods Data Looms
BRENT crude oil hits $65.73 amid bullish sentiment, driven by supply concerns. Investors await durable goods data for further direction.
BRENT crude oil is currently trading at $65.73, marking a significant surge fueled by ongoing supply concerns and positive momentum in global markets. The energy sector is closely watching for the upcoming durable goods data, which could provide further insights into economic activity and demand.
The current rally in BRENT is supported by both technical indicators and fundamental factors, including geopolitical tensions and supply disruptions. Monitoring the DXY (Dollar Index) is crucial as its movements often inversely correlate with crude oil prices.
Technical Overview
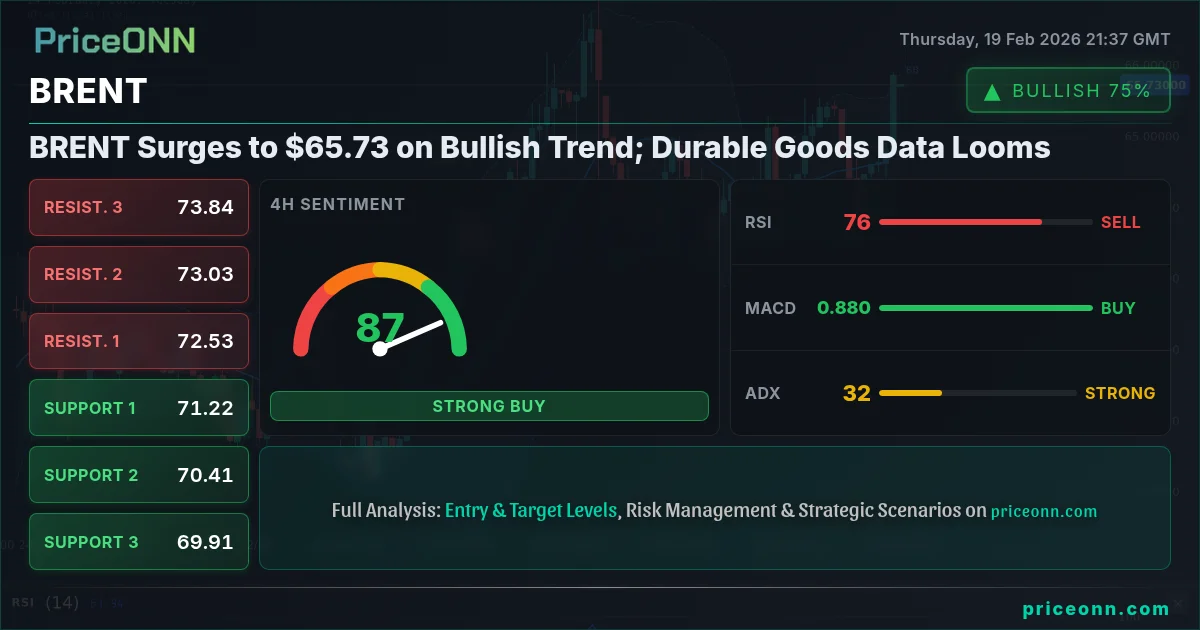
From a technical perspective, BRENT's one-hour chart indicates a neutral trend, though ADX at 19.03 suggests a weak trend overall. The RSI stands at 71.16, entering overbought territory, which could signal a potential pullback. The Stochastic oscillator, with K=90.49 and D=81.87, also confirms overbought conditions, warranting caution.
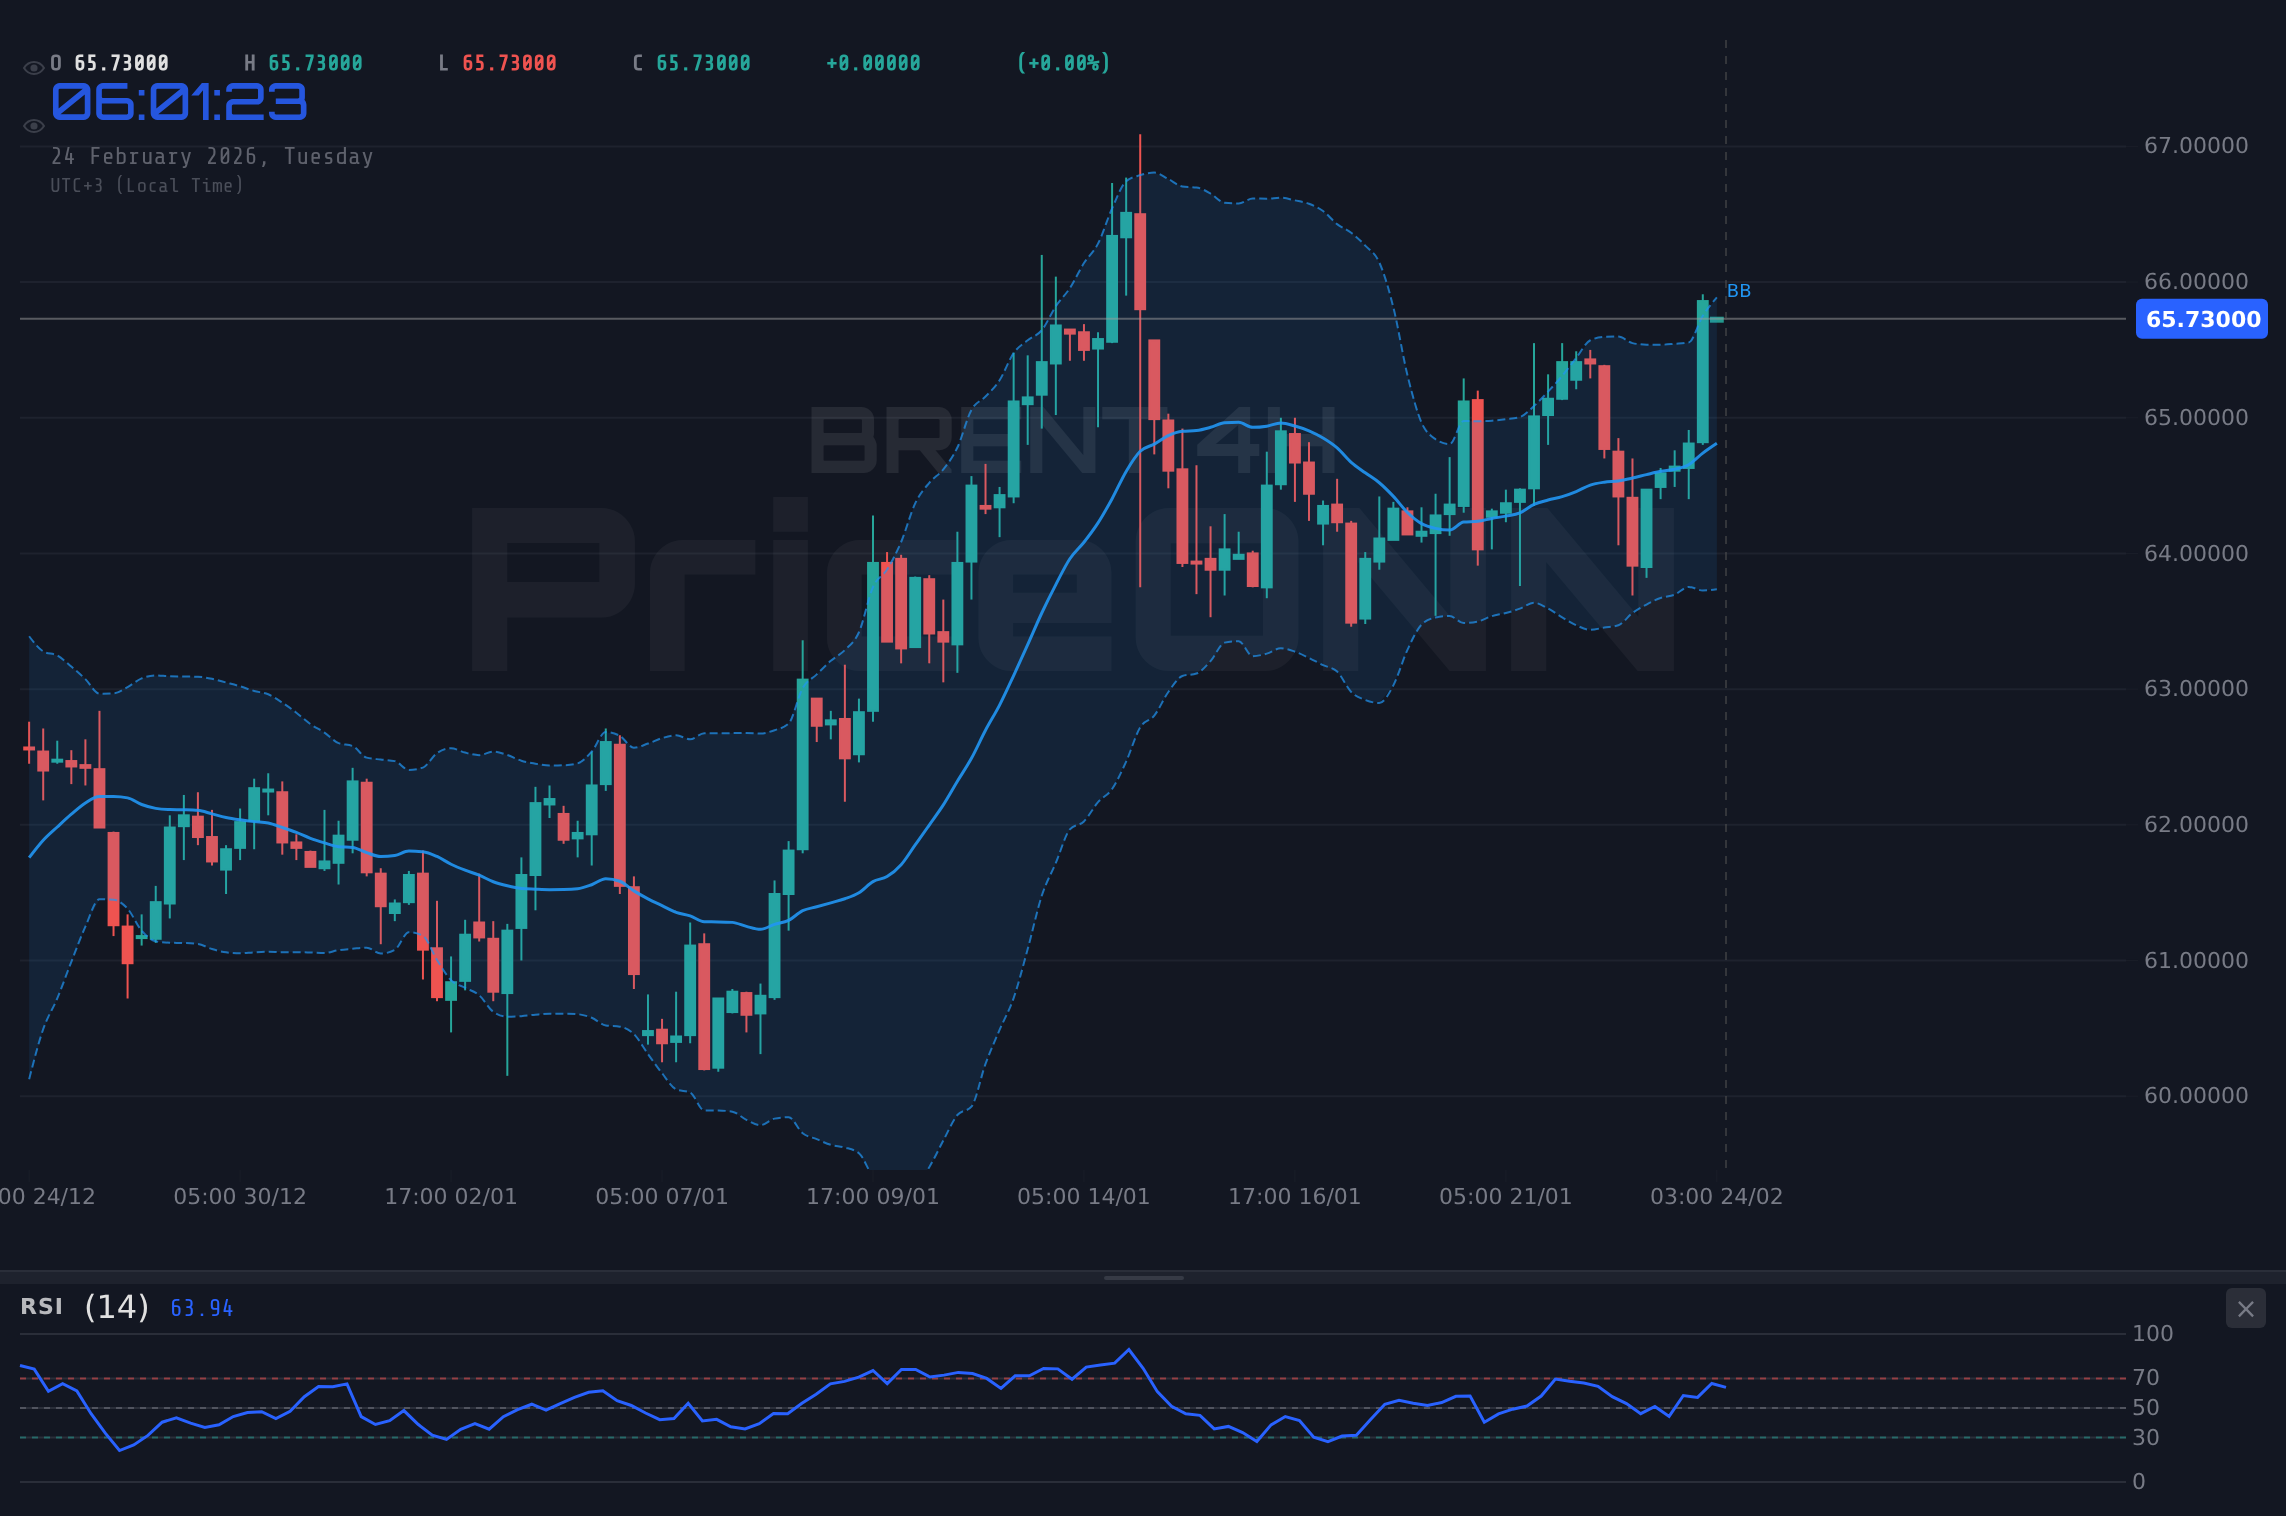
On the 4-hour chart, BRENT exhibits a bullish trend, but a closer look reveals that the RSI is at 62.33, indicating room for further upside before reaching overbought levels. The MACD shows positive momentum, supporting the bullish outlook. Key support and resistance levels to watch are $64.50 and $65.01, respectively.
The daily chart also paints a bullish picture, but the Stochastic oscillator signals a potential trend reversal. The ADX at 28.64 confirms a strong uptrend, suggesting that the bullish momentum is likely to continue in the short term. However, investors should be mindful of potential pullbacks given the overbought conditions indicated by other oscillators.
Fundamental Drivers
Geopolitical tensions in key oil-producing regions continue to support prices. Recent reports of supply disruptions have further tightened the market, contributing to the upward pressure on BRENT. Additionally, a weaker dollar, as indicated by the DXY at 96.86, provides a tailwind for crude oil.
Be cautious of sudden price reversals due to profit-taking or unexpected news events. Always use stop-loss orders to manage risk effectively.
Economic Calendar
The upcoming durable goods data from the U.S. will be a key catalyst for market direction. A strong reading could indicate robust economic activity, potentially boosting demand for crude oil. Conversely, a weak reading could raise concerns about a slowdown, leading to a pullback in prices.
Monitor the spread between BRENT and WTI crude oil prices. A widening spread could indicate regional supply imbalances or transportation bottlenecks, creating trading opportunities.
Trade Plan
Scenario A: Trend Continuation (Primary)
- Direction: Long
- Trigger: H1 close above 65.75
- Target 1: 66.36 (~61 pip)
- Target 2: 67.23 (~148 pip)
- Stop/Invalidation: H1 close below 65.20
Scenario B: Pullback/Reaction (Alternative)
- Condition: $65.20 support holds + RSI divergence
- Trigger: H1 close above 65.75 + volume increase
- Target: $66.00 region
- Invalidation: Close below $65.00
News Risk: Durable Goods Data release may increase volatility. Consider reducing position size.
Indicator Note: RSI 71.16 with overbought, however ADX 28.64 with strong uptrend. RSI may remain overbought for an extended time. Waiting for RSI to move below 60 and ADX to weaken.
Scenario A - Breakout Above $66.00
45% ProbabilityScenario B - Pullback to $64.50
35% Probability| Indicator | Value | Signal | Interpretation |
|---|---|---|---|
| RSI (14) | 71.16 | Bearish | Approaching overbought |
| MACD | Positive | Bullish | Above signal line |
| Bollinger | Over Upper Band | Potential Pullback | Potential Pullback |
| ADX (1D) | 28.64 | Bullish | Strong Uptrend |
BRENT crude oil is exhibiting bullish momentum, but overbought conditions warrant caution. Monitoring key economic data and geopolitical developments is crucial for making informed trading decisions. With disciplined risk management, this market can offer attractive opportunities for prepared investors.
Track markets in real-time
AI-powered analysis, technical indicators and real-time price data.
Join Our Telegram Channel
Breaking market news, AI analysis and trading signals instantly.
Join Channel