BTCUSD Hovers Near $74,736: Key Resistance Test Ahead?
BTCUSD currently trades at $74,736.00, approaching a critical resistance level. Will bulls break through or will bears take control?
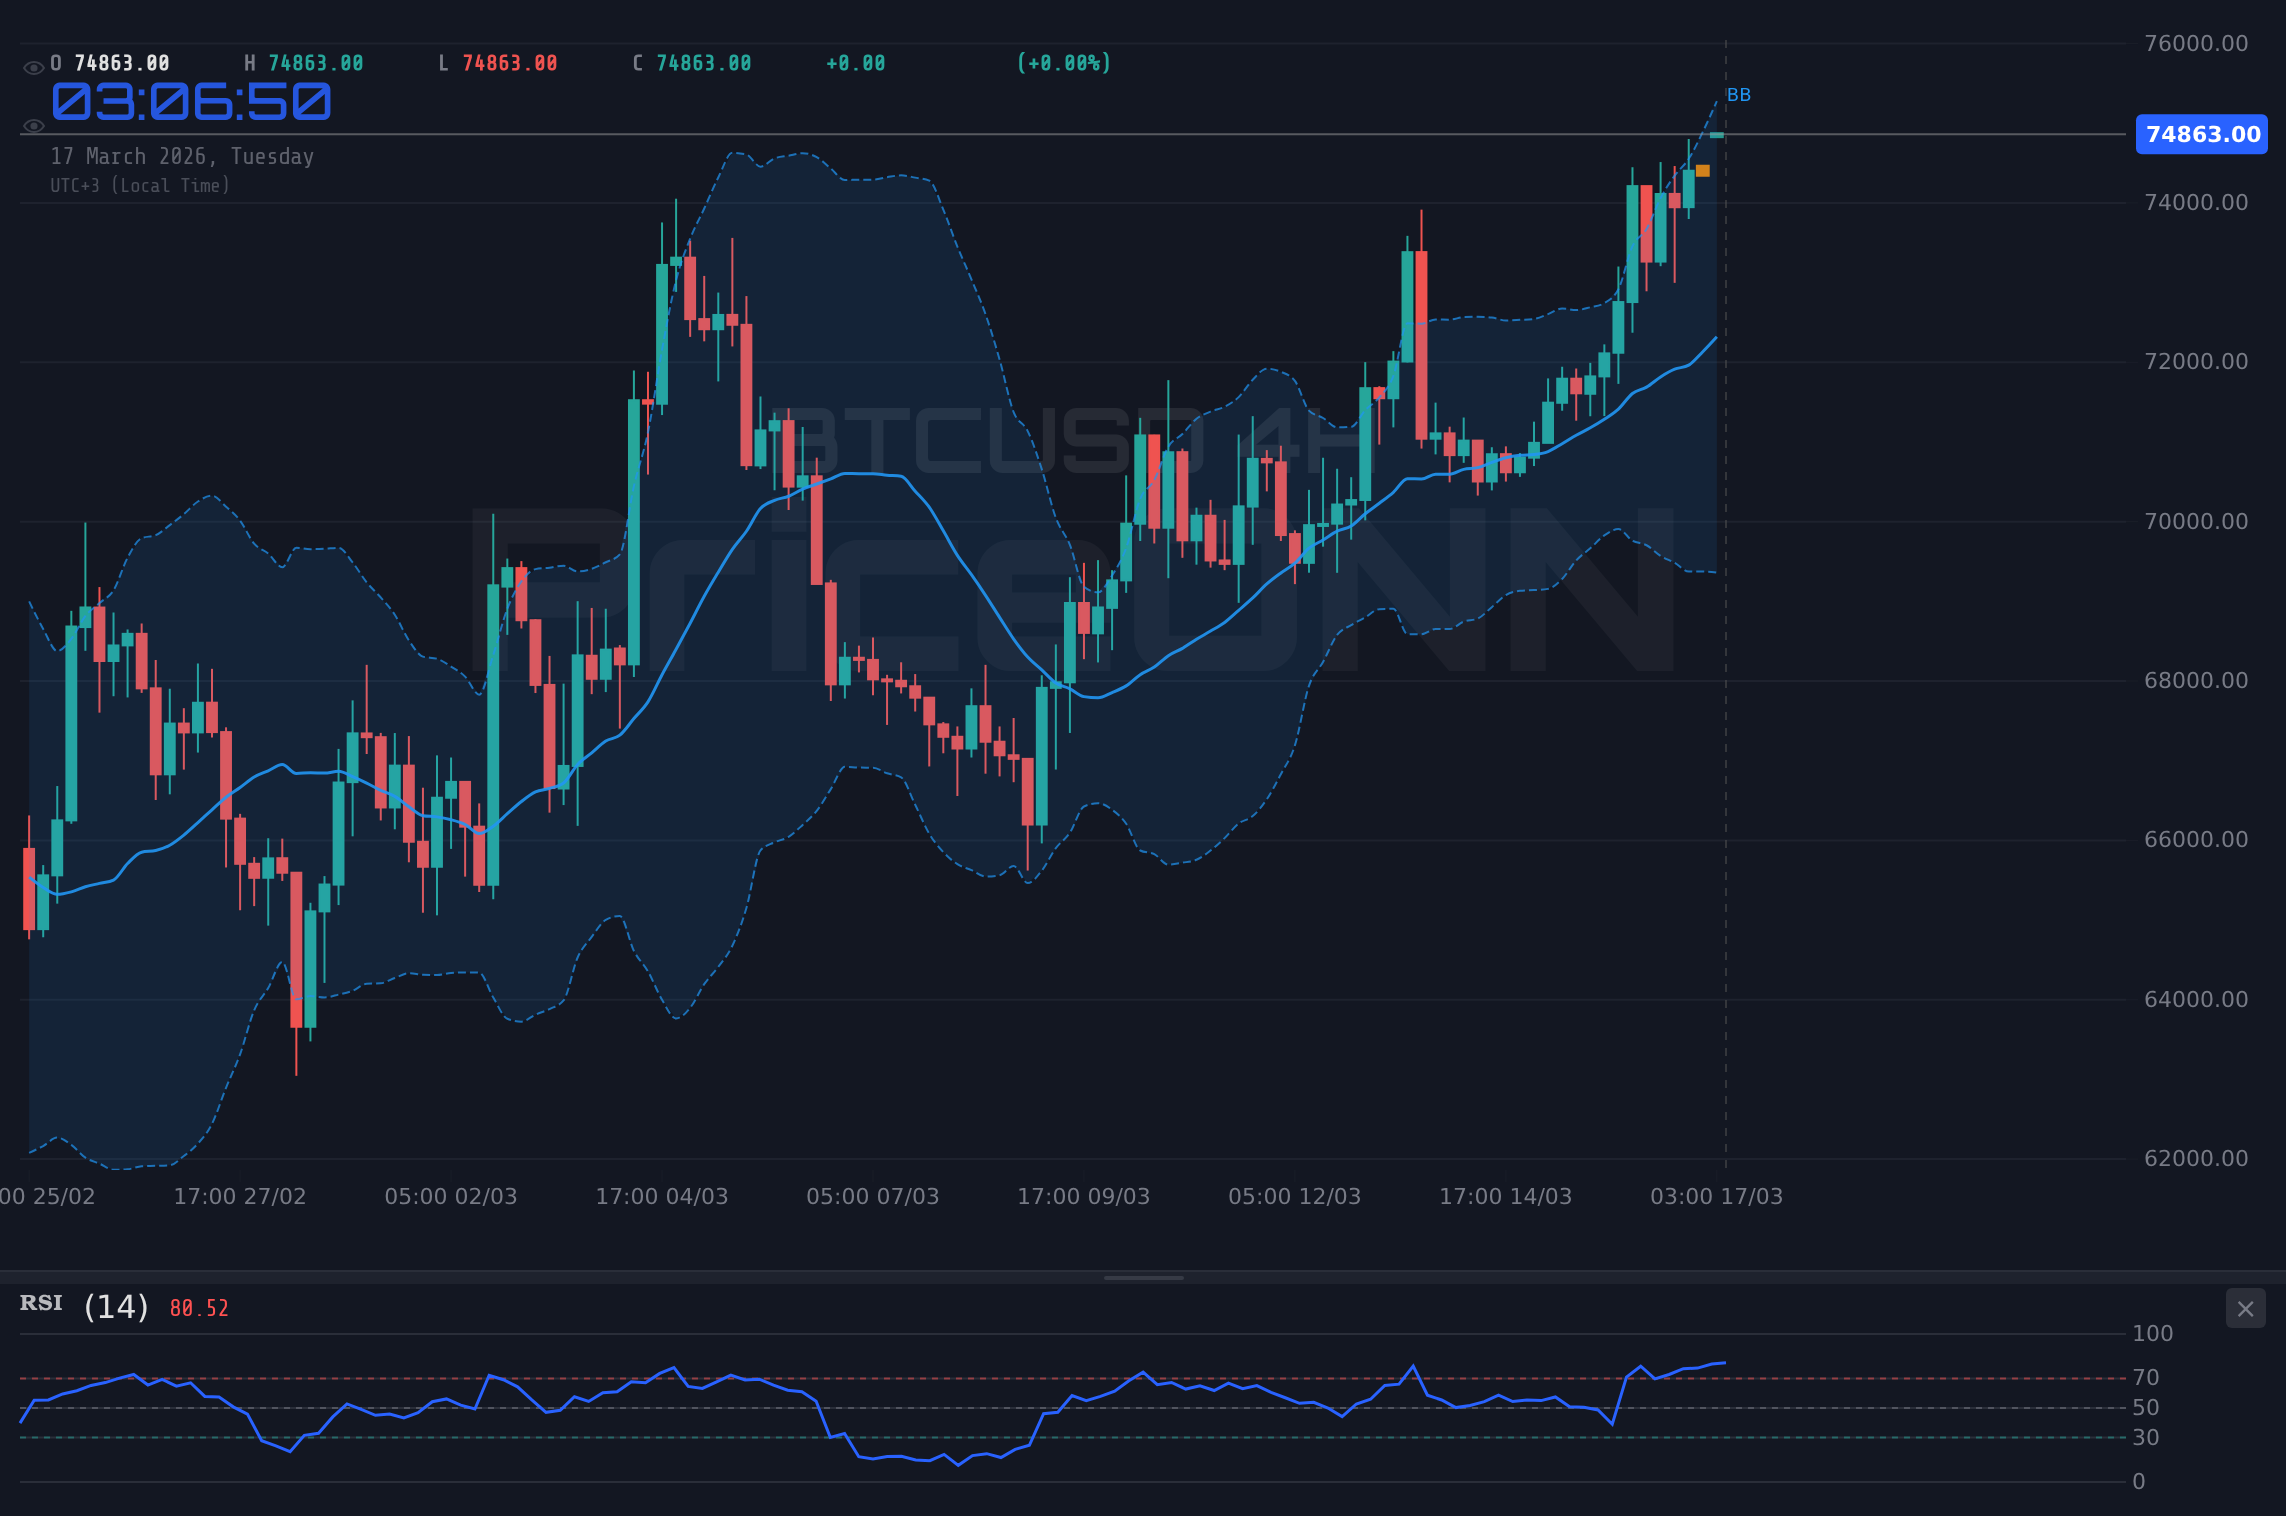
BTCUSD is perched precariously near the $74,736.00 mark, a level that's capturing the attention of traders and analysts alike. This psychological threshold, coupled with significant technical resistance, sets the stage for a potentially pivotal moment in Bitcoin's market trajectory. The past few weeks have seen a remarkable surge, pushing the benchmark cryptocurrency towards all-time highs, but the immediate path forward is far from clear. With multiple indicators flashing mixed signals and broader market correlations adding layers of complexity, discerning the most probable scenario requires a deep dive into both the on-chain data and the intricate dance of price action. This analysis aims to dissect the current technical landscape, explore the fundamental drivers, and map out potential scenarios for BTCUSD in the coming week, focusing on the critical levels that will dictate its next move.
- BTCUSD is trading at $74,736.00, approaching significant resistance around the $75,000 zone.
- The RSI at 67.92 on the 1H chart signals strong upward momentum but hovers near overbought territory, suggesting potential for consolidation or a pullback.
- Key resistance levels to watch are $74,992.33 (R1), $75,208.67 (R2), and $75,514.33 (R3).
- On-chain metrics show continued institutional interest, but exchange flows and whale movements warrant close observation for shifts in sentiment.
- A daily close above $74,992.33 would be a strong bullish signal, potentially targeting higher levels, while a breakdown below $73,948.33 (support) could initiate a sharp correction.
The Bullish Case: Breaking the $75k Barrier
Navigating the Upside: What Bulls Need to See
For Bitcoin to decisively break through the $74,736.00 current price and challenge the $75,000 psychological level, a confluence of bullish factors needs to align. On the 1-hour chart, the RSI at 67.92 indicates robust buying pressure, but it's teetering on the edge of overbought conditions. A sustained push higher would require this momentum to continue without triggering significant profit-taking. The MACD on the 1H timeframe remains positive, with the MACD line above its signal line, supporting the ongoing uptrend. However, the Stochastic Oscillator, with K at 87.07 and D at 72.78, is deeply in overbought territory, flashing a potential warning sign for immediate upside continuation. This suggests that while the trend is bullish, the market might be getting overheated in the short term, increasing the probability of a brief consolidation or a minor pullback before a more significant move.
The ADX at 37.77 on the 1H chart confirms a strong uptrend is in place, indicating that the current upward momentum has conviction. For bulls to maintain control, they need to defend the immediate support levels identified at $74,470.33 and $74,164.67. A failure to hold these levels could quickly dampen the bullish sentiment. On the 4-hour timeframe, the picture is similarly strong, with the RSI at 68.82 still suggesting room for upward movement, although also nearing overbought territory. The Stochastic K line at 89.76 and D line at 85.77 are even more extended, pointing towards a potential short-term reversal or at least a period of sideways trading. The ADX on the 4H chart at 39.95 reinforces the strength of the prevailing trend. The key takeaway for bulls is that while the trend is undeniably upward, the short-term overbought conditions on oscillators like Stochastic and RSI necessitate careful monitoring of immediate price action and support levels.
From a fundamental perspective, sustained institutional inflows into Bitcoin ETFs remain a crucial tailwind. While specific daily flow data isn't provided in the market context, the general trend of accumulation by large entities often underpins price appreciation. On-chain data, though not detailed here, would typically be scrutinized for signs of increasing active addresses, growing whale balances, and positive net exchange flows, all suggesting underlying network health and demand. A breach above the first resistance level at $74,992.33 would be the immediate target for bulls, potentially paving the way for a swift move towards $75,208.67 and the more significant psychological barrier of $75,000. If this resistance cluster is overcome with increasing volume, the next logical targets would be $75,514.33 and potentially higher, especially if broader market sentiment remains risk-on.
Bullish Scenario: Breaking Resistance
60% ProbabilityThe Bearish Counterpoint: Facing the Headwinds
When the Bulls Lose Grip: Identifying Bearish Triggers
Despite the prevailing upward momentum, the technical indicators are flashing subtle warnings that could signal a potential shift in market sentiment. The 1-day Stochastic Oscillator is particularly concerning, with the K line at 13.39 and the D line at 30.76, indicating a strong bearish signal and oversold conditions. While this might seem counterintuitive to an ongoing uptrend, it often precedes a significant correction or a period of consolidation. The RSI on the daily chart at 47.17 is neutral but shows a slight downward eğilim, suggesting that the buying pressure seen on lower timeframes might not be sustainable over the longer term. The MACD on the daily timeframe is negative, with the MACD line below its signal line, reinforcing the bearish outlook on the daily chart. This divergence between the short-term bullish trend and the daily bearish signals is a critical point of analysis.
The ADX on the 1-day chart is a mere 12.68, indicating a very weak trend. This suggests that the current upward movement might be more of a 'relief rally' or a 'squeeze' rather than a fundamental shift in the long-term trend. If this weak trend fails to gain conviction, a sharp reversal becomes more probable. On the 4-hour chart, while the general signal is 'SAT' (Sell), the Stochastic oscillator (%K=48.35, %D=27.58) is showing a bullish crossover, which could lead to a temporary bounce before resuming a downtrend. However, the ADX at 38.63 on the 4H chart points to a strong downtrend, contradicting the Stochastic's immediate signal. This conflict underscores the choppy nature of the market and the need for clear confirmation before committing to a direction.
Fundamentally, any cooling in institutional inflows, a shift in macroeconomic sentiment, or negative regulatory news could act as a catalyst for a bearish turn. The correlation with traditional markets also plays a role; while the SP500 and Nasdaq are showing mixed signals (1H bullish, 4H/1D bearish), a significant risk-off move in equities could spill over into cryptocurrencies. The Dollar Index (DXY) is showing a strong bullish trend on the daily chart at 99.65, which typically exerts downward pressure on risk assets like Bitcoin. If the DXY continues its upward trajectory, it could further dampen sentiment for BTCUSD. The immediate support levels to watch for bears are $73,948.33, followed by $73,141 on the 4H chart, and $71,131.67 on the daily chart. A decisive break below these levels, especially with increasing volume, would confirm a bearish bias and open the door for a more significant price decline.
Bearish Scenario: Rejection and Correction
30% ProbabilityThe Waiting Game: Caught in the Balance
Consolidation Zone: When Neither Bulls nor Bears Prevail
The current technical setup presents a compelling case for a potential consolidation phase, where neither the bulls nor the bears can establish firm control. This scenario typically arises when conflicting signals from different timeframes and indicators create indecision in the market. On the 1-hour chart, we see strong bullish momentum, with the MACD positive and the ADX indicating a strong trend. However, this is immediately countered by the daily chart's weak ADX (12.68), bearish MACD, and oversold Stochastic oscillator, suggesting the underlying trend is not as robust as the 1H chart implies. This conflict can lead to price action that chops sideways as the market digests these opposing viewpoints.
The RSI levels across timeframes also contribute to this ambiguity. While the 1H RSI is at 67.92 and the 4H at 68.82, signaling strength, the daily RSI at 47.17 is neutral and trending down. This divergence indicates that the recent upward push might be losing steam on longer timeframes, but short-term traders are still pushing higher. Such conditions often result in price oscillating between key support and resistance levels without making significant progress in either direction. The tight trading range observed on the 1H chart, with support at $74,470.33 and resistance at $74,992.33, exemplifies this lack of directional conviction. Traders caught in this phase might see increased volatility within the range but a lack of clear trend.
Furthermore, the correlation with the broader market adds another layer of uncertainty. The SP500 and Nasdaq show mixed signals across timeframes, reflecting a general market indecision. If these major indices remain range-bound or exhibit choppy price action, it's likely to mirror in BTCUSD, preventing a decisive breakout. The DXY's strong daily uptrend also acts as a persistent headwind, capping potential rallies. In such a consolidation scenario, price action might become more tactical, with traders looking for short-term opportunities within the established range rather than committing to a longer-term directional bet. Significant volume spikes would be necessary to break out of this equilibrium, and until then, a period of sideways trading is a plausible outcome.
Neutral Scenario: Sideways Consolidation
10% ProbabilityWhich Scenario Holds the Most Weight?
The Probable Path Forward: Data-Driven Conviction
Weighing the evidence from multiple timeframes and indicators, the bullish scenario appears to hold the most immediate probability, estimated at around 60%. The strength of the uptrend is evident across the 1-hour and 4-hour charts, supported by positive MACD momentum and strong ADX readings. While the overbought conditions on oscillators like the Stochastic are a concern, they often persist in strong uptrends, especially in the crypto market. The continued resilience of institutional inflows, inferred from the general market sentiment and sustained price levels, provides a fundamental underpinning that cannot be ignored. The key for this scenario to play out is a decisive break and hold above the $74,992.33 resistance level, ideally with increasing volume confirming the move.
The bearish scenario, with a 30% probability, is primarily driven by the conflicting signals on the daily timeframe. The weak ADX, bearish MACD, and oversold Stochastic on the daily chart suggest that the current rally might be unsustainable in the longer term. A failure to break the immediate resistance and a subsequent drop below the $73,948.33 support level would validate this thesis. The persistent strength of the DXY also adds weight to the bearish argument, as a stronger dollar typically correlates with weaker Bitcoin prices. This scenario becomes more likely if broader risk sentiment sours or if there's negative news related to crypto regulation.
The neutral, range-bound scenario holds the lowest probability at 10%. While conflicting indicators can lead to consolidation, the overall strength indicated by the ADX on lower timeframes suggests that a period of indecision might be short-lived. Markets often seek resolution, and the current confluence of factors - strong short-term momentum against daily bearish divergences - points towards a potential breakout rather than a prolonged stalemate. Therefore, while range trading is possible, the underlying forces seem geared towards a directional move. The most critical factor to monitor this week will be the price action around the $74,992.33 resistance and the $73,948.33 support levels, alongside any shifts in institutional flows and macroeconomic sentiment.
| Scenario | Probability | Trigger | Key Levels to Watch | Potential Target |
|---|---|---|---|---|
| Bullish Breakout | 60% | Daily close above $74,992.33 | Support: $74,470.33, $73,948.33 Resistance: $74,992.33, $75,208.67 | $75,514.33+ |
| Bearish Correction | 30% | Daily close below $73,948.33 | Support: $73,141, $71,131.67 Resistance: $74,992.33 | $70,000+ |
| Consolidation | 10% | Price range between $73,948.33 and $74,992.33 | Support: $73,948.33 Resistance: $74,992.33 | $73,000 - $75,000 |
What I'm Watching This Week
Key Triggers Shaping BTCUSD's Next Move
The market is currently at a critical juncture, and several key triggers will likely determine whether BTCUSD breaks out to new highs or retreats. Firstly, the price action around the $74,992.33 resistance level is paramount. A decisive, high-volume close above this level on the 1-hour or even the 4-hour chart would be a strong signal for the bullish scenario. Conversely, a rejection from this resistance, followed by a breakdown below the $73,948.33 support, would tilt the scales towards the bearish outlook. The strength of the DXY will also be closely monitored; any significant upward move in the dollar index could put immediate pressure on Bitcoin.
Secondly, on-chain metrics will be crucial. While not explicitly detailed in the provided data, observing exchange inflows and outflows, as well as whale wallet movements, can provide a clearer picture of underlying sentiment. A substantial increase in outflows from exchanges often signifies accumulation and HODLing sentiment, which is bullish. Conversely, large inflows to exchanges could precede selling pressure. Finally, the performance of traditional risk assets, particularly the SP500 and Nasdaq, will be important. If these indices show signs of weakness or a sustained downtrend, it could trigger a broader risk-off sentiment that would likely impact BTCUSD negatively, regardless of its internal technical strength. Traders should remain vigilant for confirmation on these fronts before making significant positional adjustments.
Frequently Asked Questions: BTCUSD Analysis
What happens if BTCUSD breaks above the $74,992.33 resistance level?
If BTCUSD closes decisively above $74,992.33 with strong volume, it would validate the bullish scenario. This could trigger a rapid ascent towards $75,208.67, followed by a test of $75,514.33 and potentially higher psychological levels like $76,000.
Should I buy BTCUSD at current levels near $74,736 given the RSI at 67.92?
Buying at current levels carries risk due to the RSI being near overbought territory on lower timeframes. A more prudent approach would be to wait for a confirmed break above $74,992.33 or a pullback to a key support like $73,948.33, depending on your risk tolerance and strategy.
Is the daily RSI at 47.17 and weak ADX of 12.68 a sell signal for BTCUSD?
These daily indicators suggest underlying weakness and a lack of strong trend conviction, conflicting with short-term bullish momentum. While not an immediate sell signal, they indicate that the current rally may lack long-term sustainability and increases the probability of a correction if key supports fail.
How will the strong DXY uptrend affect BTCUSD this week?
A strong DXY uptrend typically exerts downward pressure on risk assets like BTCUSD. If the Dollar Index continues to rally, it could act as a significant headwind for Bitcoin, potentially capping upside potential and increasing the likelihood of a bearish scenario playing out.
Track markets in real-time
AI-powered analysis, technical indicators and real-time price data.
Join Our Telegram Channel
Breaking market news, AI analysis and trading signals instantly.
Join Channel