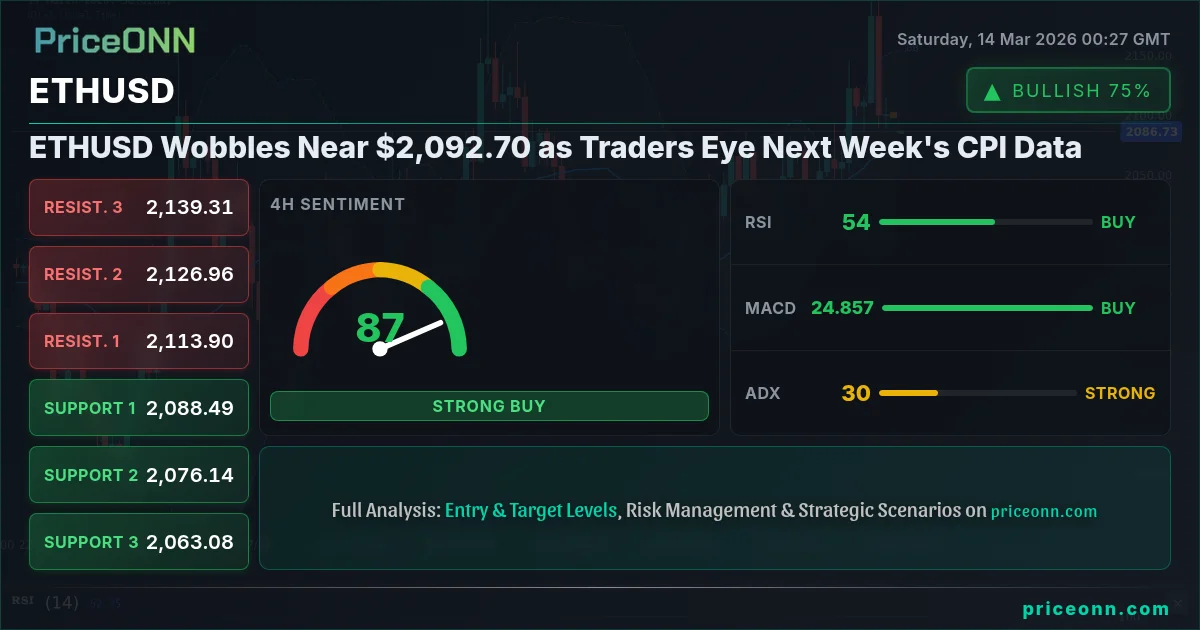
Ethereum (ETHUSD) has experienced a relatively flat week, trading near $2,092.70. With market volatility subdued, traders are now keenly anticipating the upcoming Consumer Price Index (CPI) data release next week, which could inject some much-needed momentum into the market. This period of consolidation comes amid a backdrop of geopolitical tensions and fluctuating sentiments in the broader cryptocurrency market.
- ETHUSD trades near $2,092.70, showing limited movement this week.
- Strong resistance observed at $2,100.98 on the 1H chart.
- Hourly RSI at 47.08 indicates neutral conditions.
- Next week's CPI data is expected to be a major catalyst for ETHUSD.
The recent sideways movement in ETHUSD can be attributed to a combination of factors, including profit-taking after a period of strong gains and uncertainty surrounding the macroeconomic outlook. The overall trend in ETHUSD remains bullish on the 4H timeframe, as indicated by the current price being above the middle band of the Bollinger Bands. However, the short-term picture is less clear, with the hourly chart showing a neutral trend and the price oscillating around the $2,092.70 level. The 1H chart shows immediate resistance at $2,100.98.
From a technical perspective, the hourly Relative Strength Index (RSI) reading of 47.08 suggests neutral conditions, with neither overbought nor oversold signals dominating the market. The Moving Average Convergence Divergence (MACD) on the hourly chart indicates negative momentum, with the MACD line below the signal line, further supporting the notion of short-term bearish pressure. However, the 4H timeframe indicates that the MACD is showing positive momentum, which suggests that the overall bullish trend is still intact.
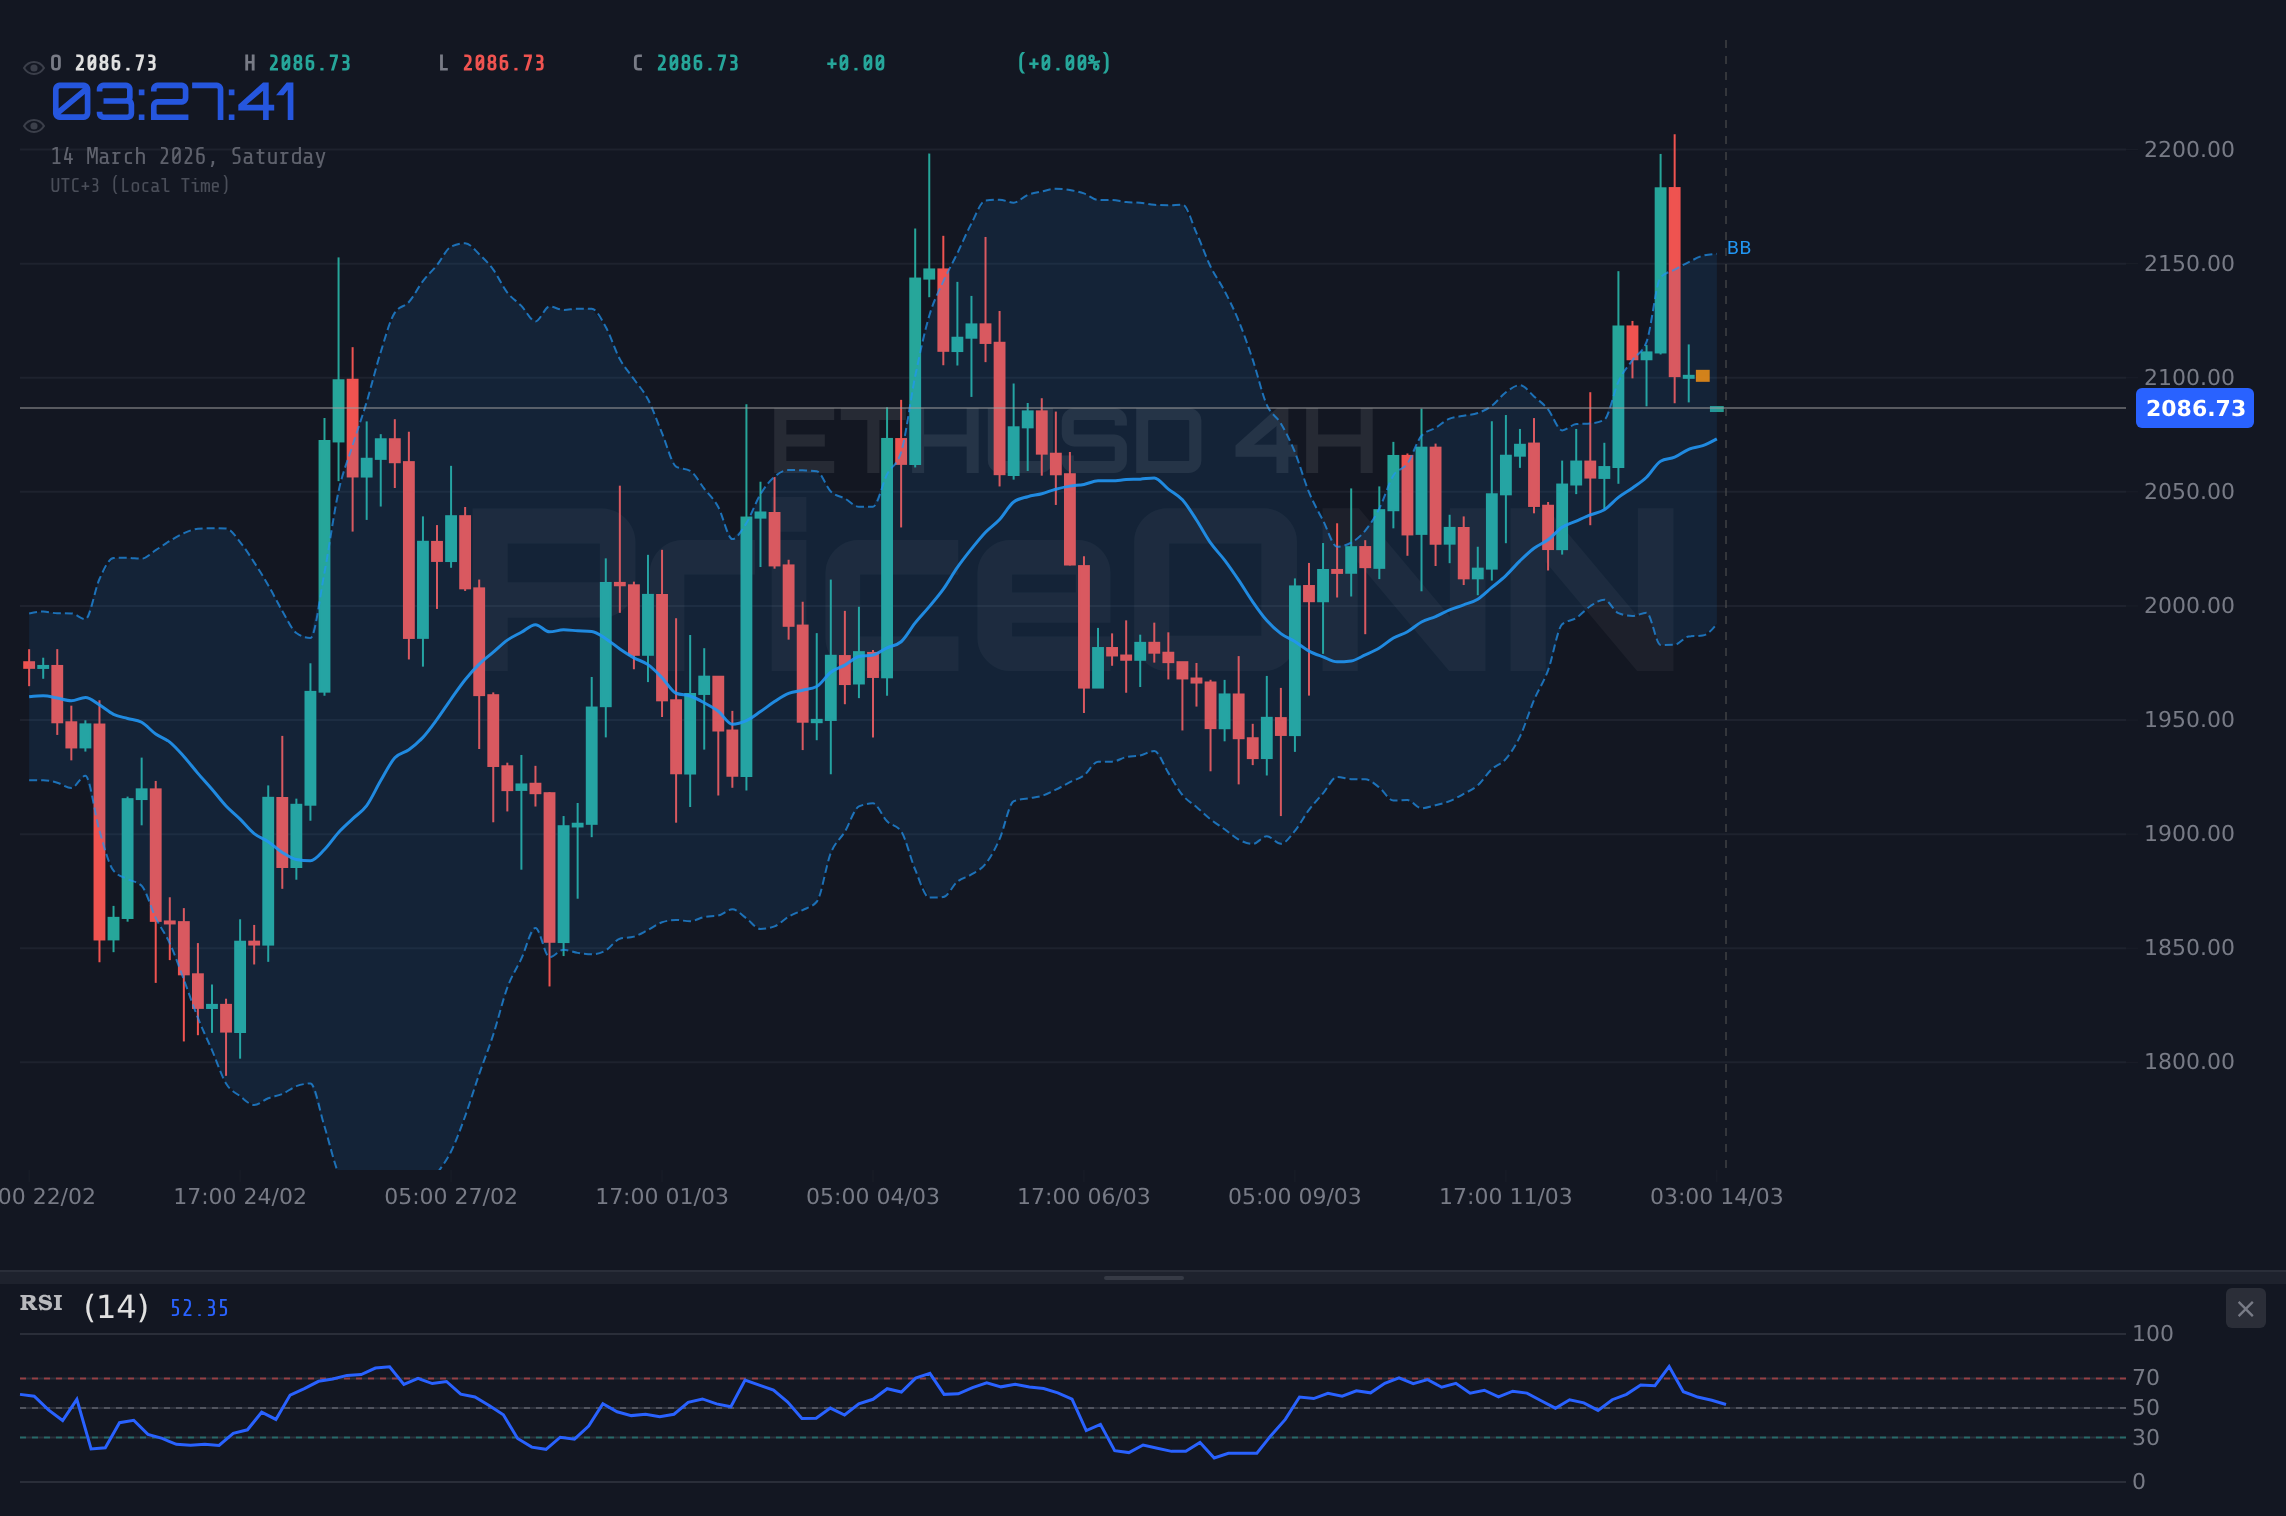
Looking at the broader cryptocurrency market, it is evident that Ethereum is currently trading within a defined range, with support around $2,074.28 on the hourly chart and resistance near $2,100.98. A breakout above or below these levels could trigger a significant move in either direction. The daily chart shows that ETHUSD is trading above the middle band of the Bollinger Bands, but the Stochastic oscillator reading of 56.85 indicates that the market is neither overbought nor oversold, which suggests that there is room for further upside potential.
One of the key factors driving the cryptocurrency market is the macroeconomic outlook. The upcoming CPI data release next week is expected to provide further insights into the state of inflation, which could influence the Federal Reserve's monetary policy decisions. Hawkish comments from Fed officials have already fueled speculation about a potential interest rate hike, which could put downward pressure on risk assets, including cryptocurrencies. According to Reuters, "Fed officials remain concerned about persistent inflation and are prepared to take further action if necessary."
The recent strength in the U.S. Dollar Index (DXY), which currently stands at 100.2, has also weighed on ETHUSD. A stronger dollar tends to put downward pressure on cryptocurrencies and other risk assets, as it makes them more expensive for international investors. The DXY has been gaining ground in recent weeks due to a combination of factors, including safe-haven demand amid geopolitical tensions and expectations of higher interest rates in the United States. With the DXY currently at 100.2, ETHUSD is under pressure.
Analyzing on-chain metrics provides additional insights into the behavior of Ethereum's network. Active addresses, for example, can be a useful indicator of network activity and adoption. A sustained increase in active addresses typically suggests growing interest in Ethereum and its ecosystem, while a decline may signal waning enthusiasm. Whale movements, or large transactions involving significant amounts of Ether, can also provide valuable clues about the sentiment of major players in the market. Large exchange inflows may indicate selling pressure, while large outflows could suggest accumulation.
Developments in the decentralized finance (DeFi) and non-fungible token (NFT) ecosystems also play a crucial role in shaping Ethereum's price action. The total value locked (TVL) in DeFi protocols built on Ethereum can be a useful gauge of the platform's overall health and growth potential. A rising TVL typically suggests increasing adoption of DeFi applications and a greater demand for Ether as collateral. Similarly, the NFT market's performance can impact Ethereum's price, as the majority of NFTs are minted and traded on the Ethereum blockchain.
Regulatory news also has a significant impact on the cryptocurrency market, with announcements of new regulations or policy changes often triggering sharp price swings. Increased regulatory scrutiny can create uncertainty and deter institutional investors, while clear and favorable regulations can boost confidence and attract new capital. Recent regulatory developments have included discussions about the classification of cryptocurrencies as securities, the implementation of anti-money laundering (AML) measures, and the taxation of digital assets.
Bitcoin dominance, which measures the percentage of the total cryptocurrency market capitalization held by Bitcoin, can also influence the performance of Ethereum and other altcoins. A rising Bitcoin dominance typically suggests that investors are favoring Bitcoin over altcoins, while a declining dominance may indicate growing interest in altcoins. Ethereum's correlation with Bitcoin is also an important factor to consider, as the two cryptocurrencies often move in tandem. However, there have been periods of decoupling, during which Ethereum has outperformed or underperformed Bitcoin due to its own unique catalysts.
Institutional adoption trends are also closely watched by market participants. The increasing involvement of institutional investors in the cryptocurrency market is seen as a sign of maturation and legitimacy, which could lead to greater stability and higher prices. Institutional investors typically have longer investment horizons and larger capital allocations, which can provide significant support for the market. Recent institutional adoption trends have included the launch of Bitcoin and Ethereum exchange-traded funds (ETFs), the allocation of cryptocurrency to corporate treasuries, and the adoption of blockchain technology by major financial institutions. According to Bloomberg, "Institutional investors are increasingly allocating capital to cryptocurrencies, signaling growing acceptance of digital assets."
Given the current technical and fundamental backdrop, the most likely scenario for ETHUSD is continued consolidation in the short term, followed by a breakout in either direction depending on the outcome of the upcoming CPI data release. A break above $2,100.98 could trigger a rally towards $2,115.25 and $2,127.68, while a break below $2,074.28 could lead to a decline towards $2,061.85 and $2,047.58. The ADX on the 1H chart is at 34.66, which suggests a strong trend.
From a trading perspective, it may be prudent to remain on the sidelines until the CPI data is released and the market's reaction becomes clear. Traders with a bullish bias may consider entering long positions on a break above $2,100.98, while those with a bearish bias may look for shorting opportunities on a break below $2,074.28. It is important to manage risk carefully and use appropriate stop-loss orders to protect against unexpected price swings. The Stochastic oscillator is at 12.44 on the 1H chart, which indicates that the market may be oversold.
The energy sector is also playing a role in the broader market sentiment. WTI crude oil is trading near $99.18, holding its ground as strategic reserve releases offset concerns about the Middle East situation, according to recent reports. Brent crude is nearing $103.82 a barrel amid rising tensions in the Strait of Hormuz. These energy price movements are influencing inflation expectations and, consequently, the Federal Reserve's policy outlook.
Circle's USDC recently overtook Tether's USDT in adjusted year-to-date volume, according to Mizuho. Anchorage Digital is tying in Puffer Finance for institutional Ethereum restaking, and Tether joined a $5.2 million round in stablecoin infrastructure builder Ark Labs. These developments signal ongoing innovation and investment in the cryptocurrency space.
Trade Recommendation: WATCH_ZONE
Given the mixed signals and the anticipation of next week's CPI data, the recommendation is to remain in a watch zone. A daily close above $2,100.98 would open the door for further bullish momentum, potentially targeting the $2,115.25 and $2,127.68 resistance levels. However, a break below the $2,074.28 support level would signal a potential shift in momentum, potentially leading to further downside towards $2,061.85 and $2,047.58.
Frequently Asked Questions: ETHUSD Analysis
What happens if ETHUSD breaks above $2,100.98 resistance?
A break above $2,100.98 resistance on the hourly chart could trigger a rally towards $2,115.25 and $2,127.68. This would be a bullish signal, potentially indicating a continuation of the overall uptrend.
Should I buy ETHUSD at current levels of $2,092.70 given the RSI at 47.08?
With the RSI at 47.08 on the hourly chart, conditions are neutral, so a buy signal is not immediately apparent. It may be prudent to wait for a clearer signal, such as a break above $2,100.98 resistance or a bullish divergence on the MACD.
Is the Stochastic oscillator reading of 12.44 a buy signal for ETHUSD?
The Stochastic oscillator reading of 12.44 on the hourly chart indicates that the market may be oversold, but it is not necessarily a buy signal on its own. It is important to consider other factors, such as the overall trend and key support and resistance levels, before making a trading decision.
How will next week's CPI data affect ETHUSD this week?
Next week's CPI data release is expected to be a major catalyst for ETHUSD. Higher-than-expected inflation could lead to a more hawkish stance from the Federal Reserve, which could put downward pressure on cryptocurrencies. Conversely, lower-than-expected inflation could lead to a more dovish stance, which could boost risk assets, including ETHUSD.
Technical Outlook Summary
| Indicator | Value | Signal |
|---|---|---|
| RSI (14) | 47.08 | Neutral |
| MACD Histogram | Negative | Bearish |
| Stochastic | 12.44 | Oversold |
| ADX | 34.66 | Strong |
| Bollinger | Middle Band | Watch |
Key Levels
Support Levels
Resistance Levels
Track markets in real-time
AI-powered analysis, technical indicators and real-time price data.
Join Our Telegram Channel
Breaking market news, AI analysis and trading signals instantly.
Join Channel