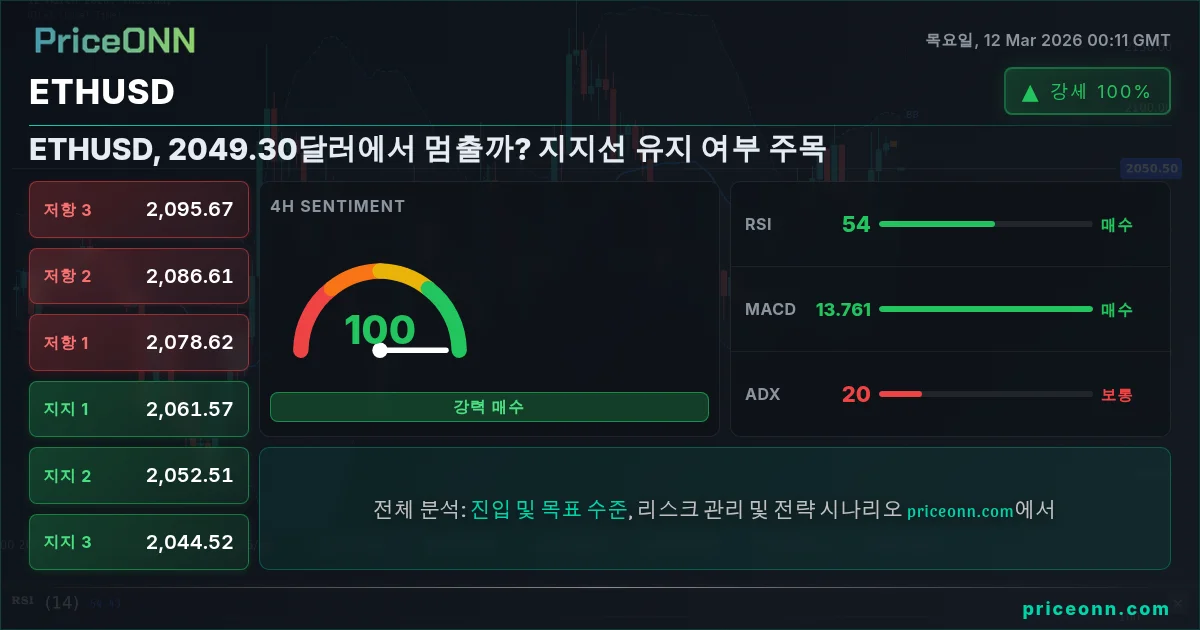
ETHUSD가 2,049.30달러 부근에서 약세론자들의 압박이 거세지면서 중요한 기로에 서 있습니다. 매수세력과 매도세력 간의 싸움이 격화되고 있으며, 다음 움직임이 미국 달러 대비 이더리움의 단기적인 궤적을 결정할 수 있습니다. 지지선이 유지될까요, 아니면 약세론자들이 가격을 더 낮출 수 있을까요? 오늘 이더리움 분석에 따르면 중요한 변곡점에 와 있습니다.
ETHUSD 강세 시나리오
현재의 약세 압력에도 불구하고 ETHUSD가 지지선을 찾고 잠재적으로 반등할 수 있다고 믿을 만한 이유가 있습니다. 우선, 더 넓은 암호화폐 시장은 규제 역풍에 직면하여 회복력을 보여주었으며, 두 번째로 큰 암호화폐인 이더리움은 종종 선두를 달립니다. 일간 차트는 Stochastic이 K=43.66, D=44.76으로 잠재적인 바닥 형성을 나타내며 반등 가능성을 보여줍니다. 이러한 강세 크로스오버는 매도 압력이 약해지고 매수자들이 주요 지지선을 방어하기 위해 나설 수 있음을 시사합니다. 또한, ETHUSD 1시간 차트는 RSI가 50.92로 중립적인 입장을 나타내며, 긍정적인 모멘텀이 구축되면 강세로 전환될 수 있습니다.
기본적인 관점에서 볼 때, 이더리움 블록체인에서 탈중앙화 금융(DeFi)과 대체 불가능한 토큰(NFT)의 채택이 증가함에 따라 Ether에 대한 수요가 계속 증가하고 있습니다. 확장성을 개선하고 에너지 소비를 줄이는 것을 약속하는 다가오는 이더리움 2.0 업그레이드는 가격 상승의 또 다른 잠재적 촉매제입니다. 업그레이드에 대한 긍정적인 소식은 강세 심리를 다시 불러일으키고 ETHUSD를 더 높이 밀어 올릴 수 있습니다. 더욱이, 이더리움에 대한 기관의 관심이 증가하고 있으며, 더 많은 기업이 기술을 운영에 통합하는 방법을 모색하고 있습니다. 대기업이 이더리움을 채택했다는 주요 발표는 시장에 강력한 강세 신호를 보낼 수 있습니다.
더 넓은 시장을 살펴보면 SP500은 현재 6713.55로 약간의 약세 추세를 보이고 있습니다. SP500이 안정화되거나 반등하면 ETHUSD에 긍정적인 영향을 미칠 수 있습니다. 두 자산은 종종 긍정적인 상관관계를 나타내기 때문입니다. 스캘퍼는 2,040.37달러 지지선에서 빠른 반등을 주시할 수 있으며, 스윙 트레이더는 2,075.65달러 저항선 위로 돌파하여 강세 반전을 확인할 때까지 기다릴 수 있습니다. 장기 투자자는 현재 하락을 ETH를 할인된 가격으로 축적할 수 있는 기회로 보고 이더리움 생태계의 장기적인 성장 잠재력에 베팅할 수 있습니다. 이란 긴장이 유로존 안정성을 위협함에 따라 원유가 90달러를 주시하고 있다는 최근 속보는 투자자들이 지정학적 불확실성 속에서 암호화폐와 같은 안전 자산으로 눈을 돌릴 수 있으므로 ETHUSD에도 영향을 미칠 수 있습니다.
ETHUSD 약세 시나리오
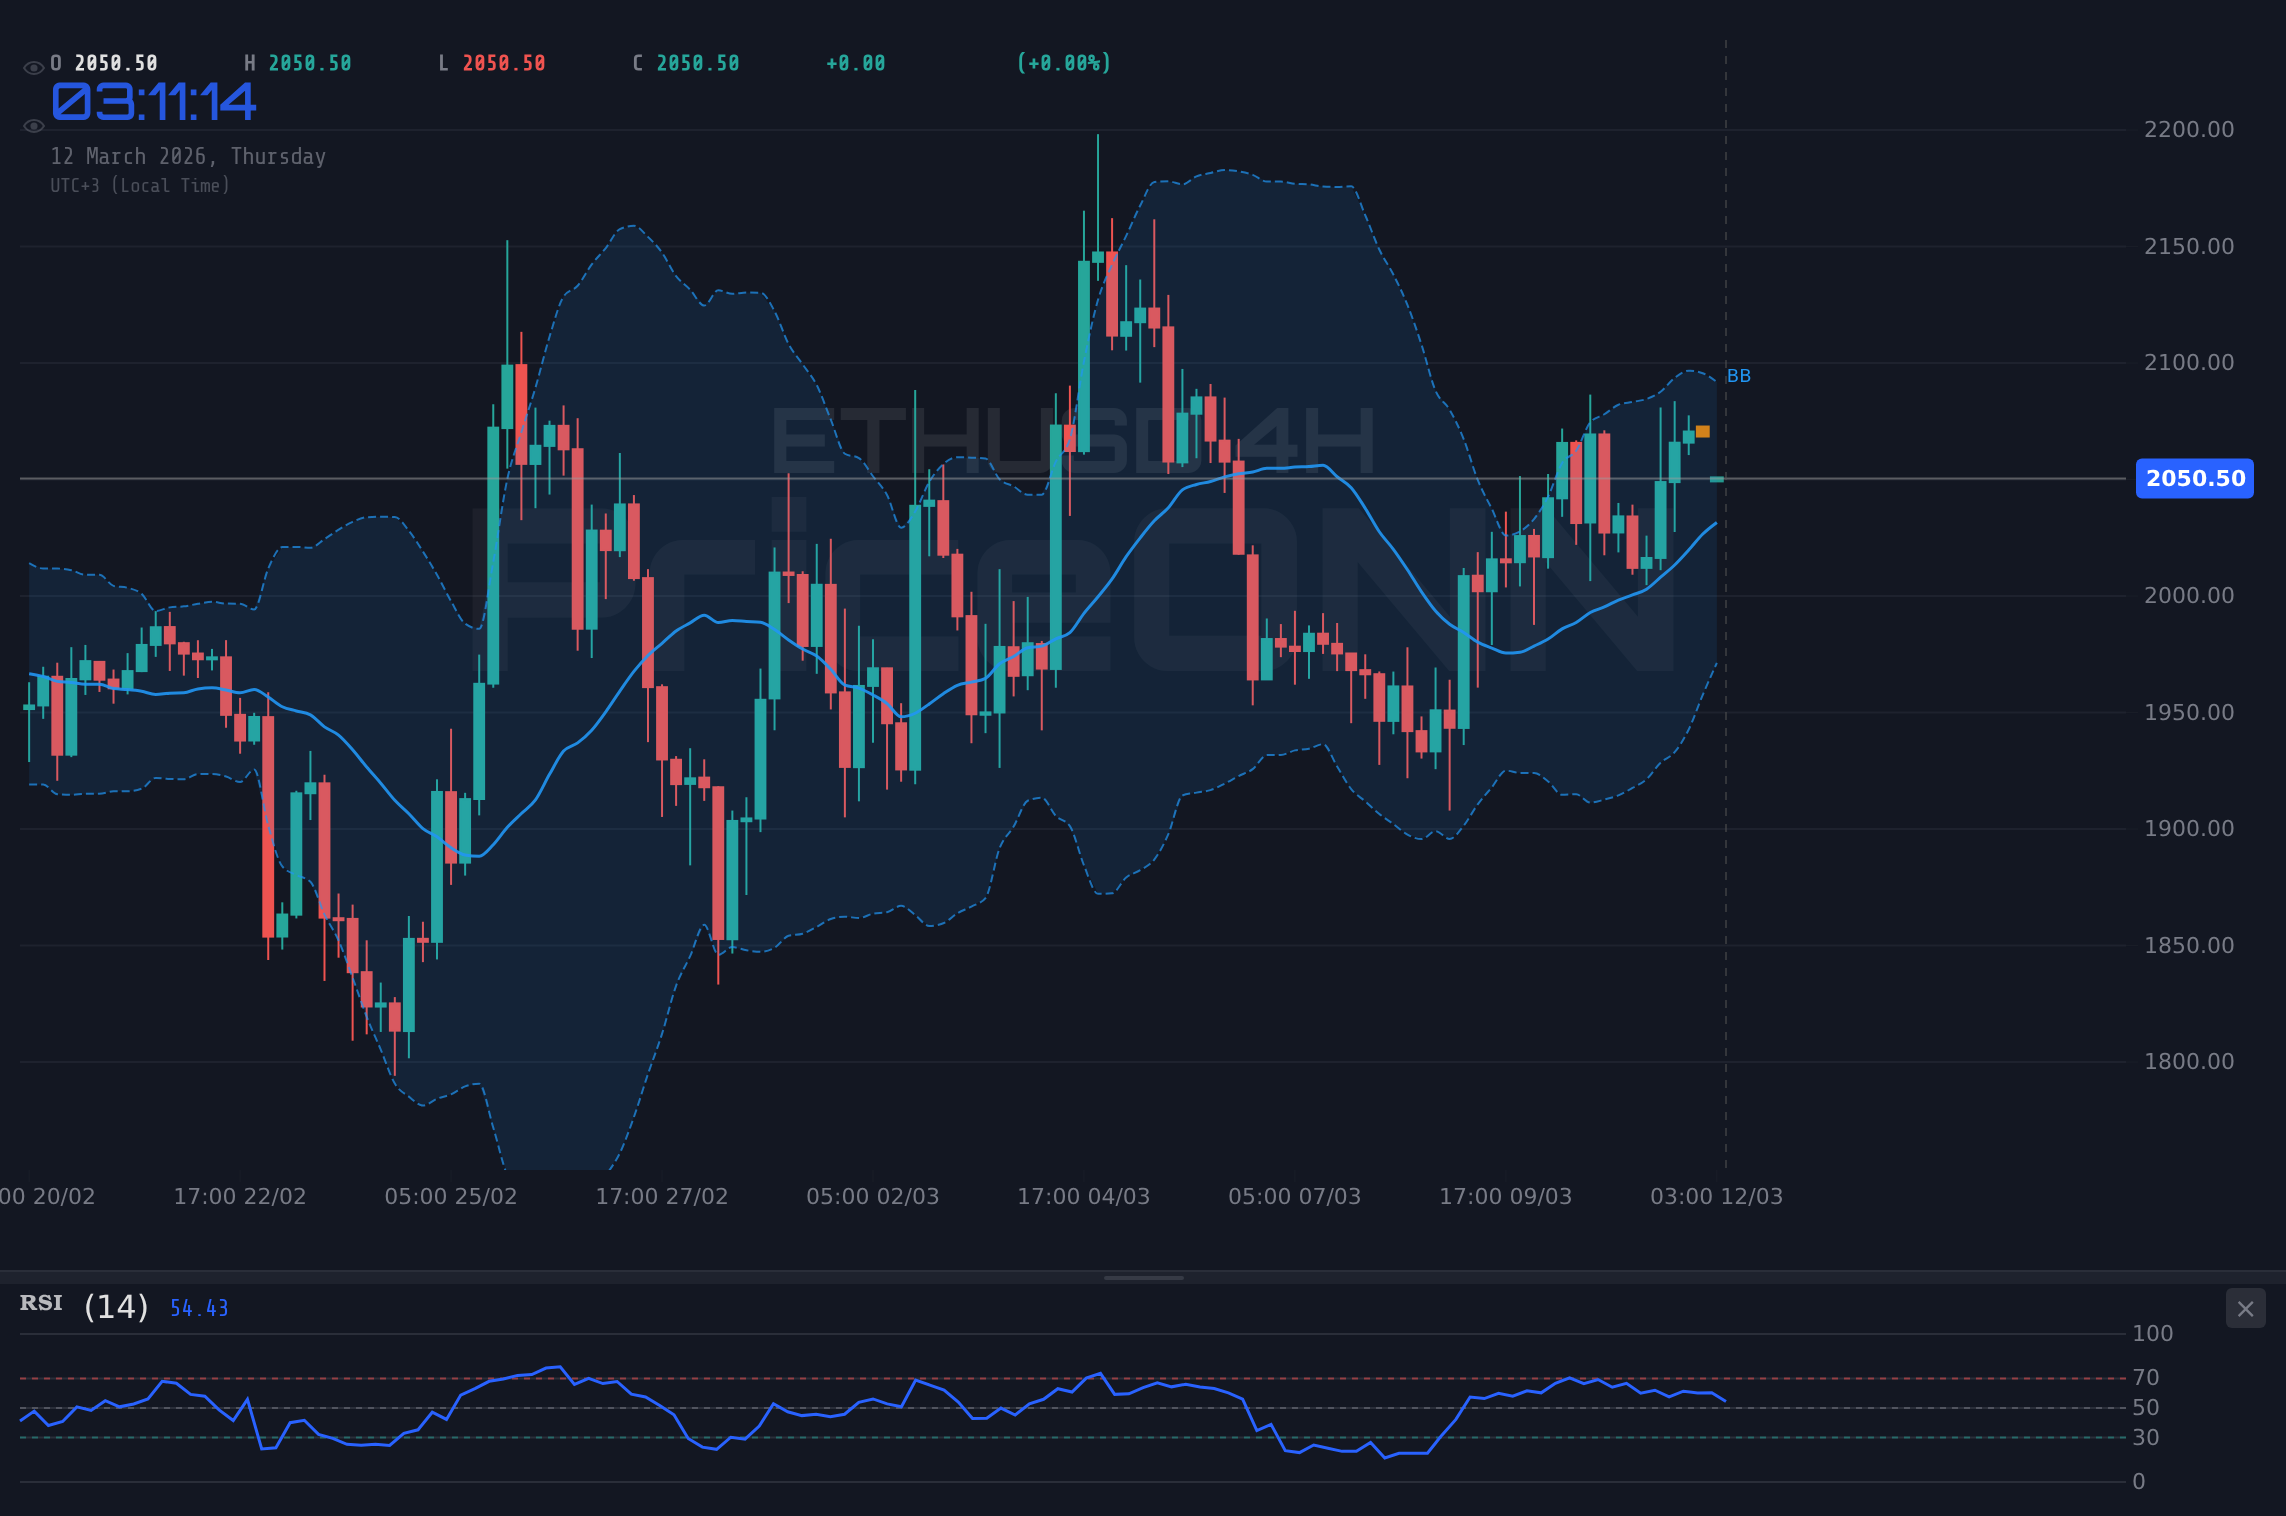
반면에 ETHUSD에서 지속적인 약세 추세에 대한 설득력 있는 주장이 있습니다. 일간 차트는 ADX가 24.89로 추세 강도가 보통임을 나타내는 강력한 하락 추세를 보여줍니다. 이는 약세론자들이 여전히 통제하고 있으며 추가 하락이 가능하다는 것을 시사합니다. MACD 히스토그램도 음수여서 약세 모멘텀을 확인합니다. 또한, 4시간 차트는 RSI가 55.25로 과매도 상태에 도달하기 전에 추가 하락의 여지가 있음을 나타내는 하락 추세를 보여줍니다. Stochastic은 K=61.13, D=46.96으로 해당 페어가 하락세로 향하고 있음을 나타냅니다.
기본적으로 규제 불확실성은 암호화폐 시장의 주요 역풍으로 남아 있습니다. 정부 기관의 감시 강화는 투자자의 열정을 꺾고 추가 가격 하락으로 이어질 수 있습니다. 규제 단속에 대한 부정적인 소식은 ETHUSD에서 상당한 매도세를 촉발할 수 있습니다. 또한, 블록체인 기술의 환경 영향에 대한 우려는 특히 더 많은 기업과 투자자가 지속 가능성을 우선시함에 따라 이더리움 가격에 부담을 줄 수 있습니다. 주요 환경 단체가 이더리움을 비판하면 부정적인 심리가 촉발되고 가격이 하락할 수 있습니다. 현재 99.27인 DXY는 강한 상승 추세를 보이고 있으며, 이는 일반적으로 ETHUSD에 압력을 가합니다. 달러가 강세를 보임에 따라 투자자가 ETH를 구매하는 데 더 많은 비용이 소요되어 잠재적으로 수요 감소로 이어질 수 있습니다.
스캘퍼는 2,040.37달러 지지선 아래로 하락하여 숏 포지션을 취할 기회를 주시할 수 있으며, 스윙 트레이더는 2,002.82달러 지지선 아래로 하락하여 하락 추세를 확인할 때까지 기다릴 수 있습니다. 장기 투자자는 약세 추세가 지속되면 ETH에 대한 노출을 줄이는 것을 고려하고 규제 전선과 이더리움 2.0 업그레이드의 성공에 대한 더 많은 명확성을 기다릴 수 있습니다. 달러가 CPI 데이터에서 강세를 보임에 따라 유로가 1.1590 아래로 하락했다는 최근 소식은 ETHUSD에 대한 약세 심리를 더할 수 있습니다. 달러 강세는 해당 페어에 더 많은 압력을 가할 수 있기 때문입니다.
제공된 데이터의 일반적인 신호는 ETHUSD에 대한 매도를 나타냅니다. 1시간 차트는 중립 추세를 보이지만 4시간 차트는 강한 하락 추세를 보여줍니다. 이는 약세 모멘텀이 구축되고 있으며 추가 하락이 예상된다는 것을 시사합니다. 주시해야 할 주요 수준은 1981.1달러 지지선입니다. 이 수준 아래로 하락하면 상당한 매도세가 촉발될 수 있으며, 이 수준 위로 유지되면 잠재적인 반등을 알릴 수 있습니다.
기술적 분석: 승패를 가르는 요소
다양한 시간대에 걸쳐 기술 지표를 살펴보면 혼합된 그림이 나타나지만 약간 약세로 기울어져 있습니다. 1시간 차트에서 상대 강도 지수(RSI)는 50.92로 중립 영역에 머물러 강한 매수 또는 매도 압력을 나타내지 않습니다. 그러나 MACD는 신호선 위로 긍정적인 모멘텀을 보여주어 약간 더 강세적인 그림을 그립니다. ADX는 21.24로 추세 강도가 보통임을 나타냅니다. 4시간 차트에서 RSI는 55.25로 여전히 중립 영역에 있지만 하락 추세에 있습니다. MACD도 긍정적이지만 히스토그램이 좁아지고 있어 강세 모멘텀이 약해지고 있음을 시사합니다. ADX는 20.05로 추세 강도가 보통임을 나타냅니다. 일간 차트에서 RSI는 49.42로 다시 중립 영역에 있는 반면 MACD는 긍정적인 모멘텀을 보여줍니다. ADX는 24.89로 추세 강도가 보통임을 나타냅니다.
기술 지표의 상충되는 신호는 시장의 불확실성을 강조합니다. 모든 시간대에 걸쳐 중립적인 RSI 판독값은 시장이 현재 교착 상태를 깨기 위한 촉매제를 기다리고 있음을 시사합니다. 1시간 및 일간 차트에서 긍정적인 MACD 판독값은 매수자에게 약간의 희망을 제공하지만 4시간 차트에서 히스토그램이 좁아지고 있어 강세 모멘텀이 사라지고 있음을 시사합니다. 모든 시간대에 걸쳐 보통의 ADX 판독값은 추세가 어느 방향으로든 특히 강하지 않음을 나타냅니다. 궁극적으로 기술 지표는 ETHUSD의 미래 방향에 대한 명확성을 거의 제공하지 않습니다. 시장은 현재 교착 상태를 깨기 위한 명확한 촉매제가 나타날 때까지 범위 내에 머물 가능성이 높습니다.
다중 시간대 관점에서 ETHUSD 추세 분석은 해당 페어가 약한 위치에 있음을 보여줍니다. 시간별 차트는 중립 추세를 보여주는 반면 4시간 차트는 하락 추세를 보여줍니다. 일간 차트는 상승 추세를 보여주지만 지표가 혼합되어 강세 모멘텀이 강하지 않음을 시사합니다. 이러한 혼합된 그림은 해당 페어가 단기적으로 범위 내에 머물 가능성이 높음을 시사합니다. 그러나 4시간 차트의 약세 추세는 하락 위험이 상승 잠재력보다 크다는 것을 시사합니다.
거래 권장 사항: 관망
혼합된 신호와 시장의 불확실성을 감안할 때 거래 권장 사항은 관망하는 것입니다. 2079.95달러 위로 일일 마감하면 2132.63달러 저항선을 테스트할 수 있습니다. 반대로 1981.10달러 지지선 아래로 하락하면 상당한 매도세가 촉발될 수 있습니다. 이 시장에서는 인내가 중요합니다. 포지션을 취하기 전에 명확한 신호를 기다리십시오. 위험을 관리하고 항상 스톱로스 주문을 사용하여 자본을 보호하십시오.
자주 묻는 질문: ETHUSD 분석
ETHUSD가 1981.1달러 지지선 아래로 하락하면 어떻게 되나요?
ETHUSD가 1981.1달러 지지선 아래로 하락하면 상당한 매도세가 촉발되어 잠재적으로 1934.93달러 및 1882.25달러 지지선을 테스트할 수 있습니다. 이 시나리오는 약세 추세를 확인하고 추가 하락이 예상된다는 것을 시사합니다.
RSI가 49.42인 현재 수준인 2,049.30달러에서 ETHUSD를 매수해야 할까요?
RSI가 49.42인 ETHUSD는 중립 영역에 있어 강한 매수 또는 매도 압력을 나타내지 않습니다. 현재 가격인 2,049.30달러가 매력적으로 보일 수 있지만 롱 포지션을 취하기 전에 더 명확한 신호를 기다리는 것이 현명합니다. 2079.95달러 저항선 위로 돌파하면 강세 반전을 확인할 수 있습니다.
일간 차트에서 긍정적인 MACD 신호는 ETHUSD에 대한 신뢰할 수 있는 지표인가요?
일간 차트에서 긍정적인 MACD 신호는 강세 모멘텀을 시사하지만 다른 지표와 시간대의 상충되는 신호를 고려하는 것이 중요합니다. 4시간 차트에서 히스토그램이 좁아지고 있어 강세 모멘텀이 약해지고 있으므로 주의가 필요합니다. MACD 신호에만 의존하기 전에 다른 지표에서 확인을 찾으십시오.
3월 9일에 있을 일본은행 정책 발표가 이번 주 ETHUSD에 어떤 영향을 미칠까요?
일본은행 정책 발표가 ETHUSD에 직접적인 영향을 미칠 가능성은 낮지만 더 넓은 시장 심리를 통해 간접적으로 영향을 미칠 수 있습니다. 일본은행 데이터에서 긍정적인 서프라이즈가 발생하면 위험 선호도가 높아져 ETHUSD가 약간 상승할 수 있습니다. 그러나 그 영향은 제한적일 가능성이 높으며 DXY 강세 및 규제 뉴스과 같은 다른 요인이 ETHUSD에 더 큰 영향을 미칠 것입니다.
변동성은 기회를 창출합니다. 준비된 자에게 보상이 따를 것입니다.