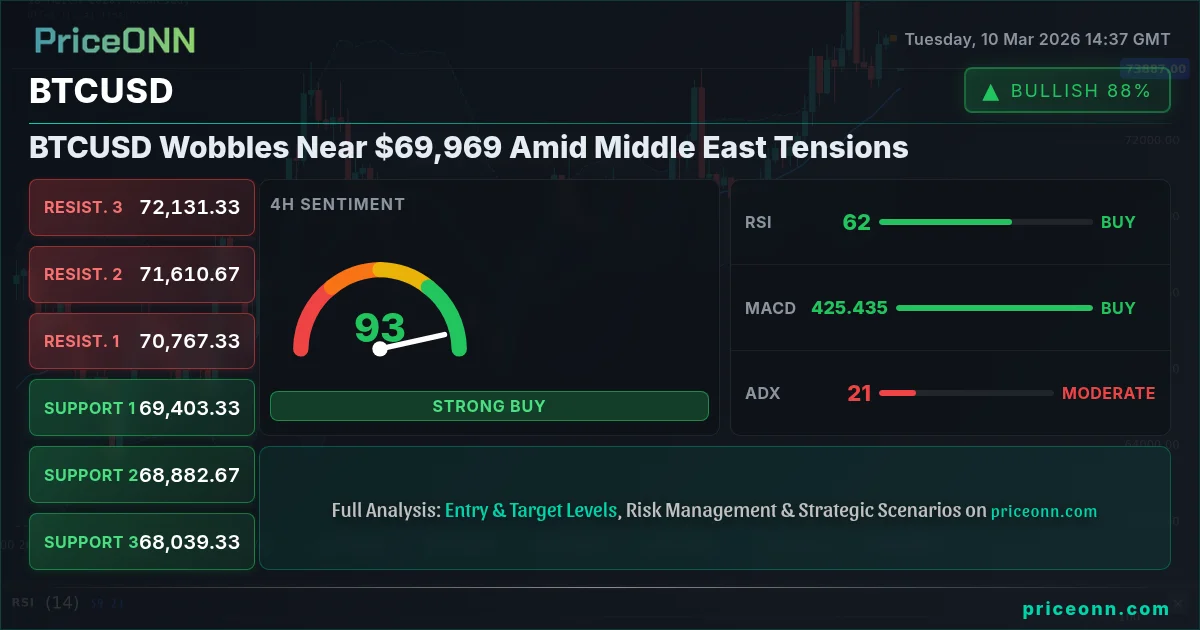
As geopolitical tensions escalate in the Middle East, BTCUSD is exhibiting increased volatility, currently trading near $69,969. The surge in oil prices, as WTI crude oil briefly exceeded $120 per barrel, and a stronger US Dollar Index (DXY) are adding downward pressure on Bitcoin.
- RSI at 55.06 on the 1H chart suggests neutral momentum, but ADX at 44.2 indicates a strong uptrend.
- Key support level to watch is $69,997.33, the 1H support 3 level.
- Stochastic K=45.34, D=74.06 signals a potential short-term pullback.
- Geopolitical instability and a rising DXY are key drivers impacting BTCUSD price action.
Geopolitical Risks and Safe-Haven Demand
The ongoing conflict in the Middle East is injecting uncertainty into global markets. According to Reuters, the escalation of tensions is driving investors towards safe-haven assets. While gold is traditionally seen as the primary beneficiary, the US Dollar is also gaining strength, as reflected in the US Dollar Index (DXY) nearing 99.00. This has a direct impact on BTCUSD, as a stronger dollar typically exerts downward pressure on Bitcoin. With DXY at 98.4, BTCUSD is facing headwinds.
The energy sector is also feeling the strain. WTI crude oil volatility has surged, with prices exceeding $120 per barrel, further fueling inflationary concerns. As noted in recent news, this oil shock is spreading through the global economy. Bitcoin, often touted as an inflation hedge, may struggle to maintain its value in the face of rising energy costs and a strengthening dollar.
Technical Analysis: BTCUSD at a Crossroads
BTCUSD's technical picture presents a mixed bag of signals. On the 1-hour timeframe, the trend is bullish with a strength of 97%, supported by an ADX of 44.2. However, the RSI sits at 55.06, indicating neutral momentum, while the Stochastic (K=45.34, D=74.06) suggests a potential short-term pullback. The immediate resistance to watch is 70,671.33, the 1H resistance 1 level. A break above this level could signal a continuation of the uptrend. The 1H support level of 69,997.33 will be critical to hold.
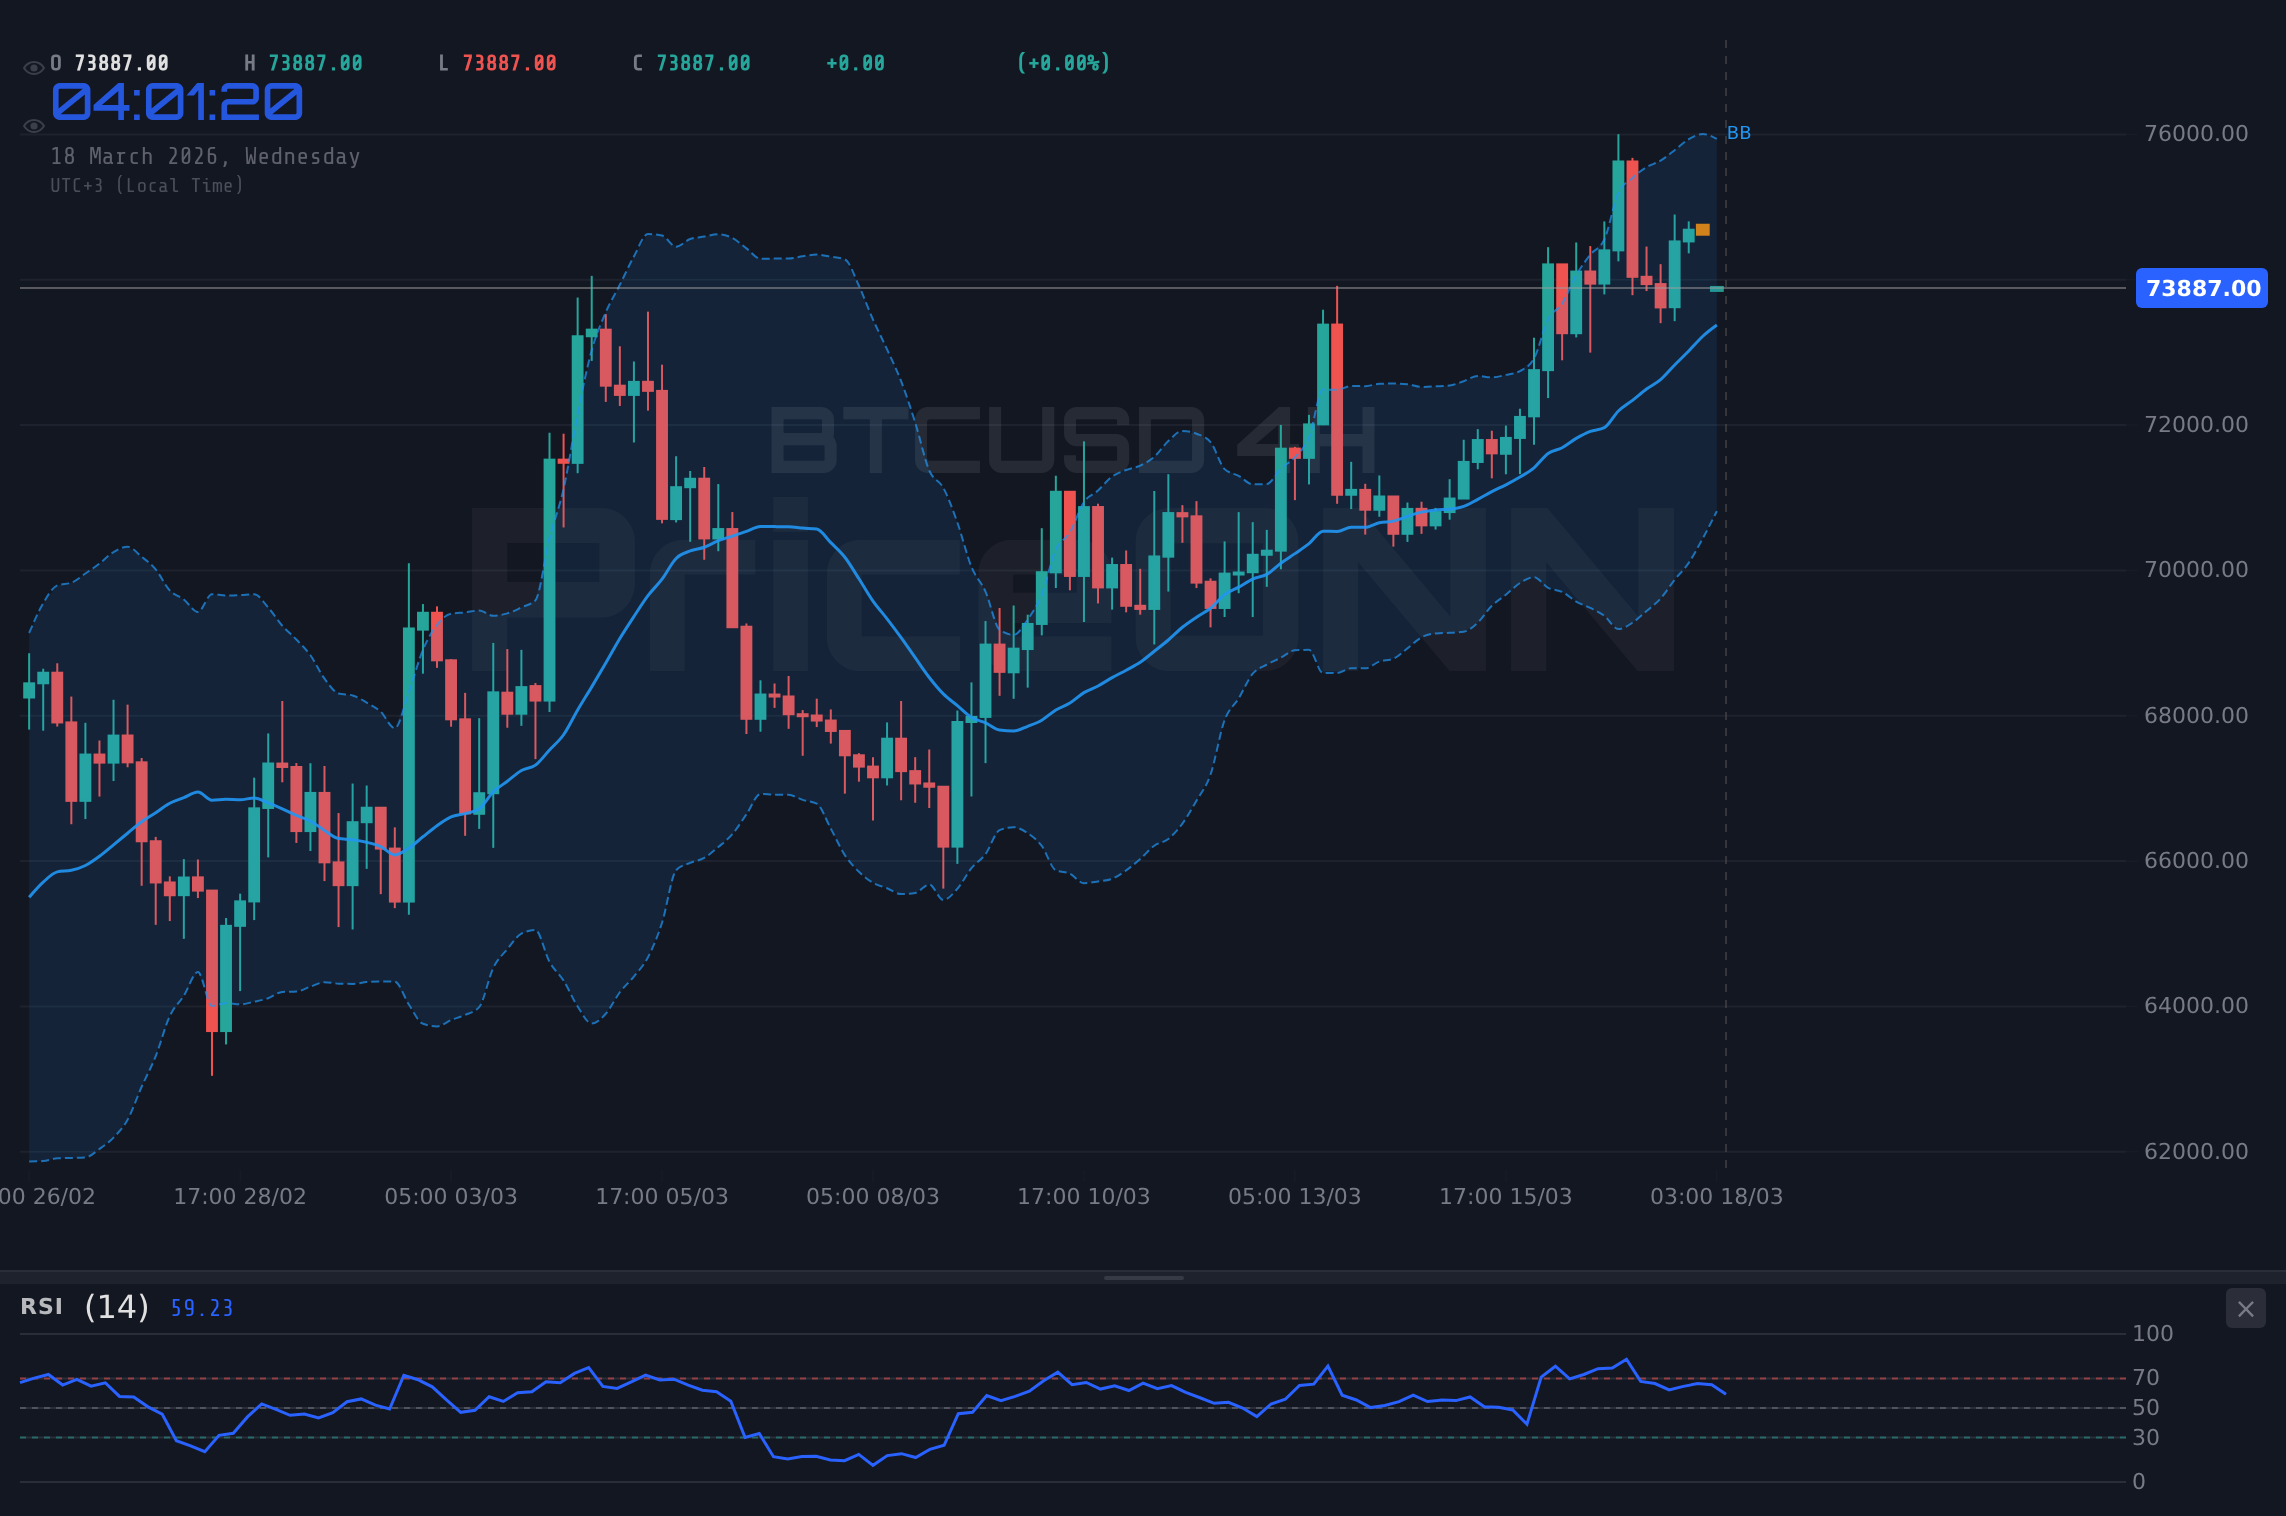
The 4-hour chart paints a slightly different picture. While the trend is neutral, the RSI at 57.65 and the MACD both indicate positive momentum. The Stochastic, however, is in overbought territory (K=86.31, D=86.82), suggesting that the upward momentum may be limited. Key resistance on this timeframe lies at 71,671.
Zooming out to the daily timeframe, the trend is bearish with a strength of 90%. The RSI at 50.68 and the MACD suggest positive momentum, but the Stochastic indicates a potential pullback. The daily resistance to watch is 70,419.67, while support sits at 66,523.67.
On-Chain Metrics and Institutional Adoption
While technical analysis provides valuable insights, it's crucial to consider on-chain metrics and institutional adoption trends. Bitcoin ETF flows continue to be a key driver of price action. Positive ETF inflows can provide significant upward pressure, while outflows can exacerbate downward trends. Monitor these flows closely to gauge market sentiment.
Other on-chain metrics to watch include active addresses and whale movements. A sustained increase in active addresses suggests growing network adoption, which is a bullish signal. Large whale movements, particularly exchange inflows, can often precede significant price declines. Keep an eye on these metrics to identify potential risks.
Economic Calendar and Potential Catalysts
Several upcoming economic data releases could impact BTCUSD price action. The US Dollar Index (DXY) is sensitive to US economic data, so any surprises in the upcoming US data on Tuesday and Wednesday could trigger significant moves in both the dollar and Bitcoin. Specifically, the previous reading was at 3.91. Traders should also keep an eye on any news or announcements related to cryptocurrency regulation, as these can have a significant impact on market sentiment.
According to the economic calendar, the JPY data on Monday came in at -; the previous was 0.1. The EUR data on Wednesday is also something to consider, with the previous being 0.2. The USD data released on Wednesday has a previous reading of 0.2, 2.4, and 0.3. These data points could impact market sentiment and influence BTCUSD price action.
BTCUSD Trade Recommendation
Given the conflicting technical signals and the prevailing geopolitical uncertainty, a clear trade setup is not currently evident. It's best to remain in a watch zone for now. However, a daily close above 71,000 would open the door for a test of the 71,671 resistance level. Conversely, a break below the 1H support level of 69,997.33 could signal a move towards the 66,523.67 support.
Scenario Cards
If BTCUSD breaks and holds above 70,671, the next target is 71,671. A sustained move above this level could trigger a rally towards 72,260.
If BTCUSD breaks below 69,997.33, the next target is 66,523.67. A breakdown below this level could trigger a sell-off towards 64,124.33.
Frequently Asked Questions: BTCUSD Analysis
What happens if BTCUSD breaks above $70,671 resistance?
If BTCUSD breaks above the 1H resistance level of $70,671, it could signal a continuation of the uptrend, potentially leading to a test of the next resistance level at $71,671.
Should I buy BTCUSD at current $69,969 levels given RSI at 55.06?
Given the neutral RSI of 55.06 on the 1H chart and the conflicting signals from other indicators, it's best to remain cautious. A clear buy signal would require a breakout above $70,671 with confirmation from other indicators.
Is RSI at 55.06 a sell signal for BTCUSD right now?
An RSI of 55.06 is not a strong sell signal. It indicates neutral momentum, suggesting that the market is in a state of equilibrium. A stronger sell signal would require the RSI to move into overbought territory and show signs of divergence.
How will the upcoming USD data on Wednesday affect BTCUSD this week?
The upcoming USD data on Wednesday could significantly impact BTCUSD. Stronger-than-expected data could strengthen the US Dollar, putting downward pressure on Bitcoin. Conversely, weaker-than-expected data could weaken the dollar and provide support for Bitcoin.
Key Levels
Key Levels
Support Levels
Resistance Levels
Track markets in real-time
AI-powered analysis, technical indicators and real-time price data.
Join Our Telegram Channel
Breaking market news, AI analysis and trading signals instantly.
Join Channel