Dow Jones Wobbles Near $47325.5 Amid Fed Chatter, Oil Surge
The Dow Jones Industrial Average is hovering around $47,325.5 amid hawkish Fed comments and surging oil prices, creating uncertainty for investors.
The Dow Jones Industrial Average is facing headwinds as energy prices surge past $85 a barrel and Fed officials hint at persistent inflation. Is this a temporary pullback or the start of a deeper correction? The answer may hinge on upcoming economic data and geopolitical developments.
- Dow Jones volatility analysis points to a potential breakout, with key resistance at 47,614.33.
- Critical support sits at 47,214.33, tested multiple times in the last few hours.
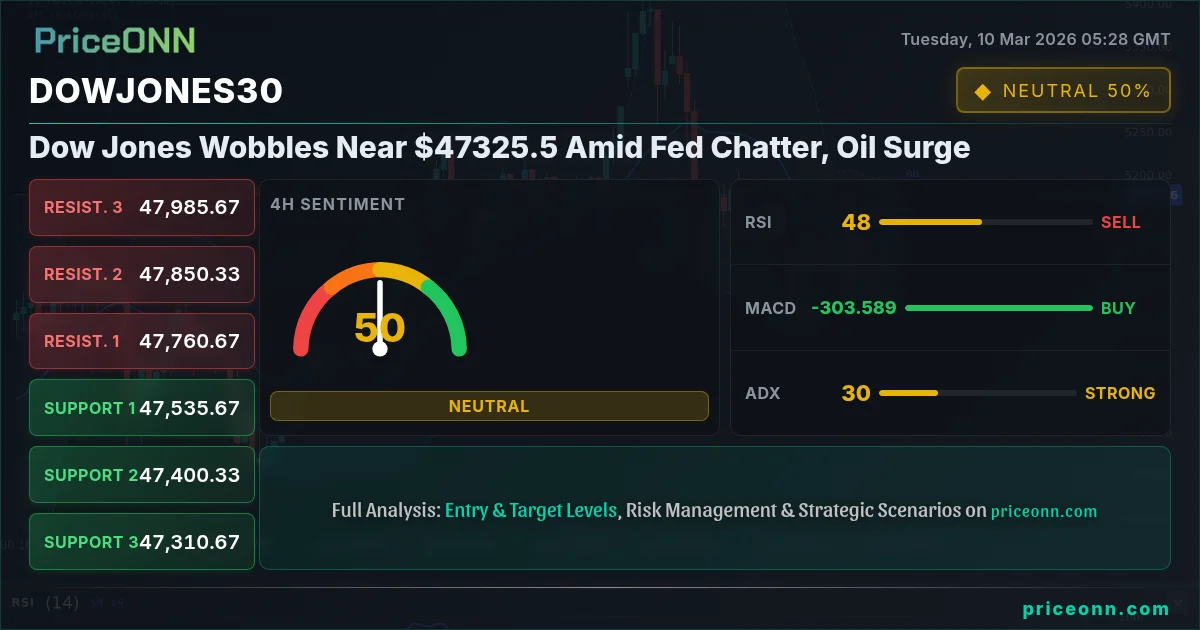
- MACD histogram shows negative momentum, suggesting bearish sentiment is gaining traction.
- Fed rate expectations and rising oil prices are driving Dow Jones correlation with the DXY.
Several factors are weighing on the Dow Jones this week. First, rising crude oil prices, fueled by Middle East tensions, are stoking inflation fears. Crude oil near $85 a barrel raises concerns that central banks might need to maintain higher interest rates for longer, potentially slowing economic growth. Second, recent comments from Federal Reserve officials suggest a cautious approach to monetary policy, with some emphasizing that inflation remains "sticky." This has tempered expectations of aggressive rate cuts, further pressuring the Dow. Finally, ongoing geopolitical uncertainty adds another layer of complexity, driving risk aversion and safe-haven demand.
Hawkish Fed Signals Add to Market Jitters
The Federal Reserve's stance remains a key driver of market sentiment. Recent comments from Fed officials have introduced uncertainty about the pace and magnitude of future rate cuts. While the market had initially priced in a series of aggressive rate reductions, the Fed's message has been more measured, emphasizing a data-dependent approach. As Reuters reported, "Fed officials have emphasized that inflation remains 'sticky'." This hawkish tone has dampened investor enthusiasm and contributed to the recent pullback in the Dow Jones.
Oil Volatility and Inflation Concerns
The surge in oil prices is another significant headwind for the Dow Jones. Escalating tensions in the Middle East have disrupted supply chains, leading to a sharp increase in crude oil prices. WTI crude oil is experiencing a significant rally. According to Qatar's Energy Minister, WTI crude oil is experiencing a significant rally, driven by geopolitical tensions and a forecast. As oil prices rise, inflationary pressures intensify, potentially forcing the Fed to maintain a tighter monetary policy. This creates a challenging environment for equities, as higher interest rates can weigh on corporate earnings and economic growth. With Brent at $65.73, the market is closely watching for any signs of further escalation in the Middle East, which could send oil prices even higher.
Dow Jones Price Prediction This Week: Technical Outlook
From a technical perspective, the Dow Jones is currently trading at $47,325.5. The 1-hour chart shows a strong bearish trend, with the ADX at 38.89 indicating significant downward momentum. The RSI at 34.51 suggests oversold conditions, which could lead to a short-term bounce. However, the MACD histogram shows negative momentum, confirming the bearish sentiment. Key support levels to watch are 47,214.33 and 47,107.67. On the upside, resistance lies at 47,507.67 and 47,614.33. A break above 47,614.33 could signal a potential reversal, while a sustained move below 47,214.33 could pave the way for further downside.
Multi-Timeframe Analysis of Dow Jones
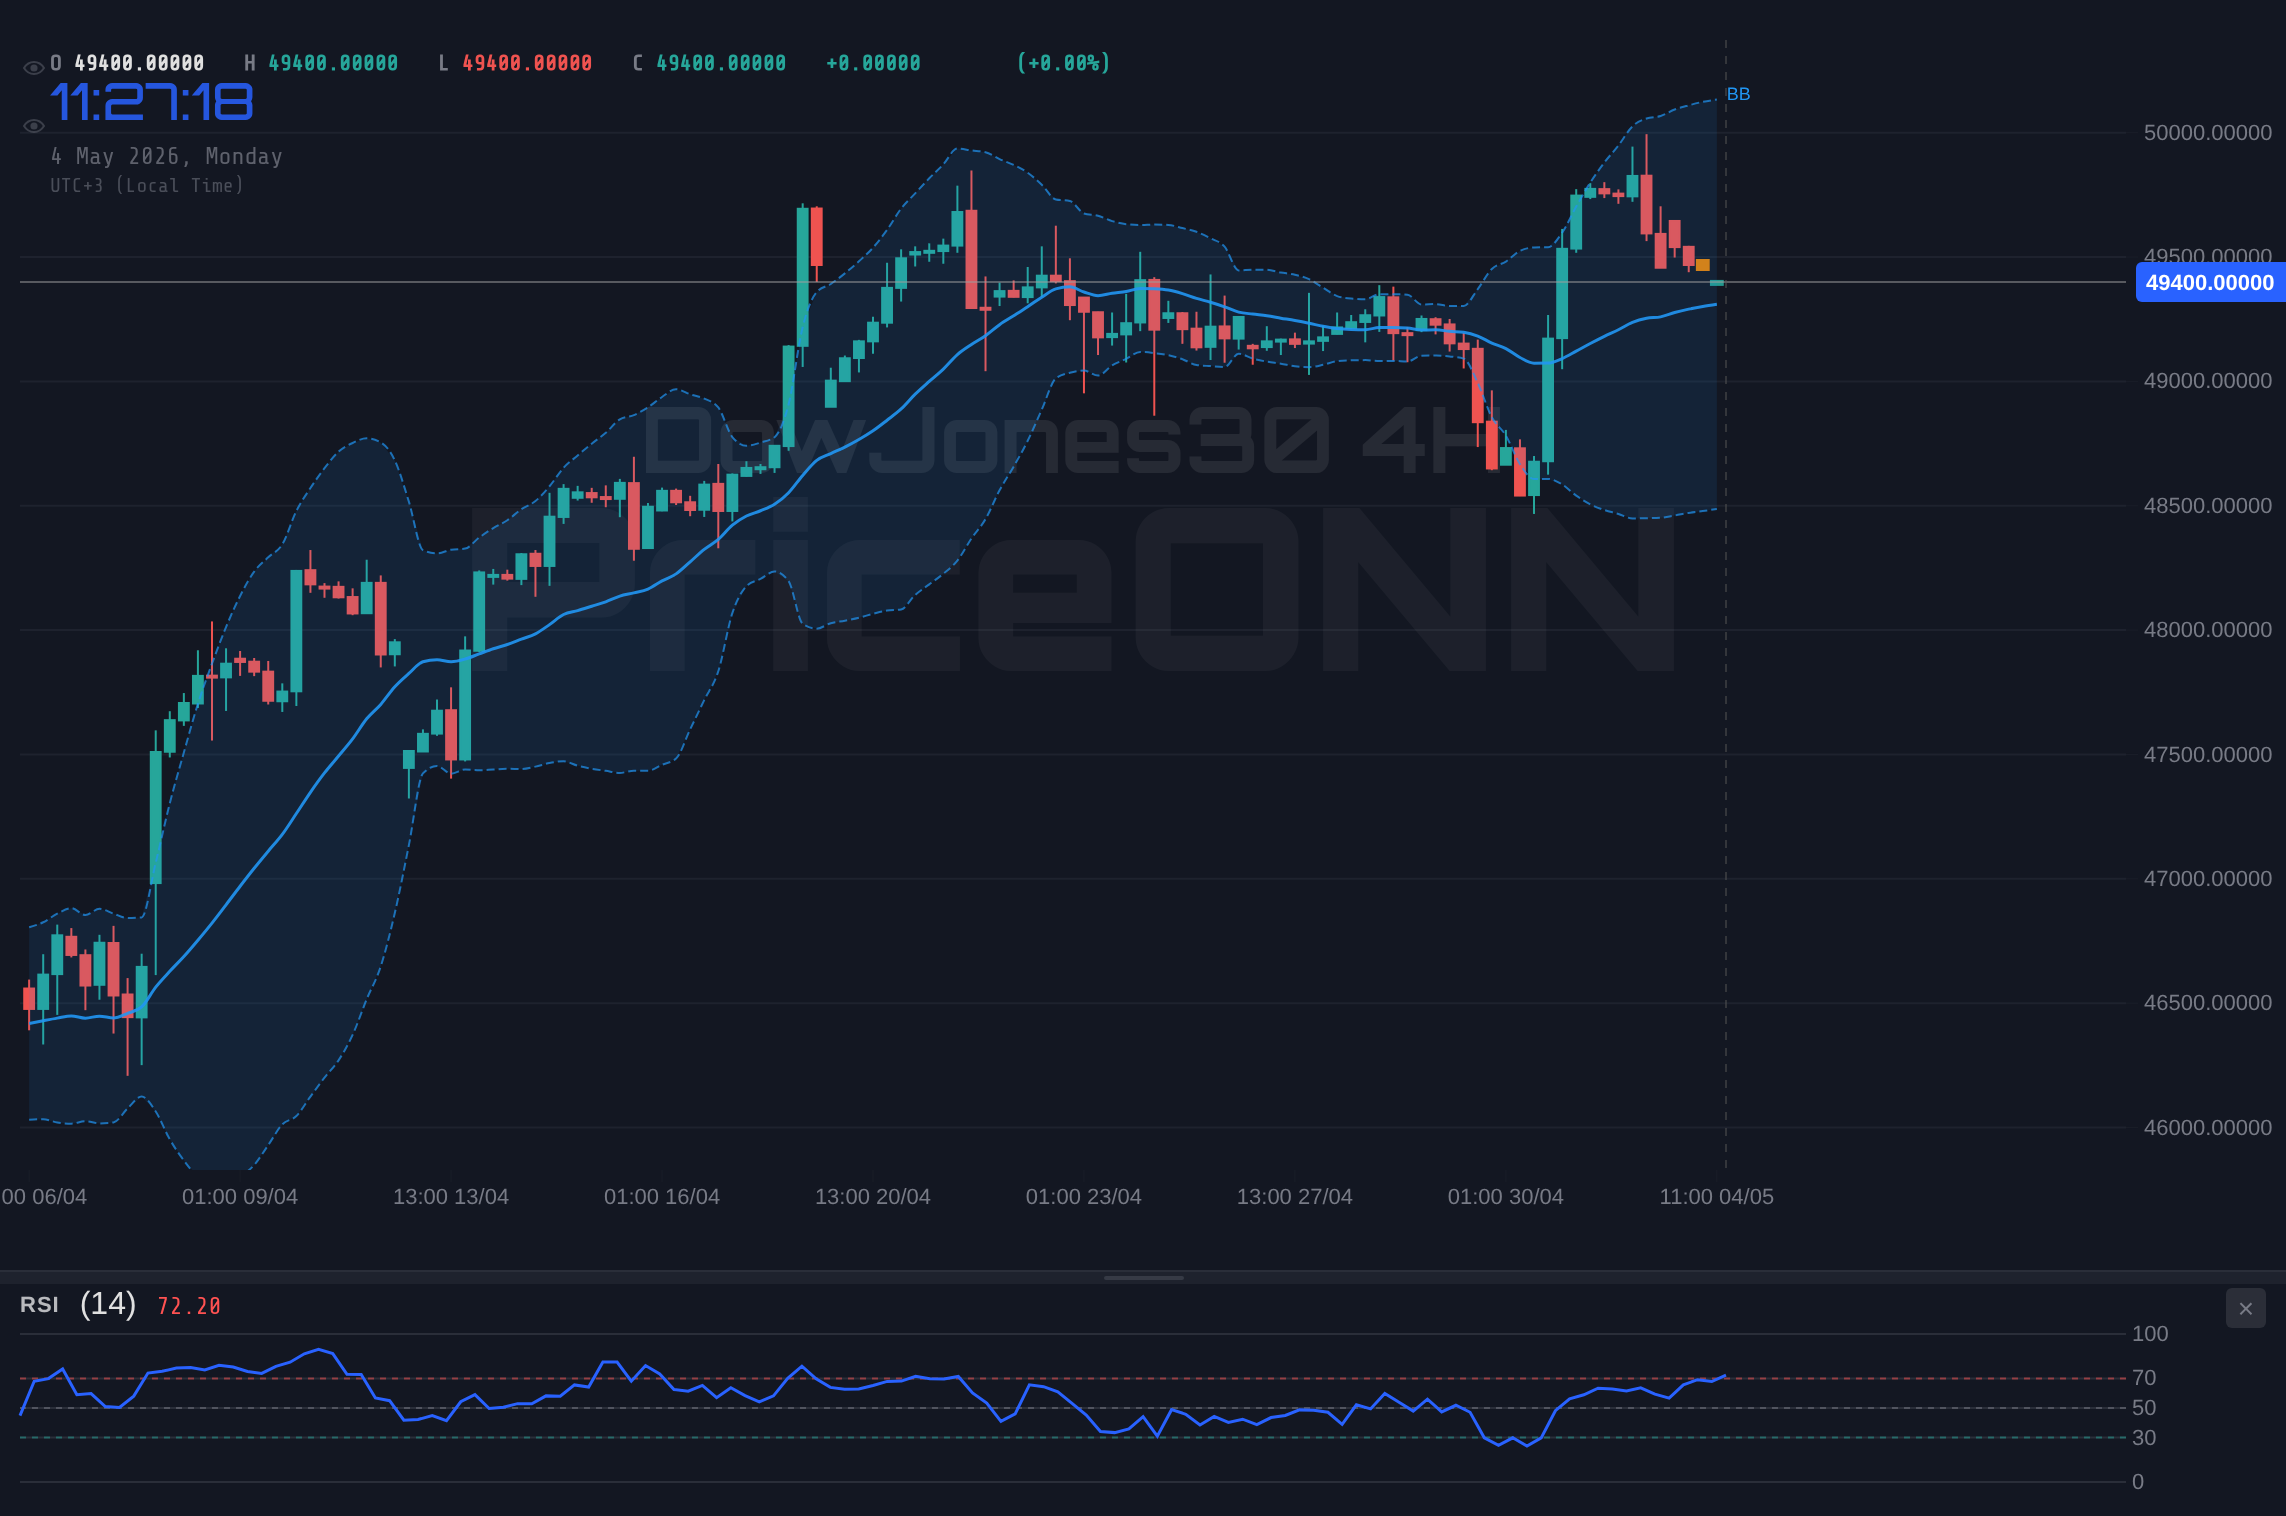
A multi-timeframe analysis provides a more nuanced view of the Dow Jones's technical condition. On the 4-hour chart, the trend remains bearish, with the ADX at 26.11. The RSI at 30.65 is nearing oversold territory, while the Stochastic oscillator is at 12.42, indicating deeply oversold conditions. The MACD histogram continues to show negative momentum. Key support levels on this timeframe are 47,051.33 and 46,821.67. Resistance lies at 47,694.33 and 48,107.67. On the daily chart, the trend is neutral, but indicators are leaning bearish. The RSI at 31.89 is approaching oversold territory, and the MACD histogram is negative. Key support levels on the daily chart are 47,344.33 and 46,810.67. Resistance lies at 48,618.33 and 49,358.67.
Potential Breakout Scenarios for Dow Jones
Several potential breakout scenarios could play out in the coming days. A bullish breakout would require a sustained move above 47,614.33, which could open the door for a retest of the 48,000 level. This scenario would likely be driven by positive economic data or a dovish shift in Fed policy. A bearish breakout, on the other hand, would require a sustained move below 47,214.33, which could lead to a test of the 47,000 level. This scenario would likely be triggered by further escalation in the Middle East or disappointing economic data.
Market Sentiment Analysis and Dow Jones
Market sentiment plays a crucial role in driving short-term price movements. Currently, sentiment appears to be cautious, with investors wary of rising oil prices and hawkish Fed signals. However, oversold conditions on the short-term charts suggest that a bounce could be in the cards. A sustained move above 47,507.67 could help to improve sentiment and pave the way for further upside. On the other hand, a break below 47,214.33 could exacerbate bearish sentiment and lead to further declines.
Trading Signals and Key Levels for Dow Jones
For short-term traders, the key levels to watch are 47,507.67 on the upside and 47,214.33 on the downside. A break above 47,507.67 could be a signal to go long, while a break below 47,214.33 could be a signal to go short. Swing traders may want to wait for a more sustained move above 47,614.33 or below 47,051.33 before taking a position. Long-term investors may view the current pullback as an opportunity to accumulate shares at lower prices, but should be mindful of the risks associated with rising oil prices and hawkish Fed signals. The ADX at 19.03 suggests that the current trend is weak, but the RSI at 30.65 suggests that the market is oversold, which could lead to a short-term bounce.
AI Technical Analysis and Dow Jones
AI-powered technical analysis tools can provide valuable insights for traders. Chart pattern recognition algorithms can identify potential breakout patterns, while multi-timeframe analysis tools can provide a more comprehensive view of the market. Breakout scanners can help to identify potential trading opportunities, and key level alerts can help traders to stay informed about important price levels. However, it's important to remember that AI-powered tools are not foolproof and should be used in conjunction with other forms of analysis.
The Impact of News on Dow Jones
News events can have a significant impact on the Dow Jones. For example, a positive economic data release could boost sentiment and drive prices higher, while a negative news event could trigger a selloff. Traders should stay informed about upcoming economic data releases and geopolitical developments, and be prepared to adjust their positions accordingly. Reuters' coverage of Fed officials' concerns about sticky inflation, and Bloomberg's reporting on rising oil prices, are examples of news events that could impact the Dow Jones.
Dow Jones Risk Assessment
Investing in the Dow Jones involves risks. The market can be volatile, and prices can move quickly and unexpectedly. Traders should always use stop-loss orders to limit their potential losses, and should never invest more than they can afford to lose. Risk management is crucial for navigating the choppy waters. With disciplined risk management, these choppy waters can be navigated safely.
Frequently Asked Questions: DowJones30 Analysis
Is DowJones30 a good buy right now?
DowJones30 is approaching oversold conditions with an RSI of 30.65 on the 4H chart, suggesting potential for a bounce. However, a sustained break below 47,214.33 could lead to further declines, so caution is warranted.
What is the DowJones30 price forecast for this week?
The Dow Jones price forecast for this week is mixed. A bullish scenario targets 48,000 if 47,614.33 is breached, while a bearish scenario targets 47,000 if 47,214.33 is broken.
What are the key support and resistance levels for DowJones30?
Key support levels for DowJones30 are at 47,214.33 and 47,051.33, while key resistance levels are at 47,507.67 and 47,614.33, based on the current market data.
Why is DowJones30 moving today?
DowJones30 is moving lower today due to rising oil prices and hawkish comments from Fed officials, increasing concerns about inflation and future interest rate hikes.
Track markets in real-time
AI-powered analysis, technical indicators and real-time price data.
Join Our Telegram Channel
Breaking market news, AI analysis and trading signals instantly.
Join Channel