

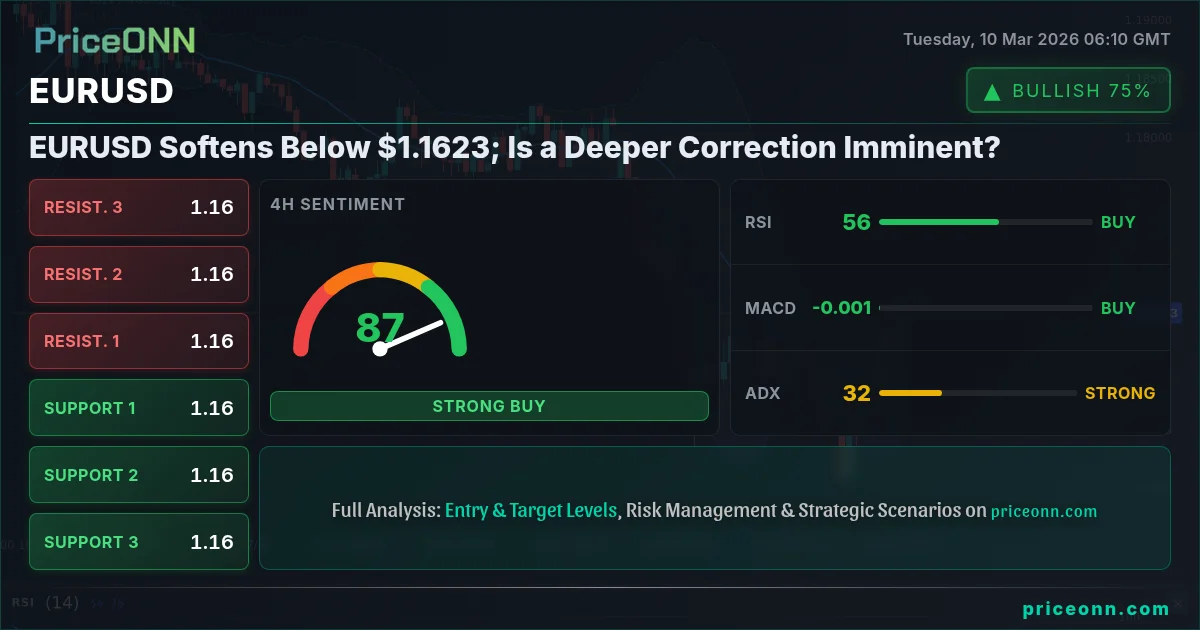
EURUSD, currently trading at $1.16232, is facing downward pressure as Middle East turmoil strengthens the US Dollar. The pair has softened, raising questions about whether a deeper correction is on the horizon. Several factors, including technical indicators and macroeconomic data, point to potential bearish scenarios.
- RSI at 36.59 on the daily timeframe signals potential oversold conditions, yet bearish momentum remains.
- Key support lies at 1.15488, a break below which could trigger further declines.
- MACD histogram shows negative momentum, indicating continued selling pressure.
- DXY strength, currently at 98.55, is a major driver of EURUSD weakness amid geopolitical tensions.
The EURUSD pair's current trajectory is influenced significantly by the strength of the US Dollar Index (DXY), which stands at 98.55. As the DXY rises, it typically puts downward pressure on EURUSD. According to recent news, escalating Middle East tensions are boosting the US Dollar, further exacerbating the challenges for the EURUSD pair. The broader risk-off sentiment is also contributing to the dollar's strength, as investors seek safe-haven assets. The EURUSD's daily change is currently at -0.1% (-0.0012), reflecting the ongoing bearish sentiment.
From a technical perspective, the daily chart provides a clear bearish outlook. The Relative Strength Index (RSI) is at 36.59, indicating that while the pair isn't yet oversold, the bearish momentum is strong. The Moving Average Convergence Divergence (MACD) histogram is showing negative momentum, reinforcing the selling pressure. The EURUSD is trading below its middle Bollinger Band, suggesting a continuation of the downtrend. Key support levels to watch are 1.15488, 1.14624, and 1.14186. A break below 1.15488 could trigger a further decline towards the 1.14624 level.
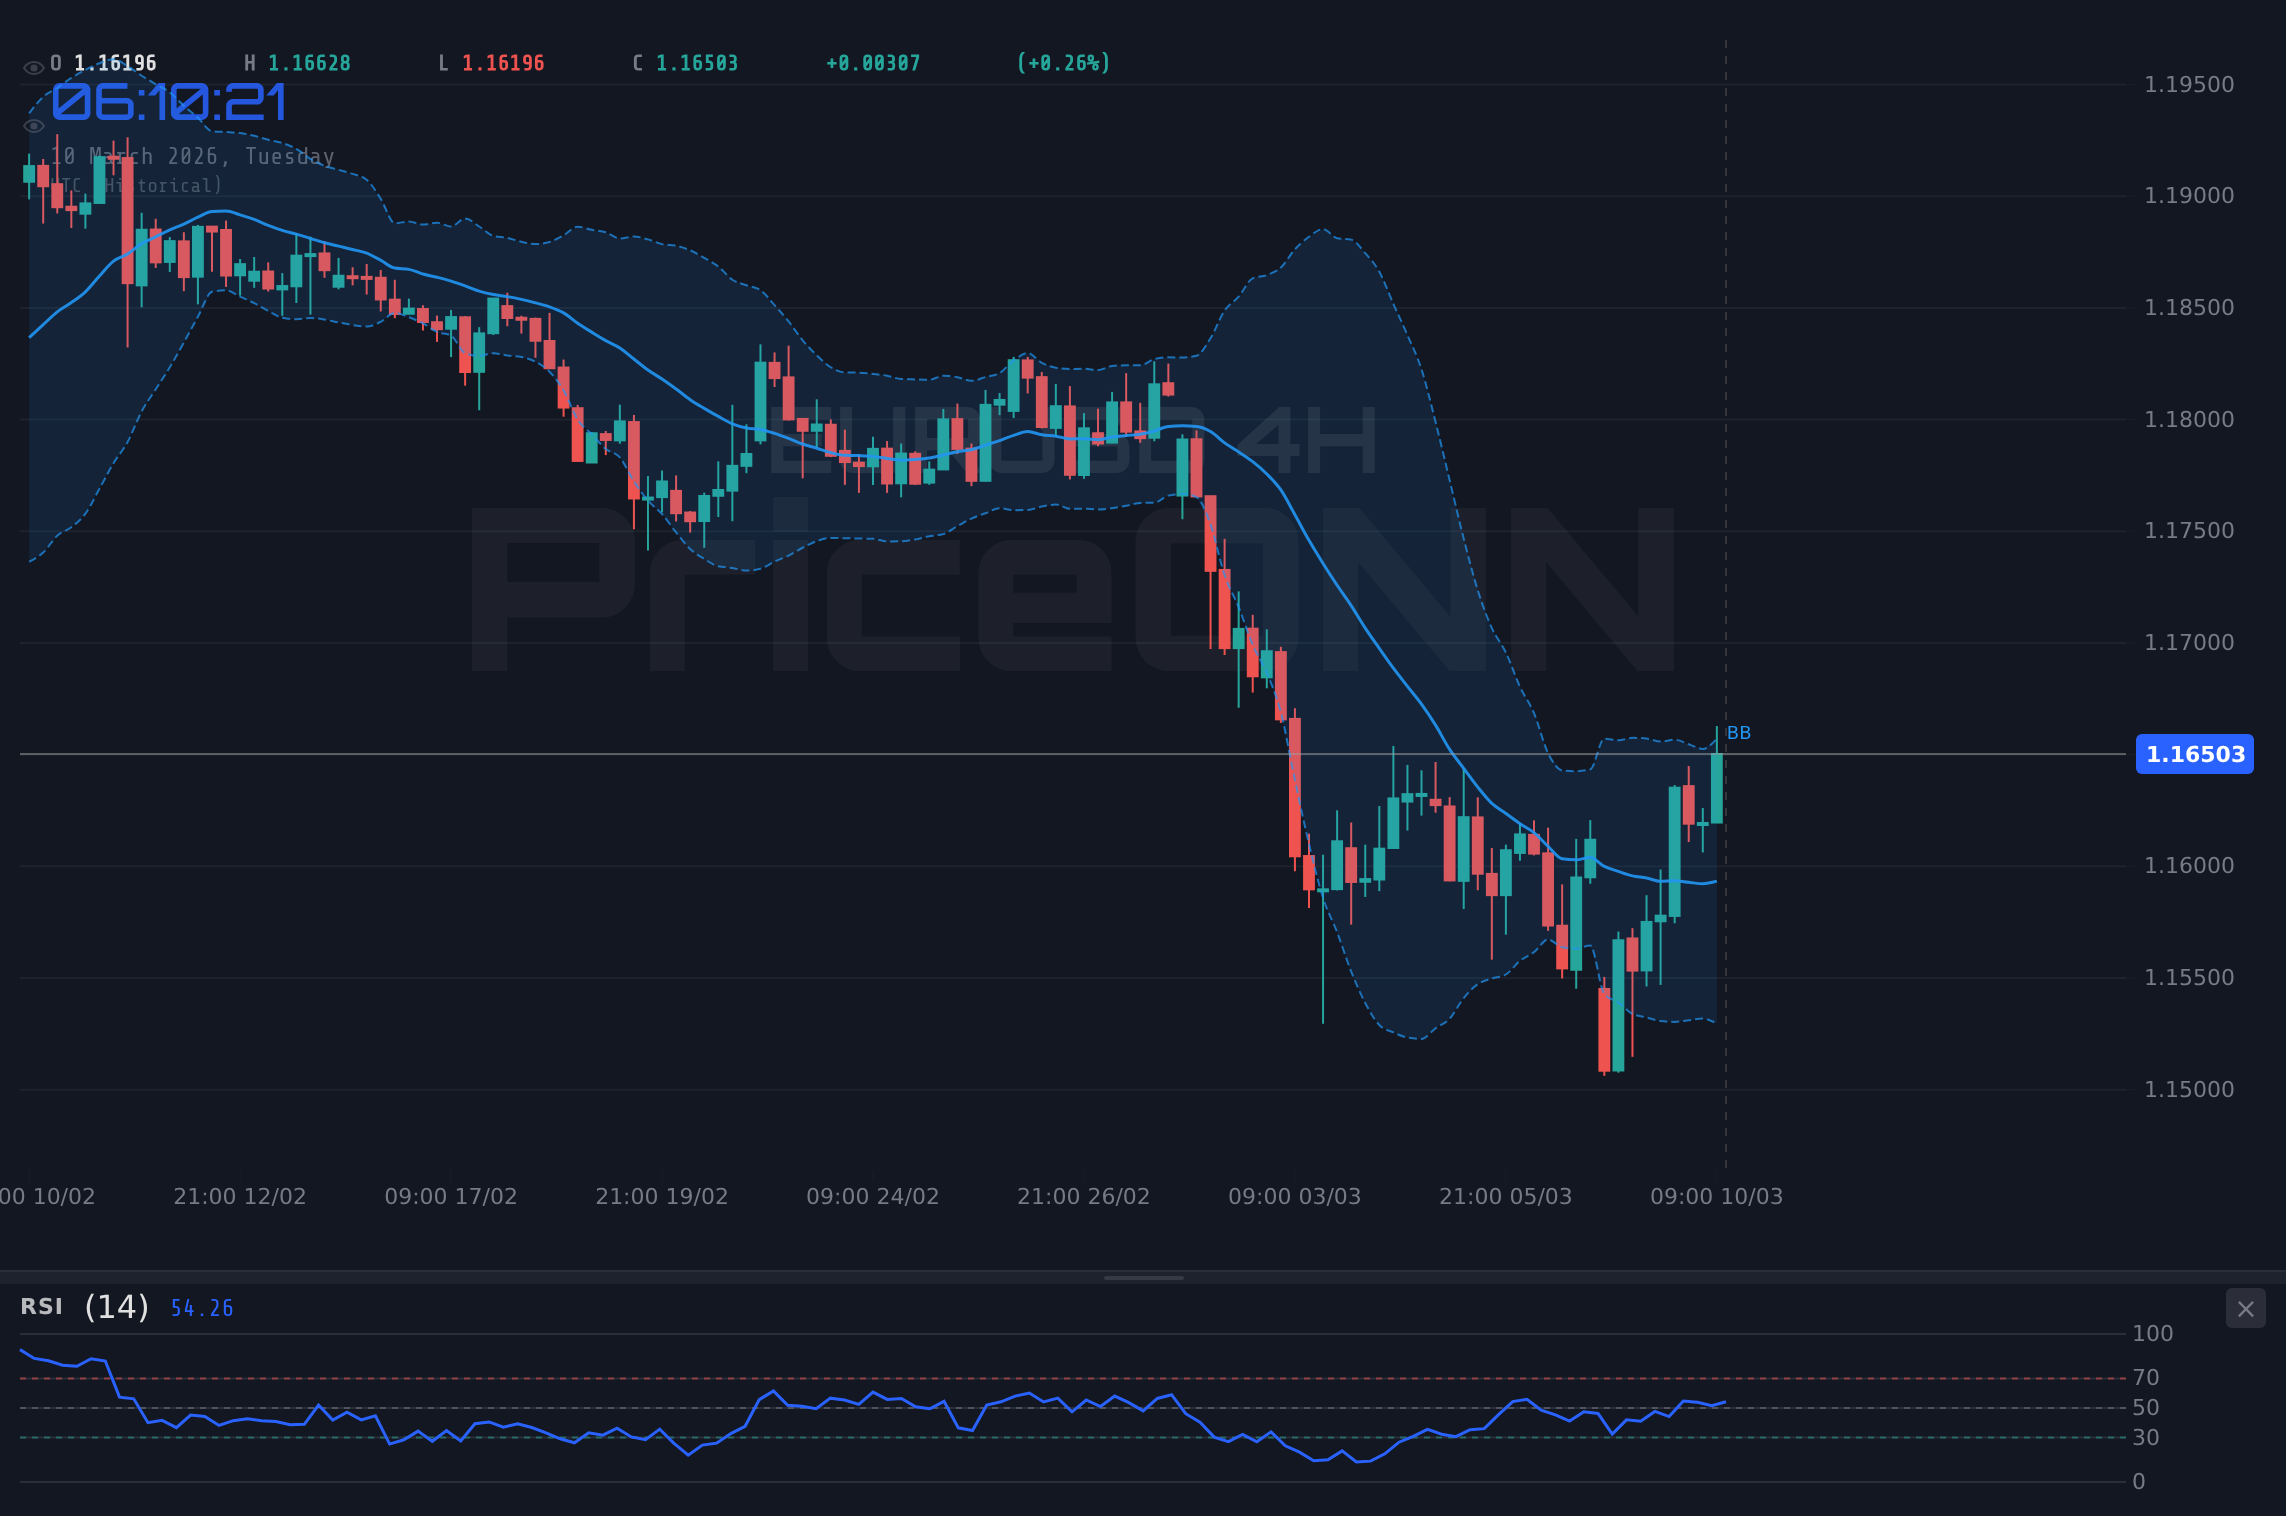
On the 4-hour timeframe, the EURUSD is attempting a minor recovery. The RSI stands at 51.15, hovering in neutral territory, suggesting a potential pause in the selling pressure. However, the MACD histogram remains positive, indicating that bullish momentum is still present. The Stochastic oscillator, with K=87.36 and D=63.42, shows a bullish signal, but this may be a temporary reprieve. The ADX, at 33.79, indicates a strong downtrend, suggesting that the overall bearish bias remains intact. Resistance levels to monitor include 1.1639, 1.1659, and 1.1673. Failing to break above 1.1639 could signal a continuation of the downtrend.
Shorter-term analysis on the 1-hour timeframe reveals a mixed picture. The RSI is at 58.45, indicating neutral conditions. The MACD histogram is positive, suggesting upward momentum. However, the Stochastic oscillator, with K=31.88 and D=54.37, signals a bearish crossover, indicating potential downside pressure. The ADX, at 23.84, reflects a moderate uptrend, which could be a short-term correction within the broader downtrend. Support levels to watch are 1.1607, 1.16029, and 1.15996. Resistance is found at 1.16144, 1.16177, and 1.16218.
Macroeconomic factors are also playing a significant role. All eyes are on the upcoming economic data releases this week. Specifically, the EUR data on Wednesday, March 11th, will provide insights into the Eurozone's economic health. Similarly, USD data releases on the same day, including , will influence the dollar's trajectory. Stronger-than-expected USD data could further strengthen the dollar, putting additional pressure on EURUSD. Investors are also anticipating GBP data on Friday, March 13th, which could impact broader market sentiment.
The "eurusd macroeconomic factors march 2026" are critical to analyze. The recent volatility in WTI crude oil, briefly exceeding $120 per barrel due to geopolitical tensions, adds inflationary pressures. This could influence central bank policies, particularly the Federal Reserve's stance on interest rates. Higher inflation could prompt the Fed to maintain a hawkish stance, further supporting the US Dollar and weighing on EURUSD. Reuters has reported that Fed officials are concerned about "stubborn" inflation, suggesting a cautious approach to monetary policy.
From a trading perspective, the current technical setup doesn't offer a clear directional bias. The overall trend remains bearish, but short-term indicators suggest a potential for a minor recovery. A daily close below 1.15488 would open the door for a test of 1.14624, while a break above 1.1639 could lead to a retest of 1.1659. Scalpers might look for short-term opportunities based on intraday price action, while swing traders might wait for a more decisive break of key levels before committing to a position.
The correlation between EURUSD and DXY is particularly noteworthy. With DXY at 98.55, EURUSD is under pressure. Traders should monitor DXY's movement closely, as further gains could trigger a sharper decline in EURUSD. Additionally, keep an eye on the SP500 and Nasdaq indices; a significant downturn in these risk assets could further fuel safe-haven demand, benefiting the US Dollar.
Having tracked EURUSD through various economic cycles, it's evident that geopolitical tensions and macroeconomic data releases act as significant catalysts. The current market sentiment is risk-averse, favoring safe-haven currencies like the US Dollar. The key levels to watch are the support at 1.15488 and resistance at 1.1639. A decisive break of either level will likely dictate the short-term direction of the pair. Historically, when the RSI reaches current levels on the daily timeframe, a trend reversal is often preceded by a period of consolidation. Patient investors will wait for confirmation before acting decisively.
The ADX at 28.17 on the daily timeframe indicates a strong downtrend, but this signal should be interpreted with caution. The Stochastic oscillator, with K=34.64 and D=29.64, shows a potential bullish crossover, which could lead to a temporary retracement. The key is to wait for confirmation from other indicators and price action before making a trade decision. Manage your risk, wait for your setup- the market always gives a second chance. The "eurusd forecast australian financial review march 2026" will likely reflect these dynamics, emphasizing the importance of data-driven analysis.
Frequently Asked Questions: EURUSD Analysis
What happens if EURUSD breaks below 1.15488 support?
If EURUSD breaks below the 1.15488 support level, it could trigger a further decline towards 1.14624 and potentially 1.14186. This scenario would likely be driven by continued strength in the US Dollar and a risk-off market sentiment.
Should I sell EURUSD at current $1.1623 levels given RSI at 36.59?
While the RSI at 36.59 suggests potential oversold conditions, it's not a definitive sell signal. The overall trend remains bearish, and negative momentum persists. A more conservative approach would be to wait for a confirmed break below 1.15488 before initiating a short position.
Is the MACD signal on the daily chart reliable for EURUSD trend analysis?
The MACD histogram on the daily chart shows negative momentum, which aligns with the bearish trend. However, it's essential to consider other factors, such as support and resistance levels, before making a trading decision. The MACD signal should be used in conjunction with other indicators for a more comprehensive analysis.
How will the upcoming USD data on March 11th affect EURUSD this week?
Stronger-than-expected USD data on March 11th could further strengthen the US Dollar, putting additional downward pressure on EURUSD. Conversely, weaker-than-expected data could provide a temporary boost to the pair, but the overall bearish bias would likely remain intact.
Technical Outlook Summary
| Indicator | Value | Signal |
|---|---|---|
| RSI (14) | 36.59 | Bearish |
| MACD Histogram | Negative Momentum | Bearish |
| Stochastic | K=34.64, D=29.64 | Bullish Crossover |
| ADX | 28.17 | Strong Downtrend |
| Bollinger | Middle Band | Below |
Key Levels
Support Levels
Resistance Levels
Track markets in real-time
AI-powered analysis, technical indicators and real-time price data.
Join Our Telegram Channel
Breaking market news, AI analysis and trading signals instantly.
Join Channel