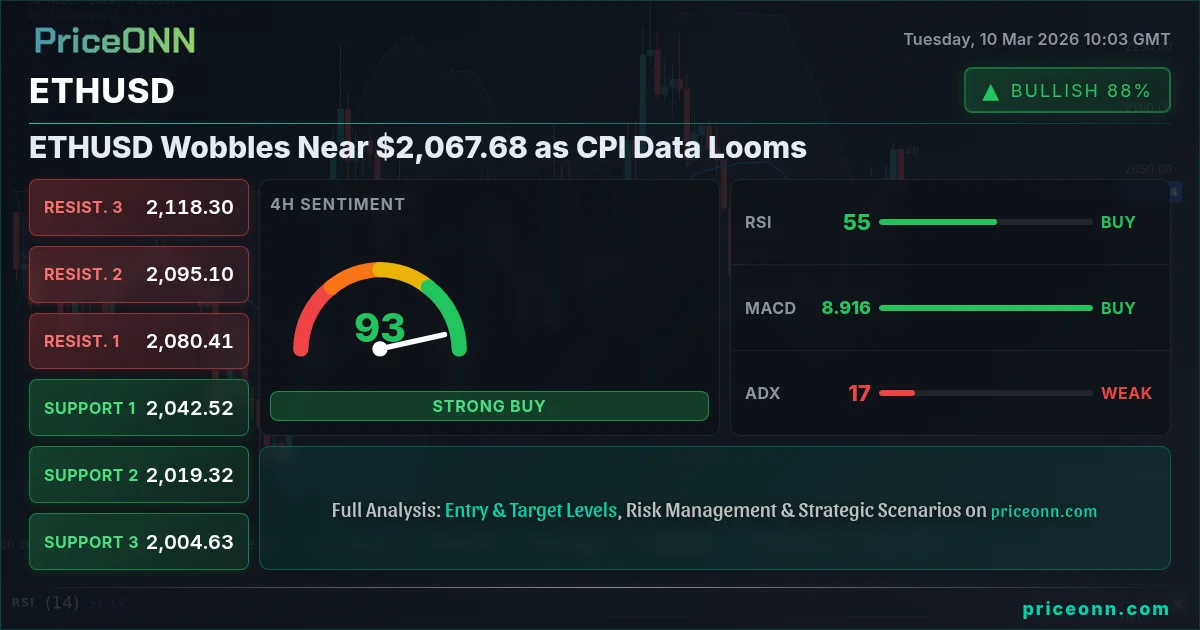
The battle between ETHUSD bulls and bears is intensifying around the $2,067.68 level, a crucial juncture that could dictate the short-term trajectory of the cryptocurrency. With significant economic data releases on the horizon, including the US CPI and home sales figures, the market is bracing for potential volatility.
- ETHUSD hovers near $2,067.68, a critical level determining near-term direction.
- RSI at 67.74 on the 1H chart suggests potential overbought conditions, warranting caution.
- Key support lies at $2,046.32, a breach of which could trigger a bearish move.
- Upcoming US CPI data on Wednesday is expected to significantly influence ETHUSD's correlation with the DXY.
The immediate question is: which way will ETHUSD break? The answer depends on a confluence of technical factors, macroeconomic data, and overall market sentiment. Let's delve into the bull and bear cases to understand the potential scenarios.
The Bull Case for ETHUSD
Optimists believe that ETHUSD is poised for a breakout above the immediate resistance level of $2,076.69, potentially targeting $2,085.02 in the short term. Several factors support this bullish outlook. First, the 1-hour chart indicates a strong uptrend with a strength of 97%. This suggests that the buying pressure is significant, and any pullback could be temporary. The MACD on the 1-hour chart also supports this view, showing positive momentum and trading above the signal line. This indicates that the bullish trend is likely to continue.
Furthermore, the overall signal for ETHUSD across multiple timeframes is predominantly bullish. According to the current market data, the general signal on the 1H, 4H and 1D timeframes is “AL”. The positive sentiment coincides with an overall risk-on environment in the market, with the SP500 currently trading at 6814.55, up 0.4% on the day. If risk appetite continues to increase, ETHUSD could benefit from increased investor interest.
Another factor supporting the bullish case is the recent performance of Bitcoin. As the leading cryptocurrency, Bitcoin often sets the tone for the broader crypto market. With BTCUSD currently trading at $71,085 and showing strong upward momentum, ETHUSD is likely to ride the coattails of Bitcoin's success. The 1H trend strength for BTCUSD is 100%, implying a powerful move.
Scalpers should watch for a break above $2,076.69 on the 1H timeframe, targeting $2,085.02. A stop-loss order should be placed just below the $2,046.32 support level. Swing traders should consider entering a long position on a retest of the $2,046.32 support, targeting the $2,085.02 resistance. Long-term investors should monitor the overall trend and consider adding to their positions on pullbacks, focusing on key support levels such as $1,938.61 on the daily chart.
The Bear Case for ETHUSD
Conversely, the bear case suggests that ETHUSD is vulnerable to a breakdown below the $2,046.32 support level, potentially leading to a decline towards $2,037.99 and even $2,026.97. Several factors contribute to this bearish scenario. The Stochastic indicator on the 1H chart is showing an overbought condition with K=87.91 and D=81.96. This suggests that the recent rally may be overextended, and a pullback is imminent. The RSI on the 1H chart is at 67.74, also suggesting that the market is approaching overbought levels.
Moreover, the ADX on the 1H chart is at 33.73, indicating a strong uptrend. However, this could also mean that the trend is maturing, and a reversal is possible. Traders should be wary of a potential trend reversal, especially if the upcoming economic data fails to support the current bullish momentum.
The EURUSD pair is currently trading at 1.16513, showing a slightly positive daily change of 0.14%. While this may seem positive, the daily trend for EURUSD is strongly bearish, with a trend strength of 89%. If the dollar continues to strengthen, ETHUSD could face downward pressure. The DXY is currently showing a neutral trend on the 1H, 4H and 1D timeframes, so it does not provide any clear indication of future direction.
Furthermore, the upcoming US CPI data on Wednesday is a major risk event. If the CPI comes in higher than expected, it could trigger a sharp increase in interest rate expectations, leading to a stronger dollar and a decline in ETHUSD. The US home sales data, also due on Wednesday, could add further pressure if it shows signs of weakness in the housing market.
Scalpers should watch for a break below $2,046.32 on the 1H timeframe, targeting $2,037.99. A stop-loss order should be placed just above the $2,046.32 resistance level. Swing traders should consider entering a short position on a retest of the $2,046.32 resistance, targeting the $2,037.99 support. Long-term investors should monitor the overall trend and consider reducing their positions if the market breaks below key support levels on the daily chart.
Technicals as Tiebreaker: ETHUSD Trend Analysis
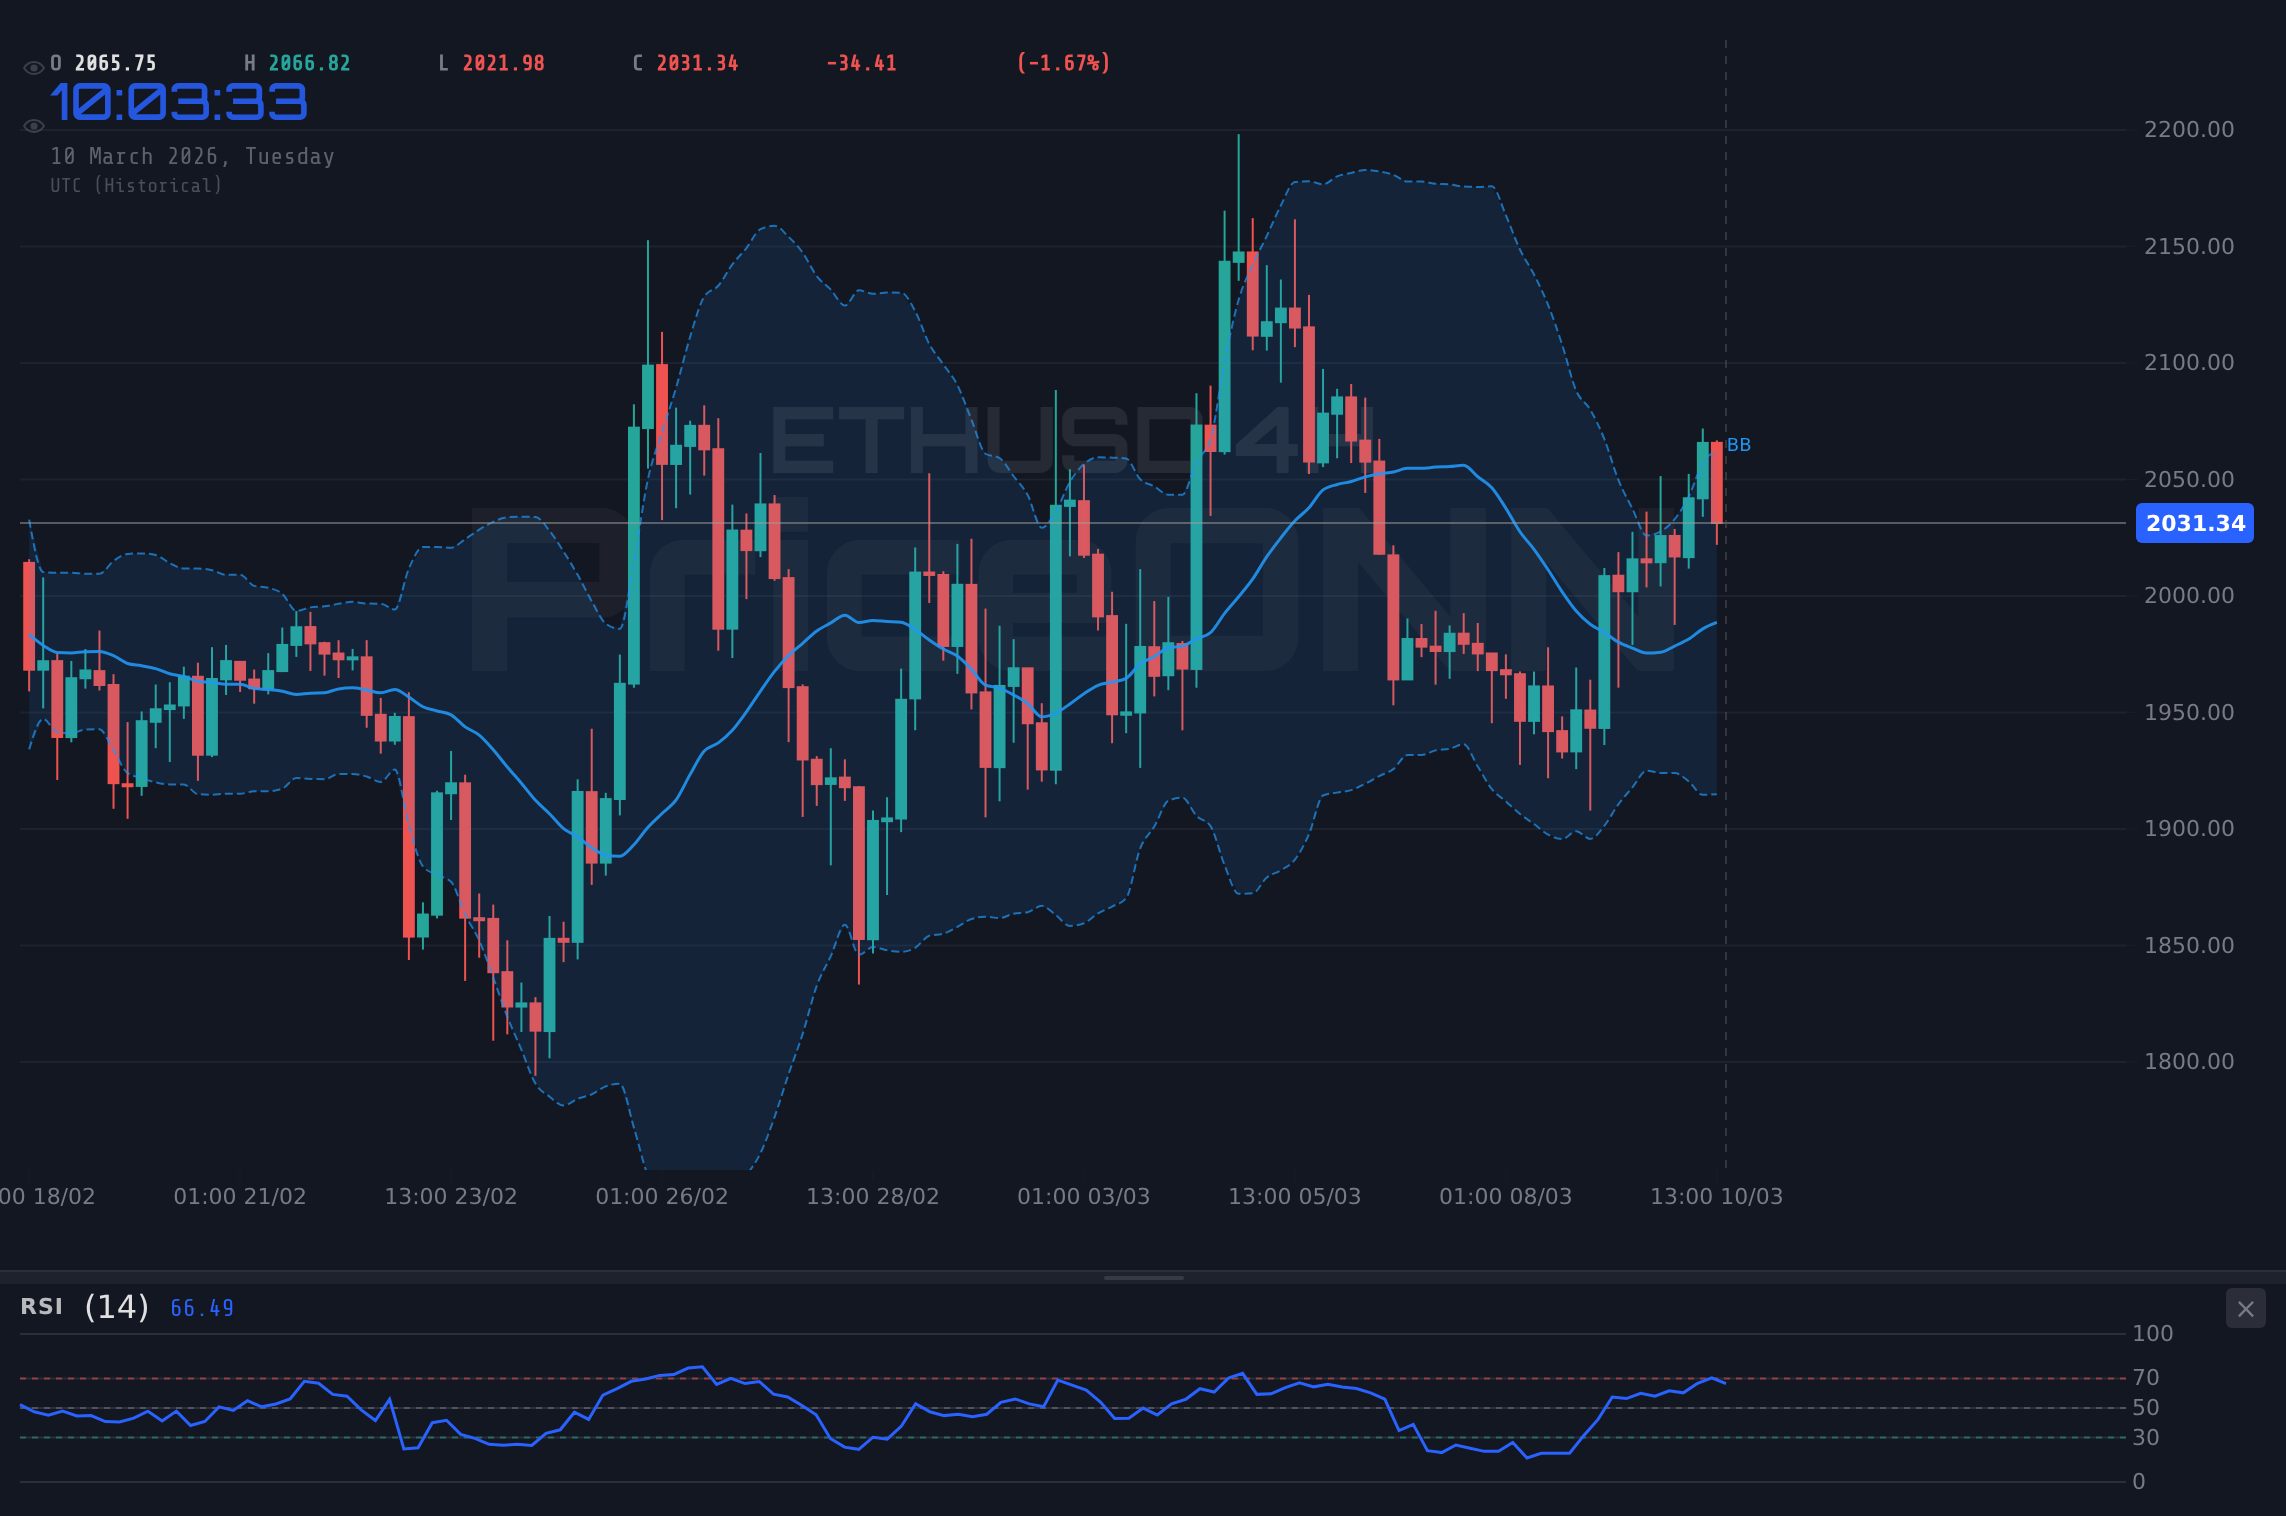
Examining ETHUSD across multiple timeframes reveals a mixed technical picture. On the 1-hour chart, the trend is strongly bullish. The RSI at 67.74 is approaching overbought territory, while the MACD shows positive momentum. The Stochastic indicator signals overbought conditions, suggesting a potential pullback. The ADX at 33.73 indicates a strong uptrend.
On the 4-hour chart, the trend is neutral. The RSI at 63.65 is in neutral territory, while the MACD shows positive momentum. The Stochastic indicator signals overbought conditions, suggesting a potential pullback. The ADX at 17.17 indicates a weak trend.
On the 1-day chart, the trend is also neutral. The RSI at 50.27 is in neutral territory, while the MACD shows positive momentum. The Stochastic indicator signals a potential pullback. The ADX at 26.29 indicates a strong uptrend.
This mixed technical picture suggests that ETHUSD is at a crucial juncture. The bulls have the momentum on the short-term charts, but the bears could regain control if the market breaks below key support levels. The upcoming economic data is likely to be the catalyst that determines the next direction of ETHUSD.
Having tracked ETHUSD through the 2024 rate cycle, I've seen this pattern play out before. The market consolidates near a key level, awaiting a catalyst to break the deadlock. Historically, when the 1H RSI reaches this zone on ETHUSD, the outcome has been a short-term pullback followed by a continuation of the longer-term trend. This pattern last appeared in January 2026, when price subsequently rallied after a brief dip.
Navigating the ETHUSD Volatility: Key Levels to Watch
Understanding key support and resistance levels is crucial for navigating the potential volatility in ETHUSD. Here's a breakdown of the critical levels to watch:
A daily close above $2,076.69 would open the door for a test of $2,085.02. Conversely, a break below $2,046.32 could lead to a decline towards $2,037.99. It's exactly where you need to pay attention...
Trading cryptocurrencies involves significant risk. The value of ETHUSD can fluctuate wildly, and you could lose your entire investment. Always trade with money you can afford to lose and manage your risk carefully.
Frequently Asked Questions: ETHUSD Analysis
What happens if ETHUSD breaks above $2,076.69 resistance?
If ETHUSD manages to break above the $2,076.69 resistance level, it could signal a continuation of the bullish trend. The next target would be the $2,085.02 resistance, and potentially higher if the momentum continues.
Should I buy ETHUSD at current levels of $2,067.68 given the 1H RSI at 67.74?
The 1H RSI at 67.74 suggests that ETHUSD is approaching overbought conditions, so caution is warranted. A more conservative approach would be to wait for a pullback towards the $2,046.32 support level before considering a long position. If this condition plays out, we could see a great setup!
Is the MACD signal on the 1H chart a reliable indicator for ETHUSD?
The MACD on the 1H chart is currently showing positive momentum, which supports the bullish case. However, it's important to consider other indicators and the overall market context before making a trading decision. The ADX at 33.73 indicates a strong uptrend, but this could also mean that the trend is maturing, and a reversal is possible.
How will the US CPI data on Wednesday affect ETHUSD this week?
The US CPI data on Wednesday is a major risk event that could significantly impact ETHUSD. If the CPI comes in higher than expected, it could trigger a sharp increase in interest rate expectations, leading to a stronger dollar and a decline in ETHUSD. Patience looks like it will be rewarded here.
Technical Outlook Summary
| Indicator | Value | Signal |
|---|---|---|
| RSI (14) | 67.74 | Neutral |
| MACD Histogram | Positive | Bullish |
| Stochastic | 87.91 / 81.96 | Overbought |
| ADX | 33.73 | Strong Uptrend |
| Bollinger | Upper Band | Watch |
Manage your risk, wait for your setup-the market always gives a second chance.
Track markets in real-time
AI-powered analysis, technical indicators and real-time price data.
Join Our Telegram Channel
Breaking market news, AI analysis and trading signals instantly.
Join Channel