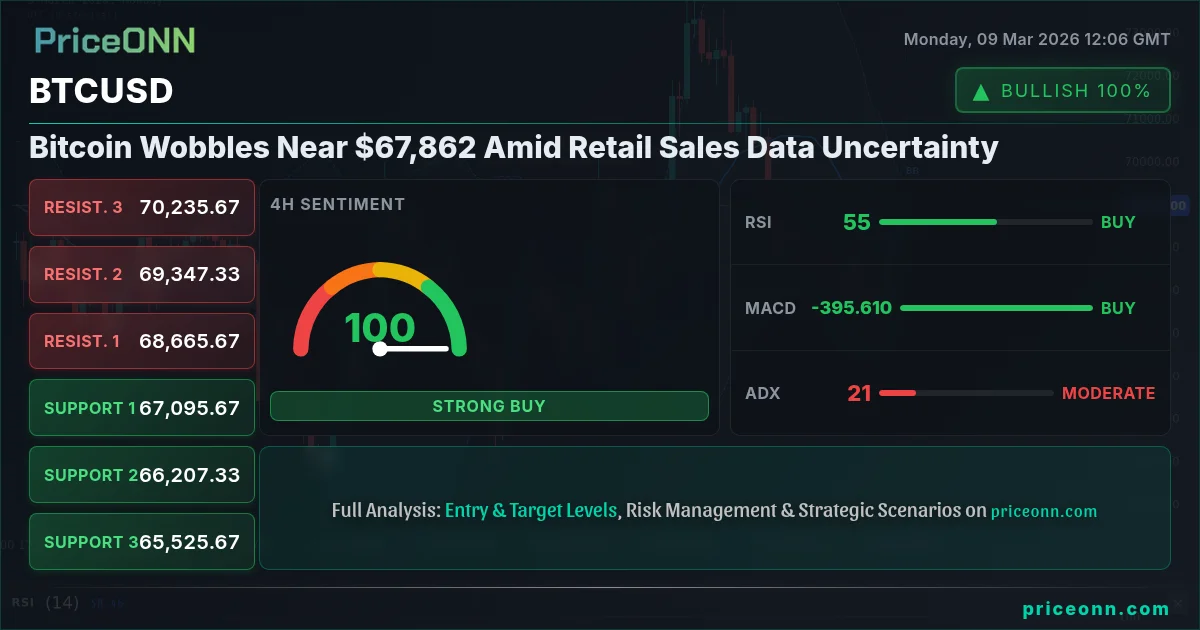
Bitcoin's price action is currently a tug-of-war, oscillating around $67,862, a level that's proving to be a critical battleground between bullish and bearish forces. This comes as the market anticipates key retail sales data, which could act as a catalyst for the next major move. The question is- will the bulls manage to defend this level, or will the bears break through and initiate a deeper correction? The crypto market outlook 2026 hinges on factors like these, making this week particularly crucial for understanding Bitcoin's near-term trajectory.
- RSI at 56.58 on the 1H chart suggests neutral momentum, but leaning bullish.
- Critical support lies at $67,419, a break below which could trigger a bearish cascade.
- MACD on the 4H chart indicates negative momentum, signaling potential bearish pressure.
- DXY's strength at 99.03 is exerting downward pressure on BTCUSD.
The Bullish Case for Bitcoin at $67,862
Despite the current uncertainty, there are compelling arguments supporting a bullish outlook for Bitcoin. One key factor is the overall trend in the crypto market. While short-term volatility is always present, the longer-term trend has been undeniably upward, fueled by increasing institutional adoption and growing mainstream acceptance. Looking at the 1H chart, the RSI at 56.58, while neutral, is trending upwards, suggesting that buying pressure could be building. Furthermore, Bitcoin has demonstrated resilience in the face of numerous challenges, including regulatory scrutiny and macroeconomic headwinds. Historically, Bitcoin has shown a strong tendency to recover from dips, often surprising analysts with its ability to bounce back. For scalpers, keeping an eye on the $67,944 resistance is key for potential breakout opportunities. A successful breach here could fuel a rapid move higher.
Moreover, the upcoming retail sales data, while potentially disruptive in the short term, could ultimately prove to be a positive catalyst for Bitcoin. If the data indicates a weakening economy, it could prompt the Federal Reserve to adopt a more dovish stance on monetary policy, which would likely be bullish for risk assets like Bitcoin. In this scenario, investors may seek refuge in Bitcoin as a hedge against inflation and currency devaluation. Also, the ETHUSD showing a 2.29% increase is a good sign for BTCUSD. The daily chart shows BTCUSD as high as $68,459.00. Another bullish sign is that Brent Crude is showing an increase of 1.96%.
The Bearish Case: Why $67,862 Could Be a False Dawn
Conversely, there are strong arguments supporting a bearish outlook for Bitcoin. The most immediate concern is the potential for negative retail sales data, which could trigger a wave of risk aversion and send investors fleeing to safe-haven assets like the US dollar. The DXY (Dollar Index) is currently at 99.03, up 0.45% for the day. As the dollar strengthens, BTCUSD will face downward pressure. On the 4H chart, the MACD shows negative momentum, indicating that selling pressure is mounting. The first key support level to watch is $67,419. A decisive break below this level could trigger a cascade of stop-loss orders, exacerbating the downward move. The next support levels to watch are $67,227 and $66,894.
Another factor to consider is the potential for increased regulatory scrutiny. Governments around the world are increasingly focused on regulating the crypto market, and any negative news on this front could weigh heavily on Bitcoin's price. Looking at the broader market correlation, the SP500 and Nasdaq100 are both down nearly 1%, indicating a risk-off sentiment that is spilling over into the crypto market. This correlation highlights Bitcoin's vulnerability to broader market trends, particularly during periods of economic uncertainty. For swing traders, the $67,965 resistance level on the daily chart is a key area to watch for potential shorting opportunities.
Technicals as the Tiebreaker: Decoding Bitcoin's Next Move
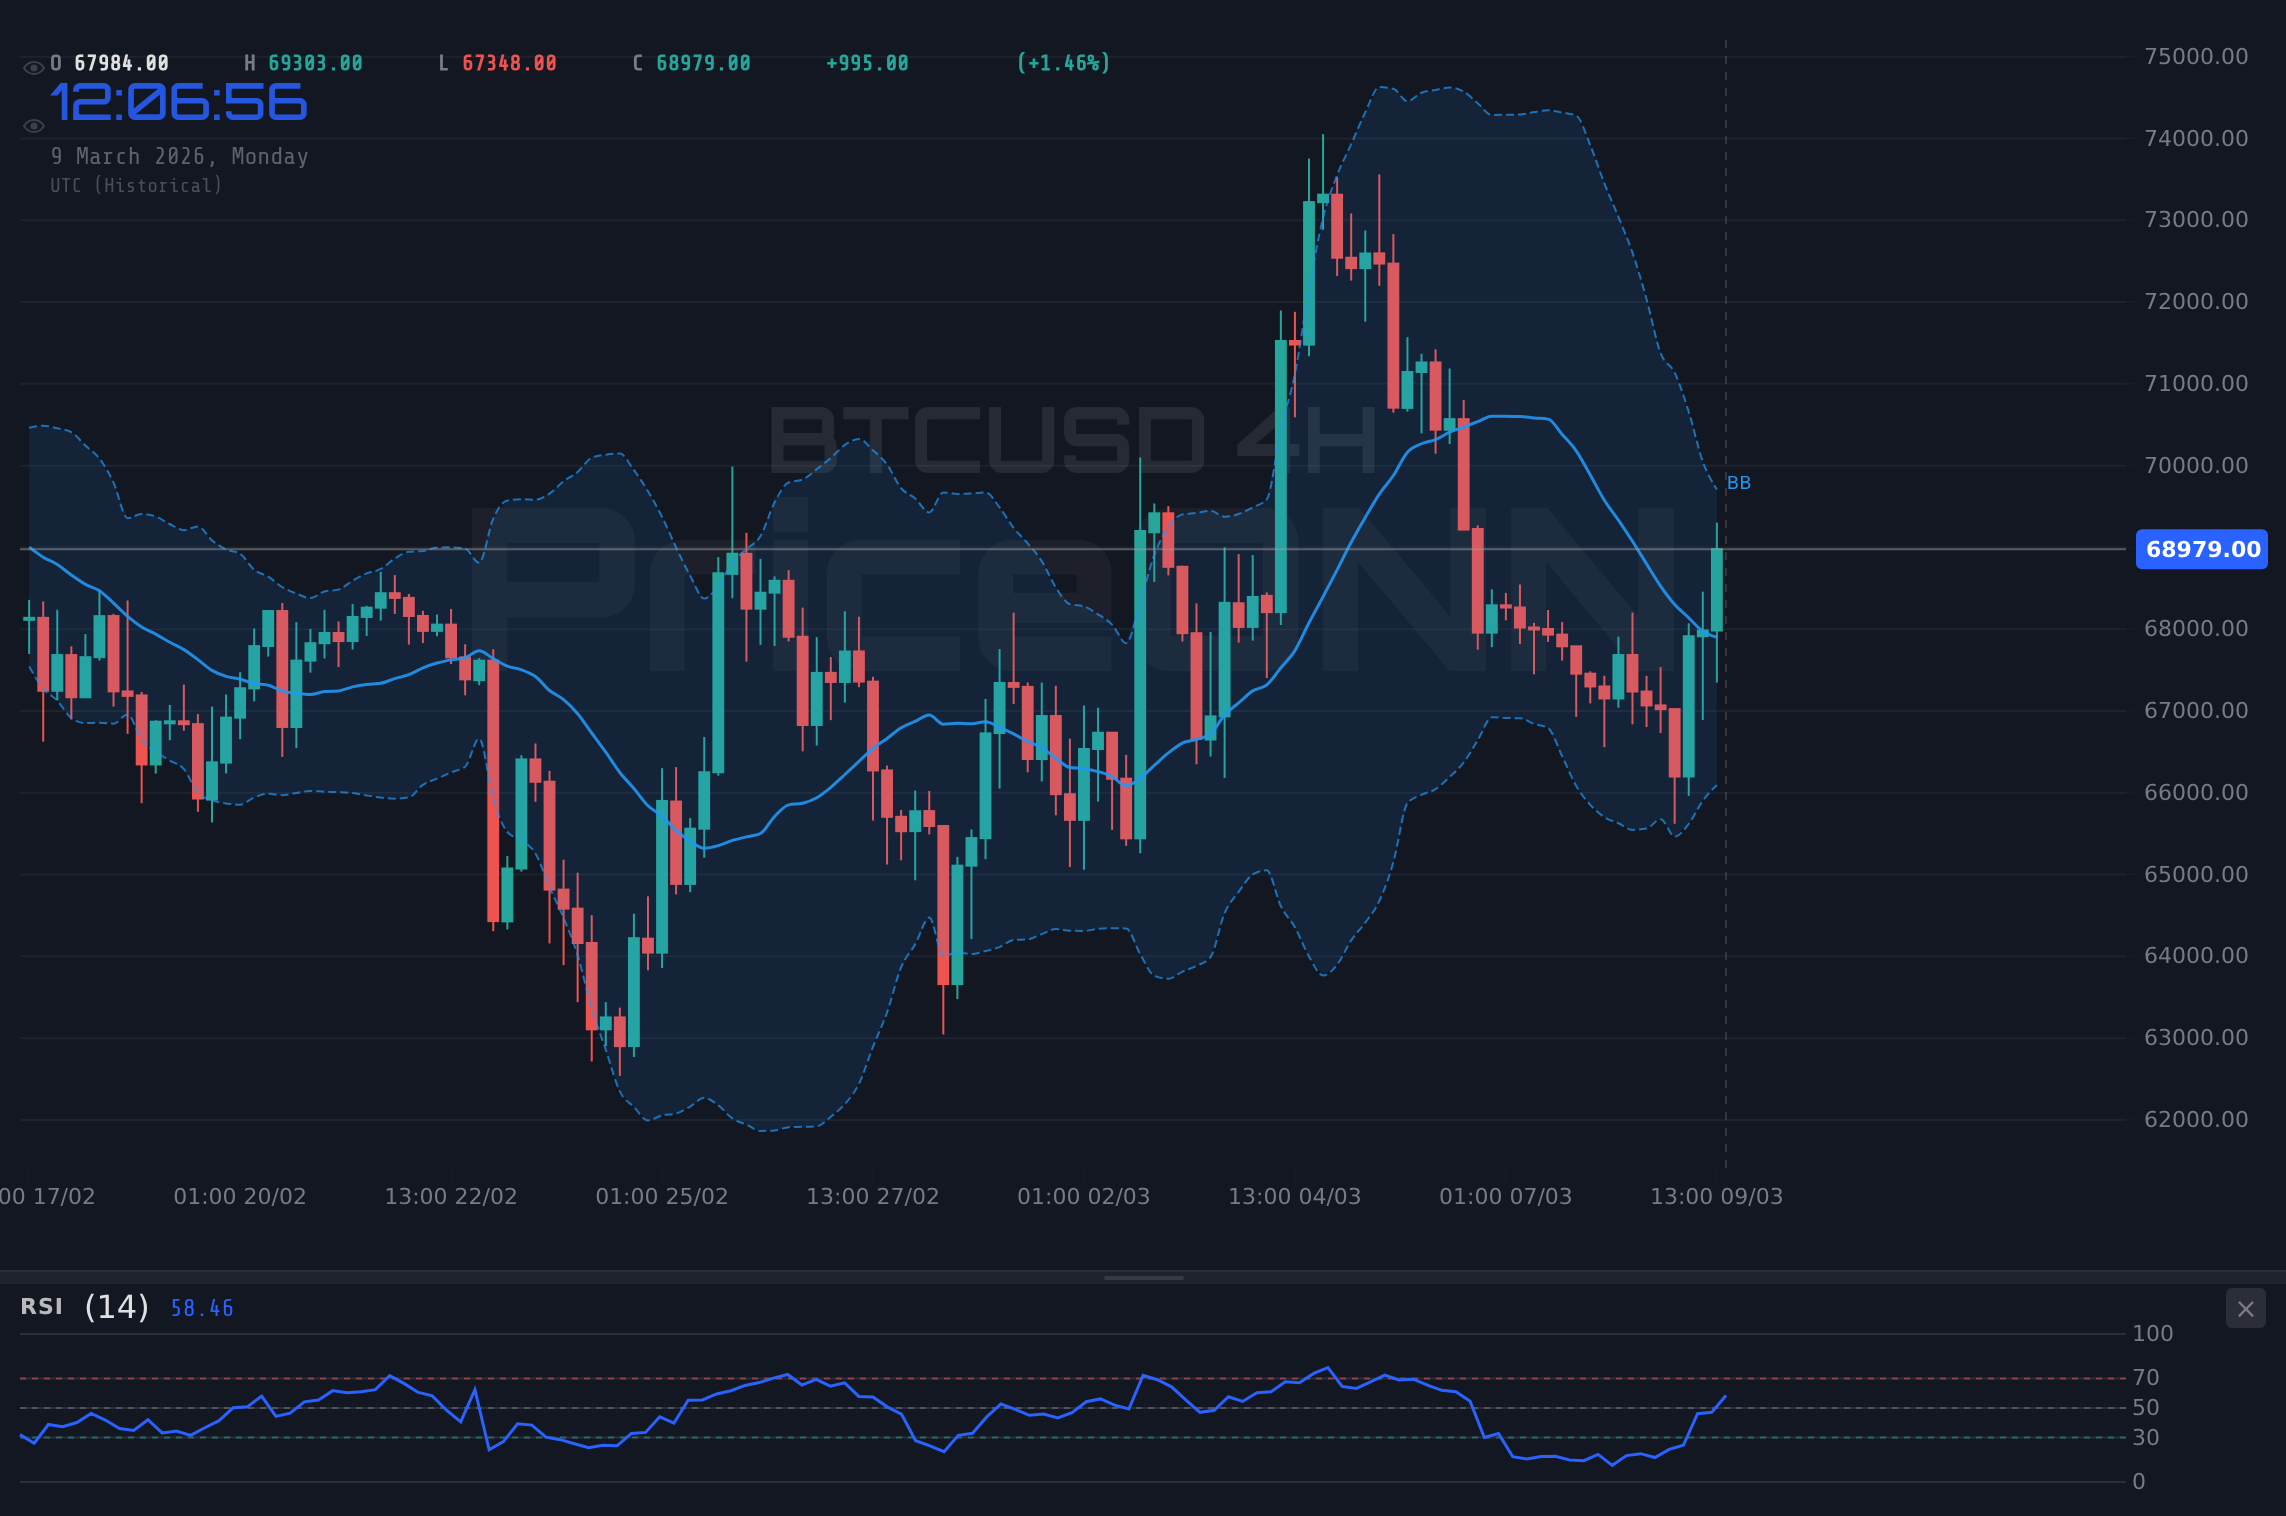
Given the conflicting bullish and bearish arguments, technical analysis can provide valuable insights into Bitcoin's likely trajectory. The 1H chart shows Bitcoin trading above its 200-period moving average, which is generally considered a bullish signal. However, the Stochastic oscillator is signaling overbought conditions, suggesting that a pullback may be imminent. The ADX on the 1H chart is at 24.56, indicating a moderate uptrend. This suggests that the current bullish momentum, while present, is not particularly strong. The 4H chart paints a slightly more bearish picture. The RSI is at 47.59, which is in neutral territory but trending downwards. The ADX on the 4H is at 22.30, indicating a moderate downtrend. The most concerning signal is the MACD, which shows negative momentum.
Zooming out to the daily chart, the technical picture becomes even more complex. The RSI is at 46.50, indicating neutral momentum, but trending downwards. The ADX on the daily chart is at 32.79, indicating a strong downtrend. However, the Stochastic oscillator is signaling oversold conditions, suggesting that a bounce may be due. The BTCUSD today analysis shows a mixed bag of signals. The key takeaway is that Bitcoin is currently at a crossroads, with both bullish and bearish forces vying for control. For long-term investors, the current price action may present an opportunity to accumulate Bitcoin at a relatively attractive level. However, it's crucial to remain patient and wait for confirmation of a clear trend before making any major investment decisions.
Correlation Analysis: DXY, Equities, and Oil's Impact
Understanding Bitcoin's correlation with other asset classes is crucial for making informed trading decisions. As mentioned earlier, the DXY (Dollar Index) currently stands at 99.03, reflecting a strengthening dollar. This typically exerts downward pressure on Bitcoin, as a stronger dollar makes Bitcoin more expensive for international investors. The SP500 is currently at 6670.85, down 0.98% for the day, while the Nasdaq100 is at 24386.01, down 1.03%. This risk-off sentiment in the equity markets is also weighing on Bitcoin. Investors are selling off risk assets and moving into safer investments like US Treasuries. Oil prices are also playing a role. WTI Crude is currently trading at $101.38, up a whopping 11.84% for the day. Rising oil prices tend to fuel inflation concerns, which can be both bullish and bearish for Bitcoin. On the one hand, Bitcoin is often seen as a hedge against inflation, which could attract investors. On the other hand, rising inflation could prompt the Federal Reserve to raise interest rates more aggressively, which would likely be bearish for risk assets like Bitcoin.
The escalating oil crisis, fueled by Middle East tensions as reported by Reuters, adds another layer of complexity. This crisis impacts forex markets and contributes to global economic uncertainty. The EUR/CAD pair, for instance, is under significant downward pressure due to the oil crisis amplifying economic disparities. All of these factors contribute to the volatility and uncertainty surrounding Bitcoin's price action. Traders need to be aware of these correlations and factors when making investment decisions.
Trading Bitcoin involves significant risk of loss. The information provided in this article is for informational purposes only and does not constitute investment advice. Always conduct thorough research and consult with a qualified financial advisor before making any investment decisions.
Trade Recommendation: Watch Zone – Key Level to Monitor
Given the current market conditions, the trade recommendation is to remain in a watch zone. A daily close above the $67,944 resistance would open the door for a potential bullish setup, targeting the $68,670 resistance. Conversely, a decisive break below the $67,419 support would signal a bearish setup, potentially targeting the $66,560 support. Patience is key in these uncertain times. Wait for confirmation of a clear trend before committing to a trade.
Frequently Asked Questions: BTCUSD Analysis
Is BTCUSD a good buy right now?
BTCUSD is currently trading around $67,862, a crucial level. The mixed technical signals and upcoming retail sales data suggest caution. Waiting for a confirmed break above $67,944 or a dip towards $67,419 could offer better entry points.
What is the BTCUSD price forecast for this week?
The BTCUSD price forecast for this week is highly dependent on the retail sales data. A strong report could push BTCUSD towards $66,560, while a weak report could see it test $68,670. The probability of each scenario is roughly 50/50.
What are the key support and resistance levels for BTCUSD?
Key support levels for BTCUSD are $67,419, $67,227, and $66,894. Key resistance levels are $67,944, $68,277, and $68,469. These levels should be watched closely for potential breakouts or breakdowns.
Why is BTCUSD moving today?
BTCUSD is moving today due to a combination of factors, including anticipation of upcoming retail sales data, strength in the US dollar, and risk-off sentiment in the equity markets. Traders are also reacting to the ongoing oil crisis and its potential impact on global inflation.
Volatility creates opportunity- those prepared will be rewarded. With disciplined risk management, these choppy waters can be navigated safely. Remember, patient investors always find opportunities- the key is waiting for the right moment.
Technical Outlook Summary
| Indicator | Value | Signal |
|---|---|---|
| RSI (14) | 46.5 | Neutral |
| MACD Histogram | Negative | Bearish |
| Stochastic | 35.79 | Bearish |
| ADX | 32.79 | Strong Downtrend |
| Bollinger | Middle Band | Watch |
Track markets in real-time
AI-powered analysis, technical indicators and real-time price data.
Join Our Telegram Channel
Breaking market news, AI analysis and trading signals instantly.
Join Channel