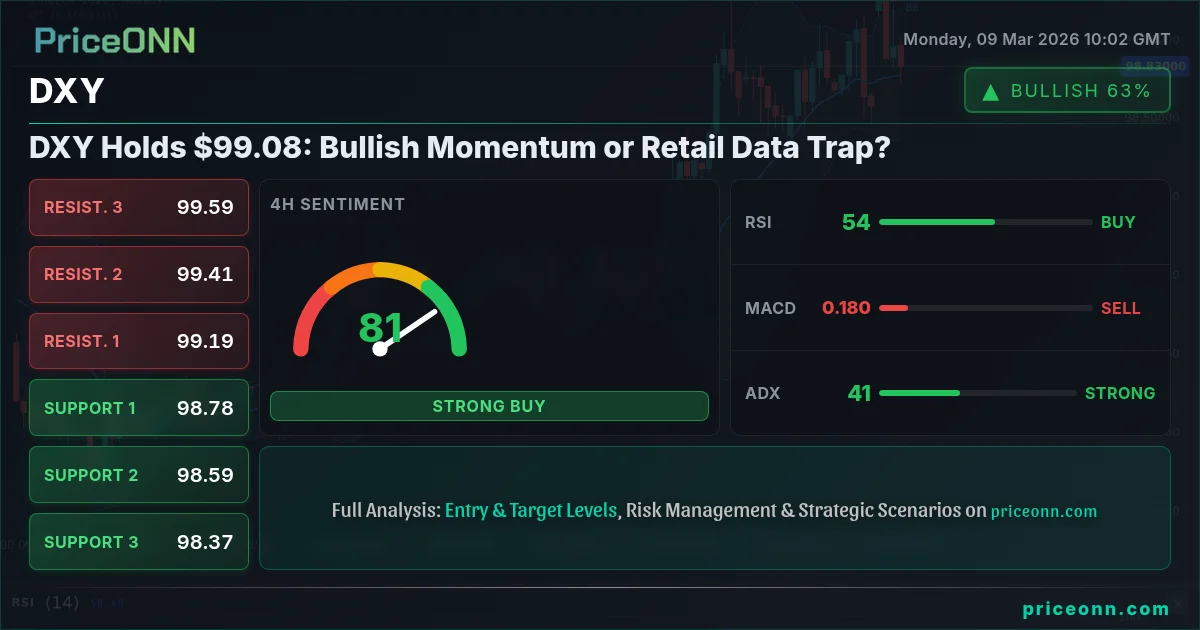
The dollar index (DXY) is currently trading near $99.08, a level that's proving to be a significant battleground between bulls and bears. The escalating oil crisis, as reported by Forex Haber on March 8, has injected considerable volatility into the forex markets, particularly impacting EUR/CAD. But the question remains: will the upcoming retail data provide the necessary impetus for a sustained bullish breakout, or will it reveal underlying weakness, leading to a bearish reversal? This tug-of-war is creating a tense environment for traders, demanding a careful evaluation of both technical and fundamental factors.
- RSI at 54.33 on the 1H chart suggests neutral momentum, favoring neither bulls nor bears decisively.
- Critical resistance lies at $99.28; a break above this level could signal further upside.
- MACD on the 4H chart shows negative momentum, hinting at potential pullback despite overall bullish sentiment.
- Rising oil prices, with Brent Crude at $65.73, are contributing to inflationary pressures, indirectly influencing DXY strength.
The Bullish Case for DXY: Retail Data as Catalyst
The bullish narrative for the dollar index rests on the expectation that upcoming retail data will confirm the underlying strength of the US economy. The expectation is that positive retail sales figures would bolster the case for continued hawkish monetary policy from the Federal Reserve, driving demand for the dollar. The DXY’s 1H RSI at 54.33 indicates neutral momentum but this could swiftly turn bullish if the data surprises to the upside. The recent US Job Market Weakening, reported on March 7, might increase the Fed's resolve to maintain a strong dollar to attract investment and manage inflation. Furthermore, the DXY's daily change is positive at 0.51%, indicating that the bulls are trying to establish an upward trend. A key level to watch is the immediate resistance at $99.28; a decisive break above this level could trigger a wave of buying, targeting the next resistance at $99.44.
The Bearish Counter-Argument: Oil Crisis and Risk Aversion
Conversely, the bearish argument hinges on the potential for the ongoing oil crisis and broader geopolitical tensions to trigger risk aversion, ultimately benefiting safe-haven currencies like the Japanese Yen and Swiss Franc over the dollar. With Brent crude at $65.73, inflationary pressures may force the Fed to reconsider its tightening path, weakening the dollar. The 4H MACD shows negative momentum, a sign that the bullish trend might be losing steam. The stochastic K=51.92 and D=64.84 on the 1H chart also suggests a potential pullback, as the %K is below the %D. The strong USD is also having a negative impact on US exports, potentially slowing down economic growth. Key support to watch is $98.92; a break below this level could open the door to further declines, targeting $98.71. The fact that the SP500 has a daily change of -0.86% indicates investors may be moving away from riskier assets.
Technicals as Tiebreaker: Multi-Timeframe Analysis
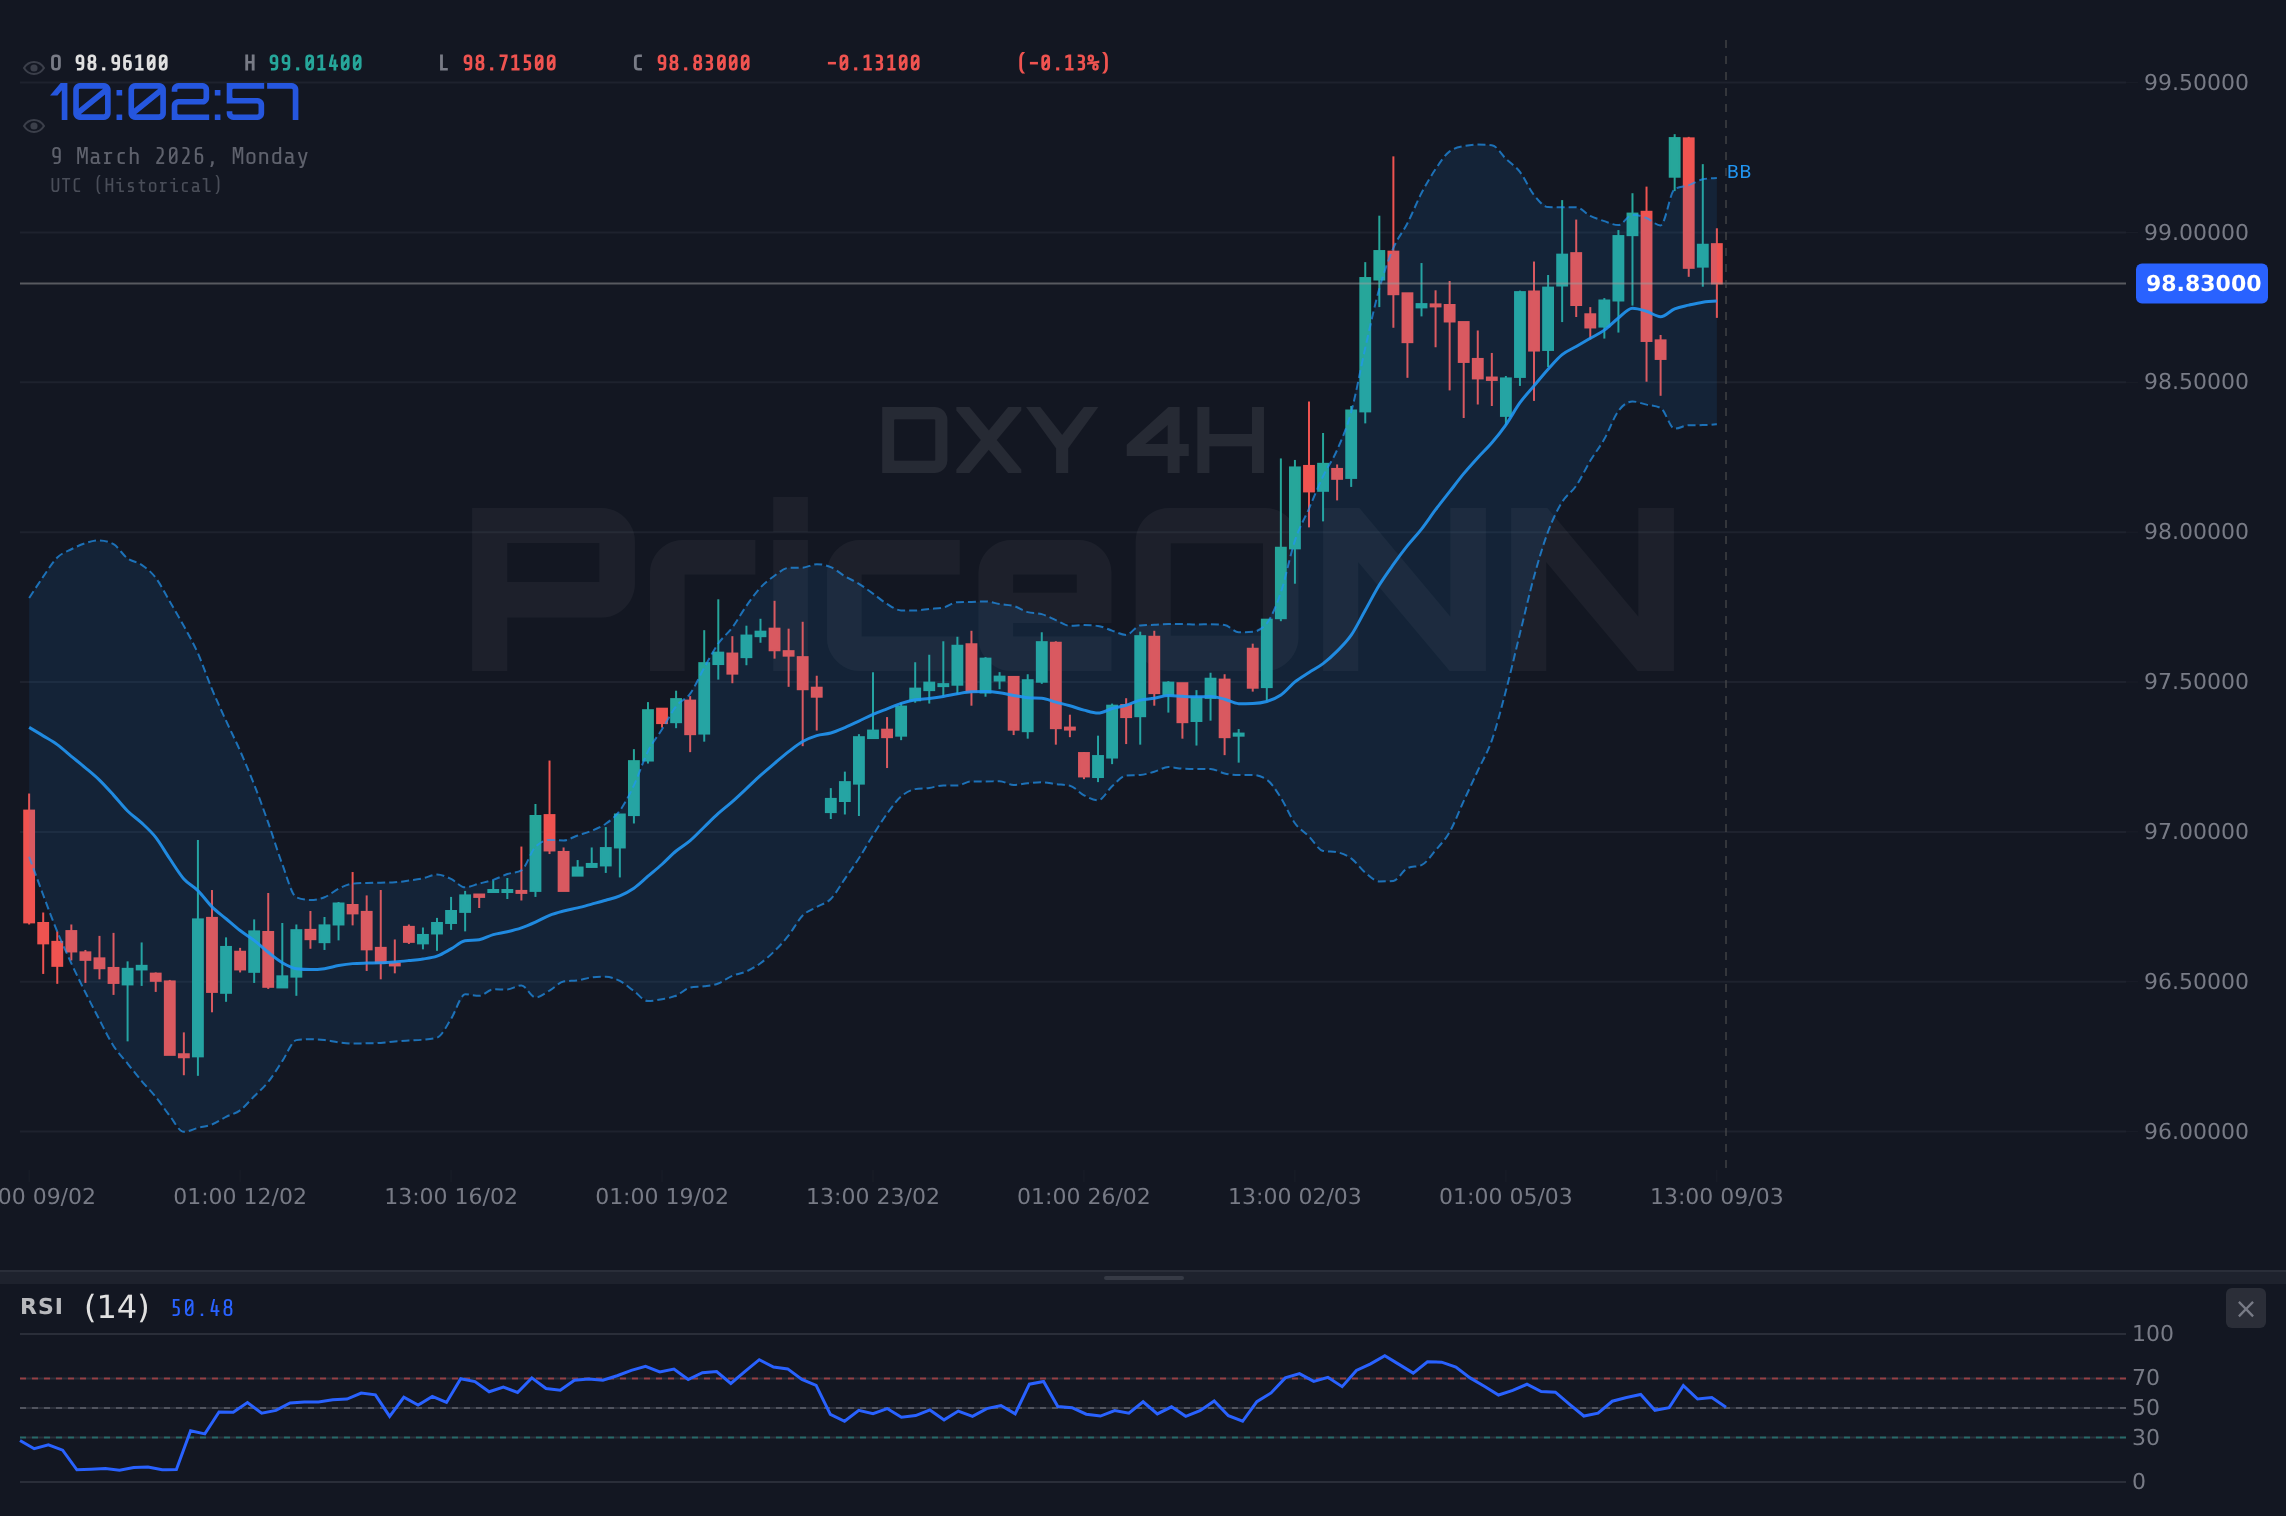
To resolve this bull vs. bear debate, a multi-timeframe technical analysis provides crucial insights. On the 1H chart, the DXY is showing a neutral trend. The ADX at 15.92 indicates a weak trend, suggesting the market is waiting for a catalyst. However, the 4H chart shows a strong bullish trend with ADX at 42.54. The RSI on the 4H chart is at 58.13, which is neutral, but trending upwards. The 1D chart shows a neutral trend but RSI at 67.21 is getting close to overbought, which could signal a potential pullback. The stochastic on the 1D chart has K=77.91 and D=73.11, both indicating the potential for overbought conditions. The contrasting signals across these timeframes suggest that the market is at a critical juncture. Scalpers should watch for short-term opportunities based on the 1H chart, while swing traders should focus on the 4H and 1D charts for trend confirmations. Long-term investors should monitor the weekly and monthly charts for broader trend analysis.
Correlation Analysis: DXY, Equities, and Commodities
Analyzing the correlation between DXY, equities, and commodities provides additional context. A rising DXY typically puts pressure on commodities like gold and silver, as they are priced in dollars. Given that the SP500 is down -0.86% today, the risk-off sentiment could be benefiting the DXY as investors seek safety in the dollar. The price of Brent crude oil is currently at $65.73, which is up 1.96% on the day. This rise in oil prices could fuel inflationary pressures, potentially leading to a more hawkish stance from the Fed, and in turn, supporting the dollar. Monitoring these correlations is crucial for traders to understand the broader market dynamics and make informed decisions. If the SP500 continues to decline and oil prices continue to rise, it could create a perfect storm for DXY strength.
Economic Calendar and Retail Data: The Decisive Factor
The upcoming economic calendar is packed with high-impact events that could significantly influence the DXY. The key event to watch is the retail data release. Strong retail sales figures would likely boost the dollar, confirming the bullish narrative. Conversely, weak data could trigger a sell-off in the dollar. Traders should also pay attention to other data releases, such as inflation figures and employment data, as they can provide further insights into the health of the US economy. The Canadian Unemployment Rate is expected to rise which could send investors to the USD as a safe haven. Given the current market volatility, it is essential to stay informed and be prepared for any potential outcome. News of the EUR/CAD plunging amidst the oil crisis could also be a factor that moves investors to the USD.
Historical Perspective: DXY at Critical Juncture
Historically, the DXY's behavior around the $99 level has been indicative of significant market shifts. In previous instances where the DXY tested this level, the subsequent price action often determined the direction of major currency pairs and commodity prices. For instance, a sustained break above $99 has historically led to a period of dollar strength, while a failure to hold this level has resulted in a weakening dollar. Analyzing past price action and market conditions can provide valuable insights into the potential future trajectory of the DXY. During the 2024 rate cycle, the DXY's response to rate hikes provided insight into its sensitivity to monetary policy. It is important to consider these historical patterns when evaluating the current market conditions and making trading decisions.
Trading Strategies: Scalpers, Swing Traders, and Long-Term Investors
Different types of traders should adopt different strategies based on the current market conditions. Scalpers should focus on the 1H chart, looking for short-term opportunities based on technical indicators and price action. Swing traders should monitor the 4H and 1D charts, seeking to identify trend confirmations and potential breakouts. Long-term investors should analyze the weekly and monthly charts, focusing on broader trend analysis and fundamental factors. Given the current uncertainty, it is essential to manage risk and avoid over-leveraging. Traders should also consider using stop-loss orders to protect their capital. Patience is key, and it is crucial to wait for the right setup before entering a trade. With the ADX at 15.92 there is no clear trend which means patience could be rewarded here.
Risk Management: Navigating DXY Volatility
Navigating the current DXY volatility requires a disciplined approach to risk management. Traders should carefully assess their risk tolerance and adjust their position sizes accordingly. It is also important to use stop-loss orders to limit potential losses. Given the potential for unexpected news events to trigger sharp price swings, it is essential to stay informed and be prepared to adjust trading strategies as needed. Diversifying trading strategies and asset allocations is also crucial to mitigate risk. The rising price of oil coupled with a weakening job market could send the DXY in either direction so it is imperative to practice proper risk management techniques.
Frequently Asked Questions: DXY Analysis
Is DXY a good buy right now?
With DXY trading at $99.08, it's a mixed bag. The RSI is neutral, but a break above the resistance at $99.28 could signal a buy. However, be cautious of a potential pullback given the negative MACD on the 4H chart.
What is the DXY price forecast for this week?
The DXY price forecast for this week is highly dependent on the upcoming retail data. A strong release could push DXY towards $99.44, while weak data could see it decline towards $98.92. Probability assessment is 55% bullish, 45% bearish.
What are the key support and resistance levels for DXY?
Key support for DXY lies at $98.92, followed by $98.71. On the upside, key resistance is at $99.28, followed by $99.44. These levels are crucial for identifying potential breakout or reversal points.
Why is DXY moving today?
DXY's movement today is influenced by a combination of factors, including the escalating oil crisis and the anticipation of upcoming retail data. Risk-off sentiment due to geopolitical tensions is also playing a role. News of the EUR/CAD plunging amidst the oil crisis could be a factor.
Volatility creates opportunity-those prepared will be rewarded. With disciplined risk management, these choppy waters can be navigated safely.
Track markets in real-time
AI-powered analysis, technical indicators and real-time price data.
Join Our Telegram Channel
Breaking market news, AI analysis and trading signals instantly.
Join Channel