
NZDUSD is currently navigating choppy waters, hovering around $0.59132 as markets brace for key retail sales data. This data release could be a pivotal moment, potentially setting the stage for the Kiwi's next directional move. The pair's performance is also influenced by broader market dynamics, particularly the strength of the US dollar and risk sentiment reflected in equity indices.
- RSI at 57.5 suggests neutral momentum, but a potential shift towards overbought conditions on the 1H chart.
- Key support lies at $0.59145, a break below which could trigger further downside.
- MACD shows positive momentum, but the histogram's trajectory needs to be monitored for confirmation.
- NZDUSD's correlation with DXY indicates that dollar strength could weigh on the pair.
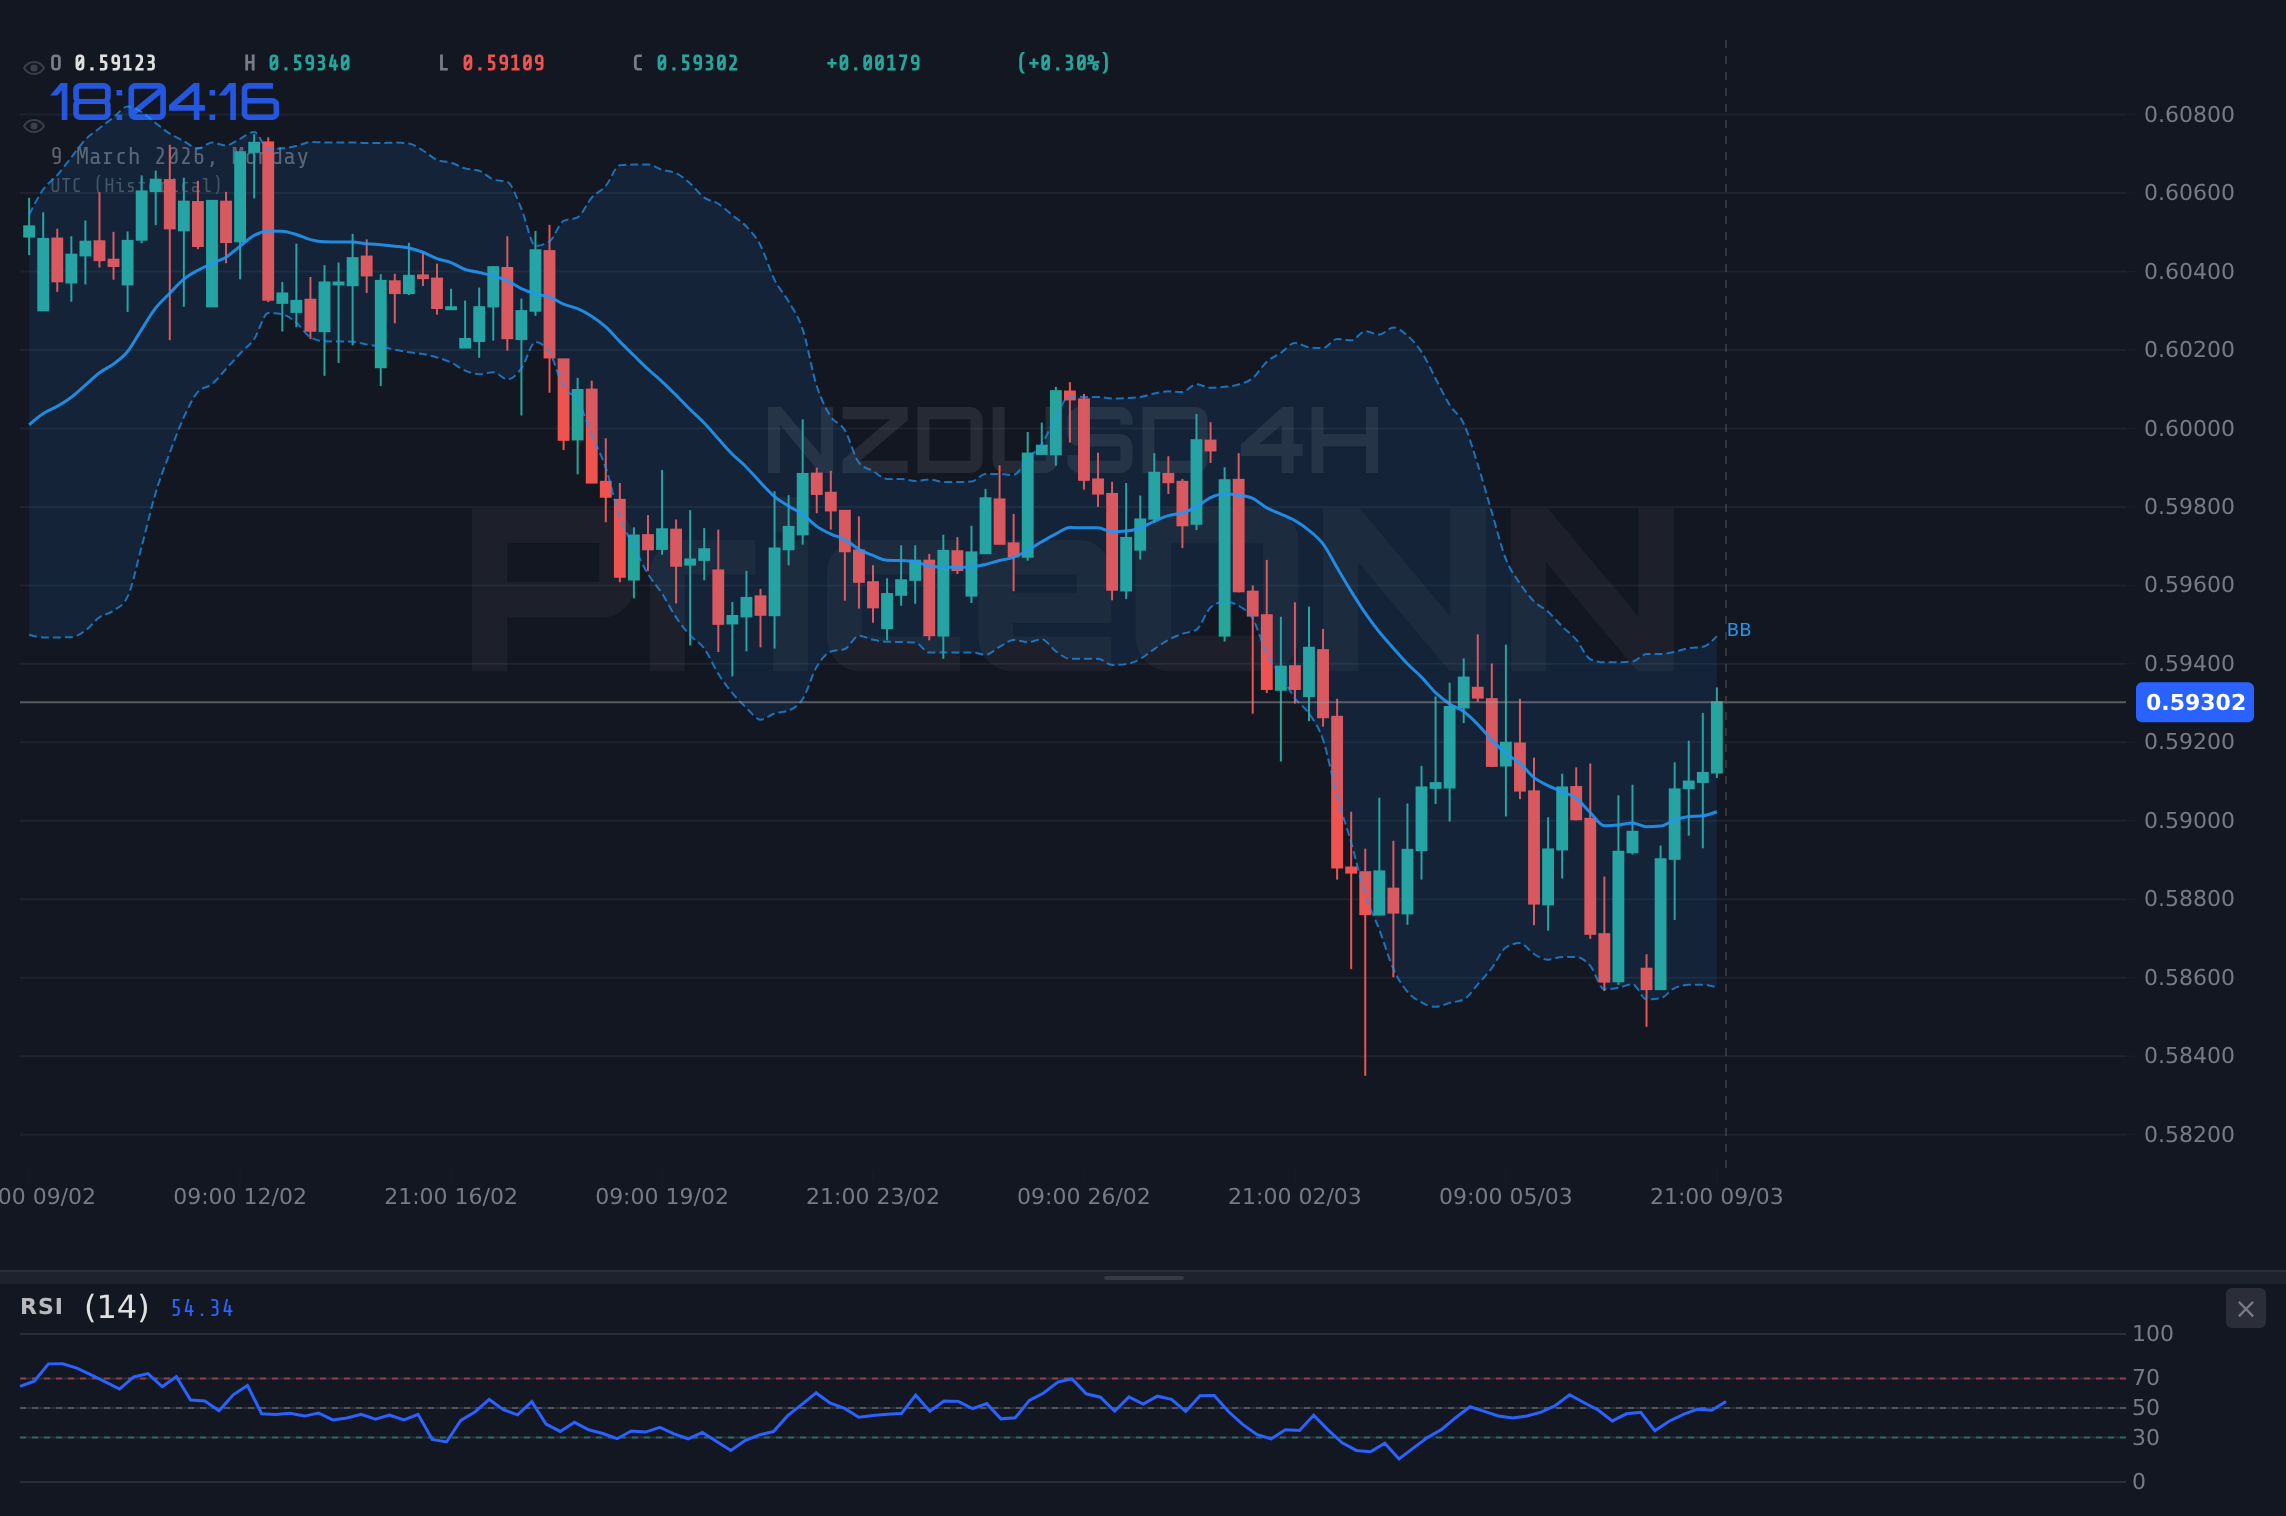
Technical Overview: Short-Term Consolidation
From a technical perspective, NZDUSD is exhibiting signs of short-term consolidation. On the 1-hour chart, the RSI stands at 57.5, indicating neutral momentum with a slight upward bias. However, the Stochastic oscillator, with %K at 81.96 and %D at 79.17, points to overbought conditions, suggesting a potential pullback. The MACD, while showing positive momentum above the signal line, needs further confirmation to sustain its bullish outlook. The ADX reading of 20.85 indicates a weak trend, reinforcing the notion of consolidation rather than a strong directional move.
Stepping back to the 4-hour timeframe provides a broader context. The RSI at 51.5 remains in neutral territory, while the Stochastic oscillator, with %K at 85.46 and %D at 55.62, signals overbought conditions. The ADX reading of 32.56, while suggesting a strong downtrend, contradicts the overall neutral trend identified in the 4-hour timeframe. This divergence highlights the importance of considering multiple timeframes and indicators to gain a comprehensive understanding of market dynamics.
Looking at the daily chart, the RSI is at 40.78, suggesting potential for further downside. The Stochastic oscillator, with %K at 30.22 and %D at 34.62, reinforces the bearish outlook. The ADX reading of 24.67 indicates a moderate downtrend, aligning with the overall bearish sentiment on the daily timeframe. The MACD also indicates negative momentum, further supporting the bearish case.
Key Price Levels: Support and Resistance Zones
Immediate support can be found near $0.59145, representing the closest level to the current price. A break below this level could open the door for a test of the next support zone around $0.59064, followed by $0.58999. On the upside, immediate resistance is situated near $0.59291. Clearing this hurdle could pave the way for a move towards $0.59356, with further resistance located around $0.59437. These levels should be closely monitored in the coming sessions, as they could serve as potential entry and exit points for traders.
From a broader perspective, the 4-hour chart identifies key support levels at $0.58973, $0.58847, and $0.58731. On the resistance side, the 4-hour chart highlights levels at $0.59215, $0.59331, and $0.59457. On the daily chart, key support levels are identified at $0.58643, $0.58315, and $0.58063, while resistance levels are found at $0.59223, $0.59475, and $0.59803. These broader levels provide a framework for understanding potential long-term price movements.
Market Sentiment and Risk Factors
Market sentiment surrounding NZDUSD is currently mixed, with traders cautiously awaiting the upcoming retail sales data. A stronger-than-expected reading could provide a boost to the Kiwi, while a weaker-than-expected print could trigger further downside. The currency pair is also influenced by broader risk sentiment, as the New Zealand dollar is often considered a risk-on currency. As the SP500 is showing a daily downtrend with a 96% strength, risk-off sentiment could weigh on the Kiwi.
The strength of the US dollar, as reflected in the DXY, also plays a crucial role in NZDUSD's performance. With the DXY currently at 98.93 and trending upwards, the Kiwi faces potential headwinds. As the DXY shows a strong uptrend on the 4-hour chart with an ADX of 39.72, dollar strength could continue to weigh on the pair. According to recent news, the escalating oil crisis triggered by Middle East tensions is sending shockwaves through forex markets, adding another layer of complexity to the market landscape.
The situation in the Middle East and its impact on oil prices is adding another layer of complexity to the forex market. Brent crude oil is currently trading at $65.73, showing a daily uptrend with 89% strength. Rising oil prices can influence inflation expectations and subsequently impact central bank policies, potentially affecting currency valuations. This also relates to the fact that US Job Market Weakens, which may create further uncertainty.
Economic Calendar: Retail Sales Data in Focus
The primary focus for NZDUSD traders in the coming days will be the upcoming retail sales data. This release will provide valuable insights into the health of the New Zealand economy and could significantly impact the Kiwi's trajectory. The market's reaction to this data will likely shape the short-term outlook for the pair. Furthermore, markets will be looking at future events, such as Tuesday's US data. While specific data is unavailable, this data will be highly anticipated.
Looking ahead, market participants will also be closely monitoring other key economic indicators, including inflation data and employment figures. These releases will provide further clues about the health of the global economy and the potential path of monetary policy. Any significant deviations from expectations could trigger volatility in the forex market and impact NZDUSD.
Trade Recommendation: Watch Zone
Given the current technical setup and the upcoming retail sales data, a neutral stance seems warranted. A daily close above $0.59223 would open the door for a bullish scenario, potentially targeting $0.59475. This would need to be confirmed by a DXY pullback and positive risk sentiment. Conversely, a break below $0.59145 could signal further downside, with potential targets around $0.58643. This scenario would likely be fueled by dollar strength and risk aversion. Patience looks like it will be rewarded here.
A break of $0.59223 resistance would need to be confirmed by a surge in buying volume and a sustained increase in momentum. The RSI would need to break above 60, and the MACD would need to show a clear bullish crossover. Conversely, a break of $0.59145 support would need to be accompanied by strong selling pressure and a decline in momentum. The RSI would need to fall below 40, and the MACD would need to show a clear bearish crossover.
Trading forex involves significant risk and may not be suitable for all investors. The use of leverage can amplify both gains and losses. Before trading, carefully consider your financial situation and risk tolerance. Past performance is not indicative of future results.
Navigating the Kiwi: A Forward-Looking Perspective
Navigating the NZDUSD landscape requires a balanced approach, combining technical analysis with an understanding of fundamental drivers and market sentiment. By closely monitoring key price levels, economic data releases, and broader market dynamics, traders can position themselves to capitalize on potential opportunities. As the market continues to evolve, adaptability and risk management will be essential for success. Manage your risk, wait for your setup - the market always gives a second chance.
Volatility creates opportunity - those prepared will be rewarded. Patient investors always find opportunities - the key is waiting for the right moment. The key to successful trading lies in disciplined risk management and the ability to adapt to changing market conditions. With a well-defined strategy and a clear understanding of the risks involved, traders can navigate the NZDUSD landscape with confidence.
Frequently Asked Questions: NZDUSD Analysis
Is NZDUSD a good buy right now?
Given the current price of $0.59132 and the neutral technical signals, NZDUSD is not a clear buy right now. Traders should wait for a break above $0.59223 or a drop below $0.59145 before making a decision, depending on their risk tolerance.
What is the NZDUSD price forecast for this week?
The NZDUSD price forecast for this week is highly dependent on the upcoming retail sales data. A stronger-than-expected reading could push the pair towards $0.59475, while a weaker-than-expected print could lead to a test of $0.58643.
What are the key support and resistance levels for NZDUSD?
Key support levels for NZDUSD are $0.59145, $0.59064, and $0.58999. Key resistance levels are $0.59291, $0.59356, and $0.59437, all based on the current 1-hour timeframe.
Why is NZDUSD moving today?
NZDUSD is moving today due to a combination of factors, including anticipation of retail sales data, fluctuations in the US dollar's strength, and broader risk sentiment in the market. The DXY's uptrend is putting pressure on the pair.
Technical Outlook Summary
| Indicator | Value | Signal |
|---|---|---|
| RSI (14) | 57.5 | Neutral |
| MACD Histogram | Positive | Bullish |
| Stochastic | 81.96/79.17 | Overbought |
| ADX | 20.85 | Weak Trend |
| Bollinger | Upper Band | Watch |
Key Levels
Support Levels
Resistance Levels
Track markets in real-time
AI-powered analysis, technical indicators and real-time price data.
Join Our Telegram Channel
Breaking market news, AI analysis and trading signals instantly.
Join Channel