Bitcoin's price currently hovers around $69,341, a level that's proving to be a battleground between bullish and bearish forces. The tug-of-war at this price point could determine the short-term trajectory of BTCUSD. Is this a temporary pause before another leg up, or the start of a deeper correction? Let's delve into both sides of the argument.
- RSI at 62.79 on the 1-hour chart suggests bulls are losing steam.
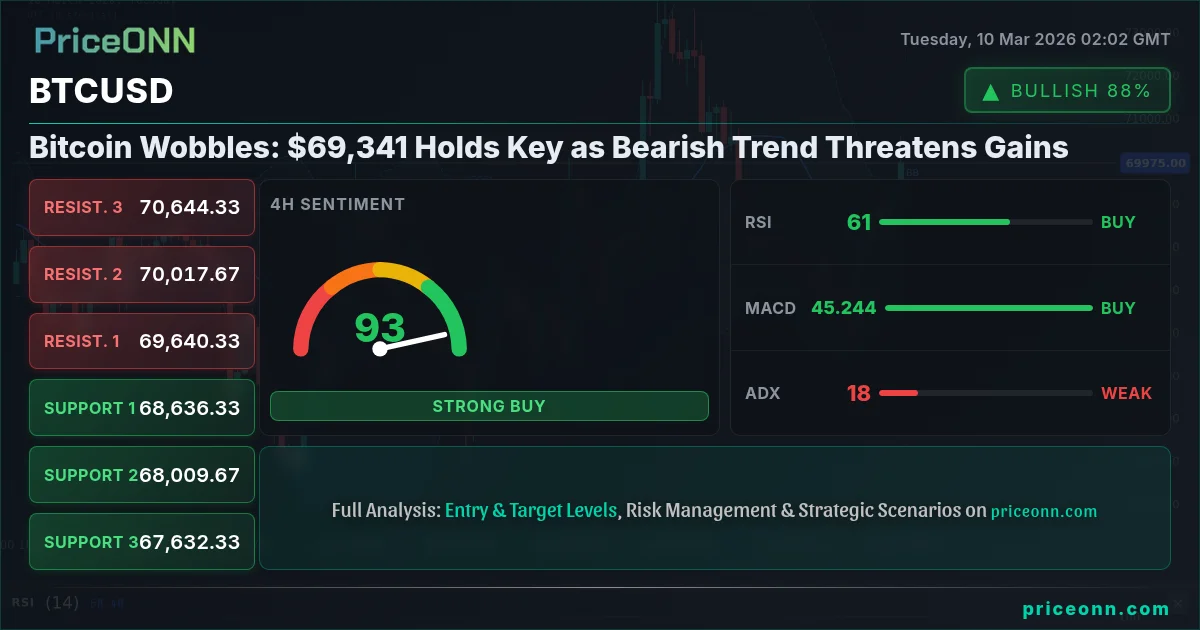
- Critical support sits at $68,606, tested multiple times in the last few hours.
- MACD histogram on the daily chart shows divergence: bullish momentum is fading.
- Fed rate expectations and DXY strength are weighing on BTCUSD, correlated inversely.
The Bull Case for Bitcoin
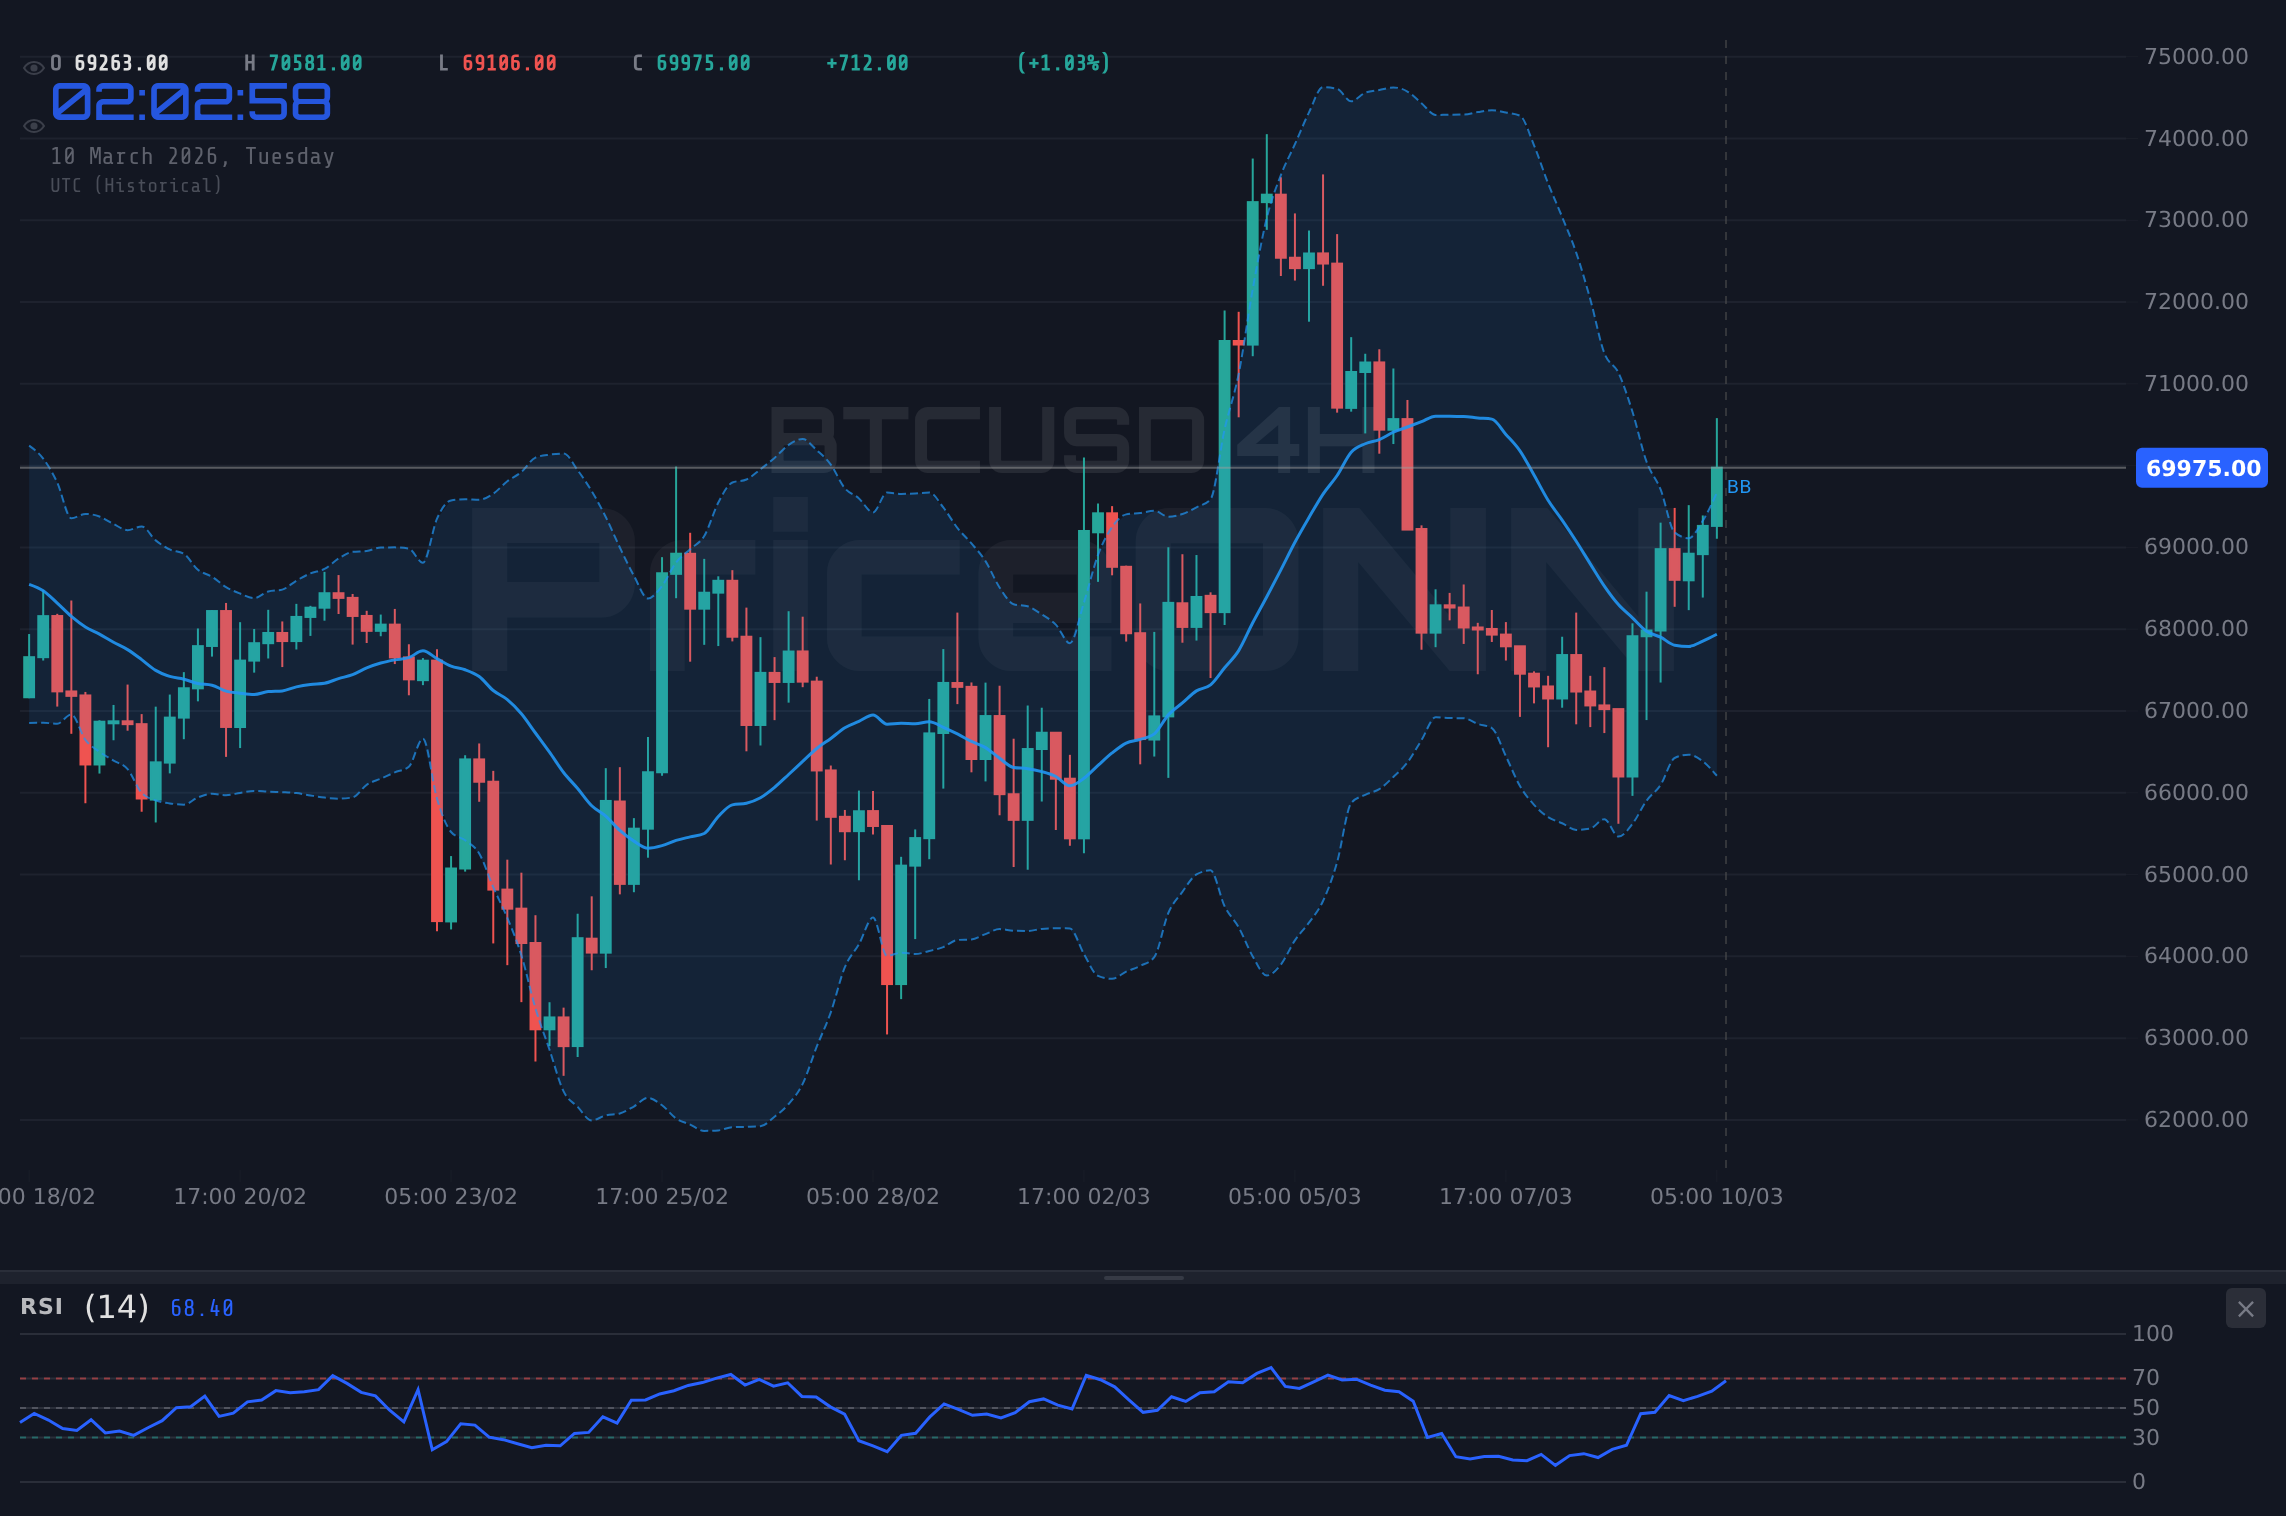
Despite the current hesitation, several factors support a bullish outlook for Bitcoin. Firstly, looking at the 4-hour chart, the Stochastic oscillator shows a reading of K=85.83 and D=75.5. This indicates a potential for continued upward momentum. Even though the overall trend is classified as neutral on the 4H timeframe, the positive momentum suggests that bulls are not ready to give up just yet. The price is also trading above the middle Bollinger Band on the 4-hour chart, further supporting the possibility of a bullish continuation.
Moreover, the recent daily change of 3.46% indicates a significant surge in buying pressure. For swing traders, the key level to watch is the immediate resistance at $69,505 on the 1-hour chart. A decisive break above this level could trigger a fresh wave of buying, potentially targeting the next resistance level at $69,849. The positive momentum on the 1-hour and 4-hour charts suggests that such a breakout is possible, although not guaranteed.
Furthermore, the overall market sentiment remains relatively positive, with the SP500 and Nasdaq100 showing gains of 0.74% and 1.32% respectively. This risk-on environment could spill over into the cryptocurrency market, providing additional support for Bitcoin. Historically, Bitcoin has shown a positive correlation with equities during periods of economic expansion and risk appetite. However, this correlation can break down during times of extreme market stress or regulatory uncertainty. The current correlation suggests that if the SP500 and Nasdaq continue their upward trajectory, Bitcoin could benefit from increased investor confidence.
The Bear Case for Bitcoin
Conversely, the bearish argument centers on several technical and fundamental factors. The daily chart reveals a concerning picture: the Stochastic oscillator shows a reading of K=41.27 and D=62.26, indicating a bearish signal with %K less than %D. This suggests that the recent upward momentum may be unsustainable, and a correction could be imminent. The ADX on the daily timeframe is at 31.97, indicative of a strong downtrend. This suggests that the bears are in control on the daily timeframe, and any bullish rallies may be short-lived.
Adding to the bearish sentiment, the negative momentum on the daily MACD histogram further reinforces the possibility of a downside move. The RSI on the daily chart is at 49.4, indicating neutral conditions but trending downwards. This further supports the bearish case, as momentum is weakening. Scalpers should be aware that volatility is high, as evidenced by the wide daily range of $65,621 to $69,517. This means that quick profits can be made, but also that risk management is crucial.
From a fundamental perspective, the strength of the US dollar, as indicated by the DXY at 98.58, puts downward pressure on Bitcoin. Historically, a stronger dollar tends to weigh on the price of Bitcoin, as it becomes more expensive for international investors to purchase. According to recent news, the oil price spike is lifting the US Dollar, which could further exacerbate the downward pressure on BTCUSD. If the DXY continues to rise, Bitcoin could face significant headwinds. The potential impact of upcoming USD data releases on Wednesday and Friday need to be closely monitored, as any positive surprises could further strengthen the dollar and weigh on Bitcoin.
Technicals as the Tiebreaker
Given the conflicting signals, technical analysis can provide crucial insights for traders. Examining the 1-hour chart, Bitcoin faces immediate resistance at $69,505. A break above this level could signal a continuation of the bullish trend, potentially targeting the next resistance at $69,849. The RSI on the 1-hour chart is at 62.79, indicating neutral conditions but trending upwards. This suggests that bulls are attempting to regain control, but they need to overcome the resistance at $69,505 to confirm their dominance.
Conversely, a break below the immediate support at $68,606 could trigger a further downside move, potentially targeting the next support level at $68,051. The Stochastic oscillator on the 1-hour chart shows a reading of K=58.1 and D=52.71, indicating a bullish signal with %K greater than %D. This suggests that the downside momentum may be limited, and a bounce off the support at $68,606 is possible. Long-term investors should keep an eye on the daily chart, as the overall trend remains bearish. A break above the resistance at $67,965 would be needed to confirm a trend reversal.
A multi-timeframe analysis reveals a mixed picture. The 1-hour and 4-hour charts show bullish signals, while the daily chart indicates bearish conditions. This suggests that short-term rallies are possible, but the overall trend remains downwards. Traders should therefore be cautious and wait for clear confirmation signals before entering any positions. The ADX on the 1-hour chart is at 31.37, indicative of a strong uptrend. However, the ADX on the daily timeframe is at 31.97, indicative of a strong downtrend. This divergence in ADX values further reinforces the need for caution and confirmation.
Correlation Analysis: DXY, SP500, and Oil
Understanding Bitcoin's correlation with other assets is crucial for making informed trading decisions. As mentioned earlier, the inverse relationship between Bitcoin and the DXY is a key factor to consider. With the DXY currently at 98.58, any further strengthening of the dollar could put downward pressure on BTCUSD. The SP500, currently at 6786.45, shows a positive correlation with Bitcoin during periods of risk appetite. However, this correlation can break down during times of market stress. Traders should therefore monitor the SP500 closely for any signs of weakness, as this could trigger a sell-off in Bitcoin.
Oil prices, particularly WTI crude at $85.07, can also influence Bitcoin through their impact on inflation expectations. Higher oil prices tend to lead to higher inflation, which can erode the purchasing power of fiat currencies and increase the demand for alternative assets like Bitcoin. However, the current drop of -6.16% in WTI crude oil suggests a decrease in inflation concerns, which could reduce the appeal of Bitcoin as an inflation hedge. The upcoming CPI data will be crucial in determining the impact of oil prices on Bitcoin and the overall market.
Trading Bitcoin involves significant risk. The price can be highly volatile and influenced by a wide range of factors, including regulatory developments, market sentiment, and macroeconomic events. Always manage your risk carefully and never invest more than you can afford to lose.
Trade Recommendation: Watch Zone
Given the conflicting signals and the high level of uncertainty, a WATCH_ZONE recommendation is appropriate for BTCUSD at its current price of $69,341. The market is at a critical juncture, and patience is likely to be rewarded. A daily close above $69,505 would open the door for a bullish continuation, potentially targeting the resistance at $69,849 and $70,404. Conversely, a daily close below $68,606 would signal a bearish breakdown, potentially leading to a test of the support at $68,051 and $67,707.
The key level to watch is the $69,505 resistance. If Bitcoin can decisively break above this level, it would suggest that bulls are back in control and a further rally is likely. However, if Bitcoin fails to break above this level and instead breaks below the $68,606 support, it would signal a bearish continuation. Traders should therefore wait for a clear breakout or breakdown before entering any positions. Scalpers, swing traders, and long-term investors all need to see confirmation of trend before committing capital.
Frequently Asked Questions: BTCUSD Analysis
Is BTCUSD a good buy right now?
At the current price of $69,341, BTCUSD is in a watch zone. A daily close above $69,505 would signal a potential buying opportunity, but caution is warranted until a clear breakout is confirmed.
What is the BTCUSD price forecast for this week?
The BTCUSD price forecast for this week is uncertain. A bullish scenario targets $69,849 and $70,404, while a bearish scenario eyes $68,051 and $67,707. Probability assessment is 50/50 until a breakout or breakdown occurs.
What are the key support and resistance levels for BTCUSD?
Key support levels for BTCUSD are $68,606, $68,051, and $67,707. Key resistance levels are $69,505, $69,849, and $70,404. These levels are based on 1-hour chart analysis.
Why is BTCUSD moving today?
BTCUSD is moving today due to a combination of technical factors and market sentiment. The bearish signal on the daily stochastic is countered by bullish signals on the 1-hour and 4-hour charts, leading to a volatile trading range.
Key Levels
Support Levels
Resistance Levels
Track markets in real-time
AI-powered analysis, technical indicators and real-time price data.
Join Our Telegram Channel
Breaking market news, AI analysis and trading signals instantly.
Join Channel