

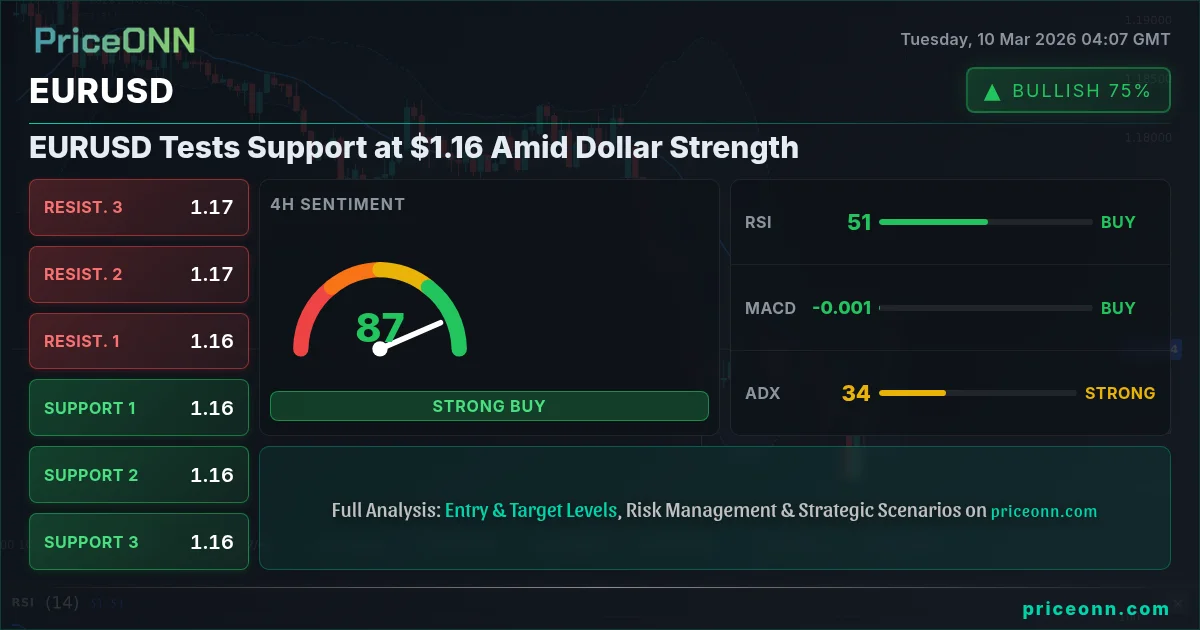
Can EURUSD maintain its footing around the $1.16 level? With the US Dollar Index (DXY) currently at 98.69 and showing signs of strength, the pressure is on. The question now is whether this support level will hold or if we're looking at a potential breakdown.
- EURUSD is testing a critical support level at $1.16 amid strengthening US Dollar.
- DXY at 98.69 exerts downward pressure on EURUSD, potentially leading to a breakdown.
- MACD on the daily timeframe shows negative momentum, suggesting further downside potential.
- Watch for a potential catalyst from Wednesday's EUR high importance event.
The EURUSD pair is currently trading at 1.16077, a slight dip from its daily high, and the bears appear to be testing the resolve of this key psychological level. A daily close below 1.16069 could signal further weakness, potentially opening the door for a move towards the next support area around 1.15943. Now this is where it gets interesting! This level has acted as a springboard in the past, but given the current market dynamics, it might not hold for long. The Australian Financial Review may well start publishing forecasts showing this level being breached soon.
One factor to consider is the overall macroeconomic environment. The recent surge in WTI crude oil, briefly exceeding $120 per barrel, has added to inflationary pressures, which in turn boosts the US Dollar's appeal. This is not just about oil prices, though; it's about the broader narrative of inflation and how central banks will respond. The macroeconomic factors march 2026 are all pointing toward an environment that favors dollar strength, at least in the short term.
From a technical perspective, the daily chart presents a mixed bag. While the RSI(14) is at 35.34, indicating oversold conditions, the MACD histogram remains in negative territory, suggesting that bearish momentum is still in play. This divergence between the RSI and MACD is a warning sign. It shows that buyers are trying to step in, but the underlying trend remains down. The ADX, at 28.17, confirms the presence of a strong downtrend, making any counter-trend rallies potentially short-lived.
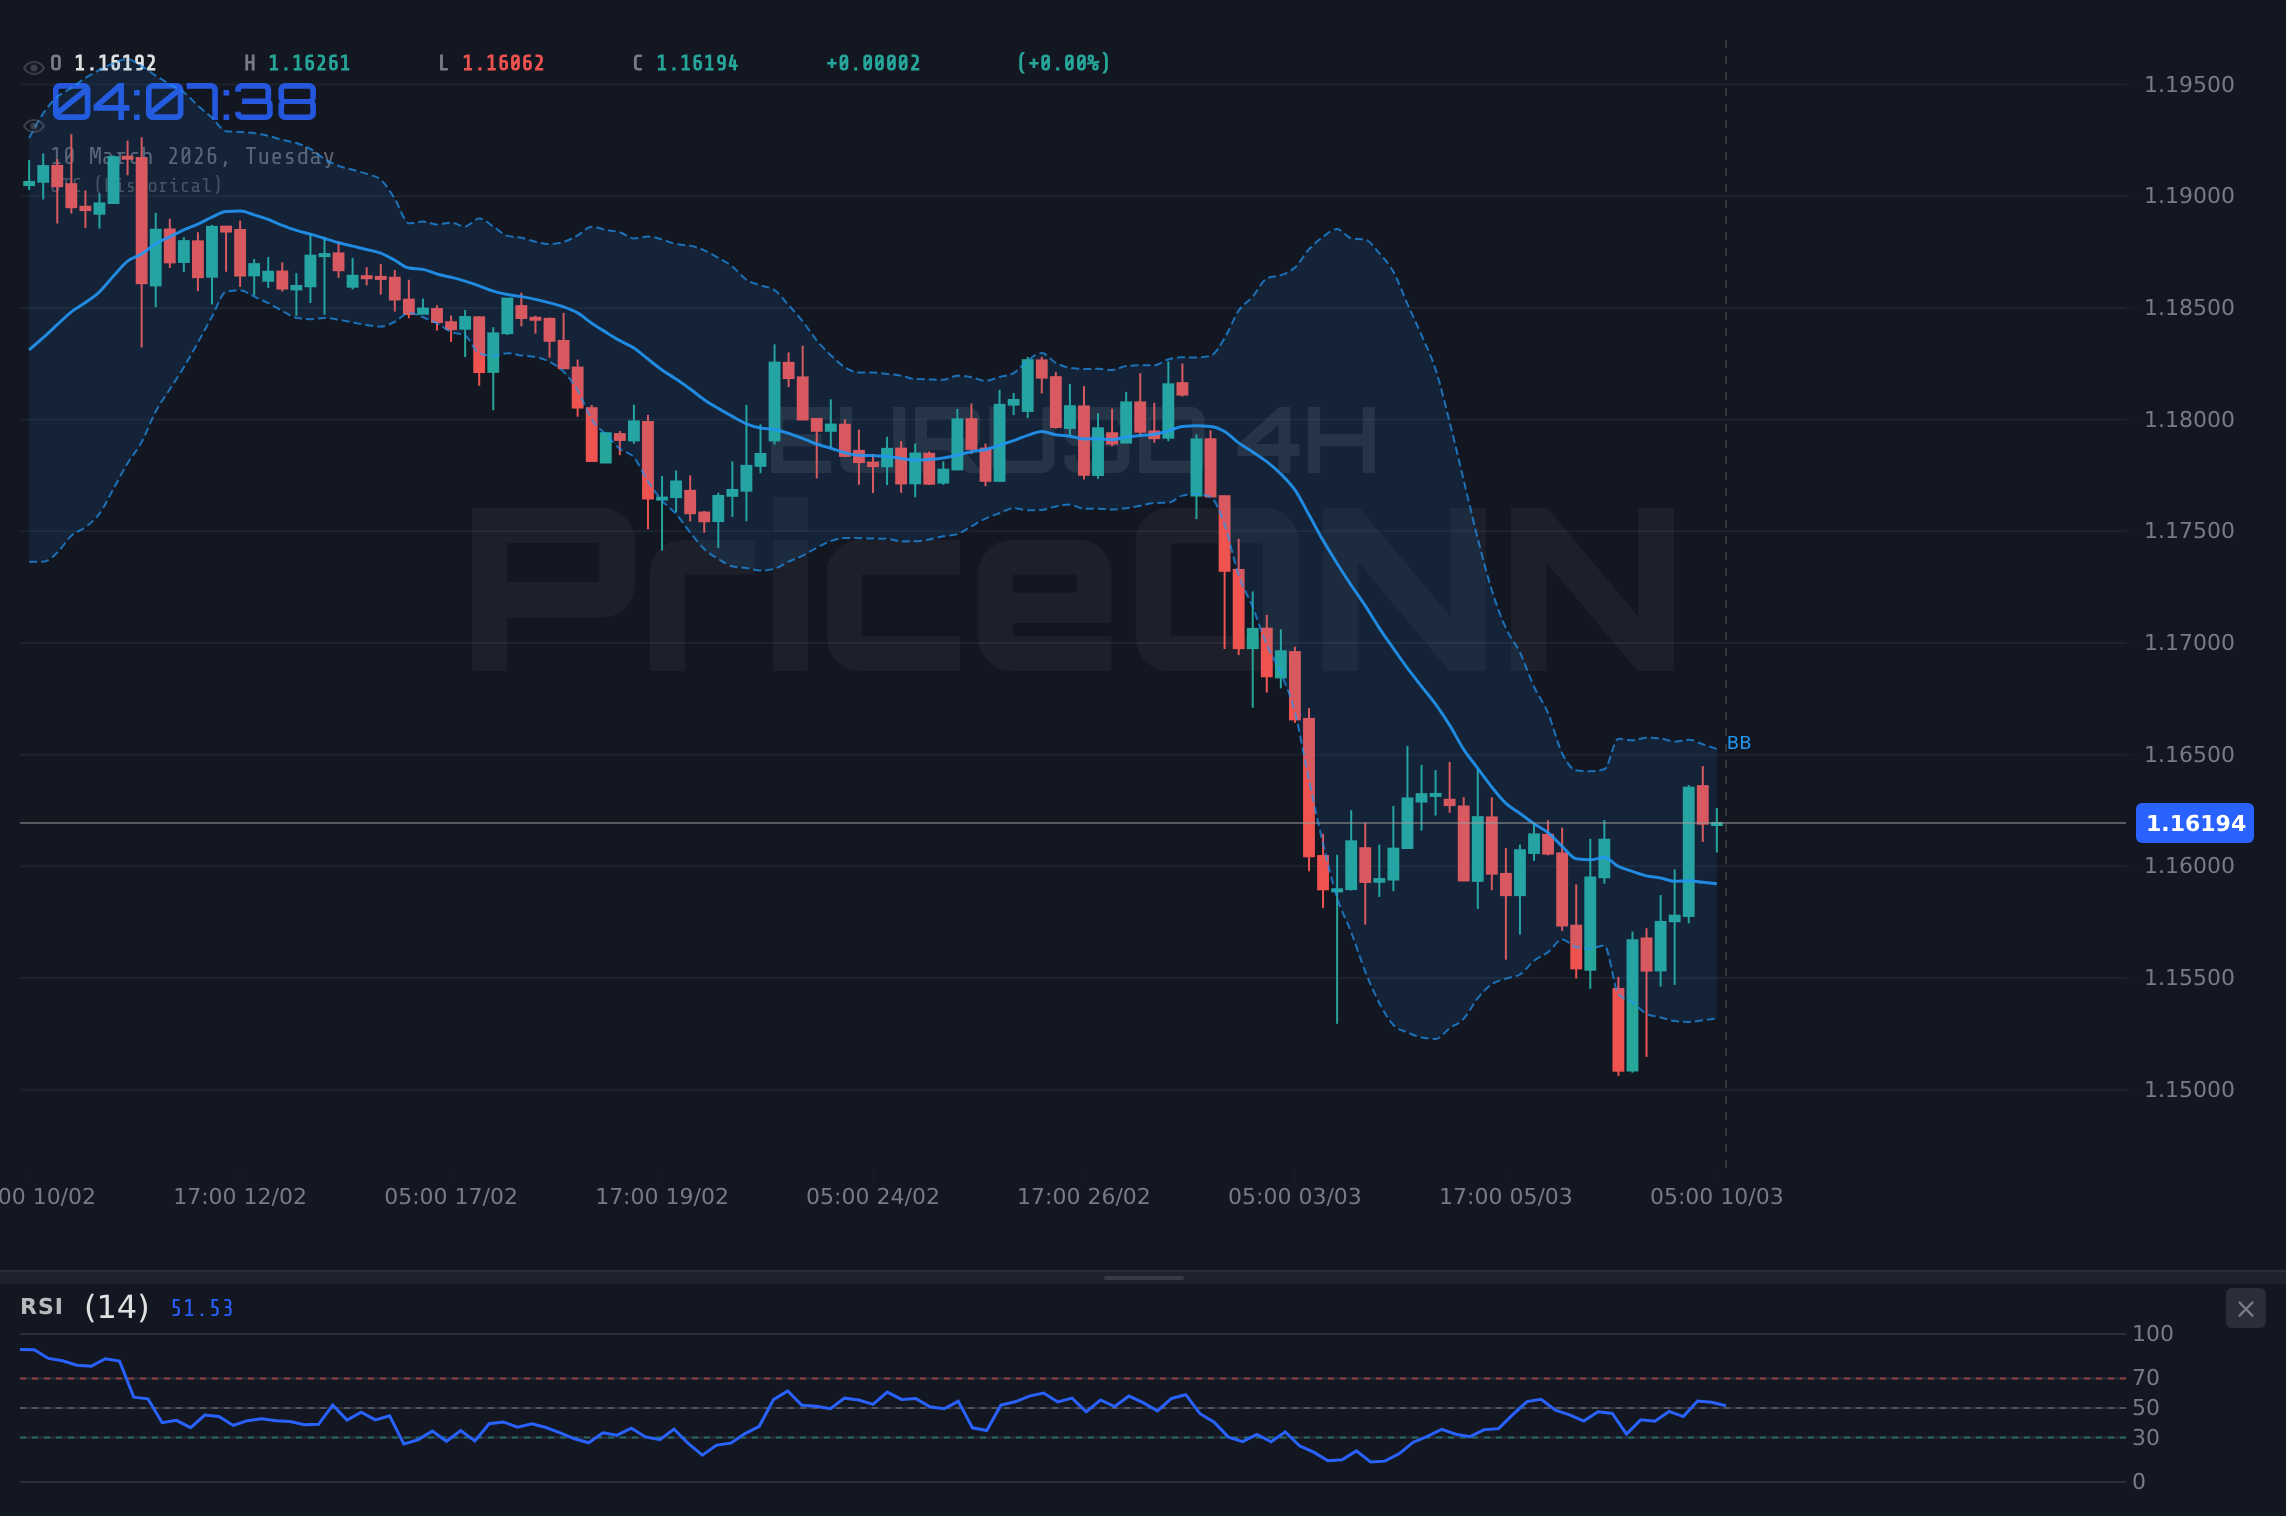
Looking at the shorter-term timeframes, the 1-hour chart shows EURUSD hovering around the 1.16069 support. The RSI(14) on this timeframe is at 55.34, suggesting that there is room for further downside movement. However, the Stochastic oscillator shows a potential bullish signal, with %K at 55.35 crossing above %D at 71.63. This could trigger a brief bounce, but the overall trend still favors the downside. The four hourly shows a similar picture. If we see the 1.15943 level broken, expect further downside.
The 4-hour chart paints a more bearish picture, with the ADX at 35.8, confirming a strong downtrend. The EURUSD macroeconomic factors march 2026 show limited upside potential. The first resistance sits at 1.16562. With the Stochastic oscillator (%K at 81.03, %D at 56.24) signaling an overbought condition, a pullback could be on the horizon. But that is not going to happen unless something changes. Look, this level is absolutely critical-
The upcoming economic calendar events also play a crucial role in shaping the EURUSD outlook. Wednesday's EUR high importance event will be closely watched by traders. If the data comes in weaker than expected, it could exacerbate the bearish pressure on EURUSD. Investors are also awaiting data on Wednesday, and another data release on Friday. The market sentiment around EURUSD remains cautious, with traders closely monitoring the key support levels and potential breakout opportunities.
Geopolitically, the ongoing turmoil in the Middle East continues to provide a bid for the US Dollar as investors seek safe-haven assets. As reported by Reuters, the conflict is adding to inflationary pressures, which further supports the dollar's strength. This flight to safety is weighing on risk assets, including the Euro. In fact the Middle East turmoil boosts US Dollar, according to recent reports, USD is the safe haven of choice.
Having tracked EURUSD through the 2024 rate cycle, I can tell you that sentiment can shift quickly, but the fundamentals are currently aligned for further downside. The key is to manage your risk and wait for the right setup. The market always gives a second chance. Patience looks like it will be rewarded here.
Now, let's talk about specific scenarios and what needs to happen for them to play out. A daily close below 1.16069 would open the door for a test of the next support at 1.15943. A break below that level would then target the 1.15535 level. On the upside, a sustained move above 1.16562 would be needed to negate the bearish outlook. But given the current strength of the dollar, that seems unlikely.
EURUSD manages to break above the 1.16562 resistance and holds, driven by a weaker-than-expected US economic data release. This could lead to a test of the 1.16773 level.
EURUSD breaks below the 1.16069 support, fueled by continued dollar strength and risk-off sentiment. The next target would be 1.15943, followed by 1.15535.
Until the NFP data resolves this, caution is warranted. However, I believe that the bears are in control, and we are likely to see further downside in EURUSD in the coming days. The daily trend shows a strong downtrend. The overall sentiment is bearish and until something changes, expect more downside action.
Frequently Asked Questions: EURUSD Analysis
What happens if EURUSD breaks below the 1.16069 support?
If EURUSD breaks below the 1.16069 support, the next target would be the 1.15943 level, which is the next level of support. A break below this level could then target 1.15535.
Should I sell EURUSD at current levels of 1.16077 given RSI at 35.34 on the daily chart?
While the RSI at 35.34 indicates oversold conditions, the overall trend still favors the downside. Selling here could be risky without further confirmation of a reversal. A better strategy might be to wait for a bounce and then look for shorting opportunities.
What does the MACD signal tell us about EURUSD trend analysis on the daily chart?
The MACD histogram on the daily chart is in negative territory, suggesting that bearish momentum is still in play. This confirms the presence of a strong downtrend, making any counter-trend rallies potentially short-lived.
How will Wednesday's EUR high importance event affect EURUSD this week?
Wednesday's EUR high importance event will be closely watched by traders. If the data comes in weaker than expected, it could exacerbate the bearish pressure on EURUSD and lead to further downside movement.
Technical Outlook Summary
| Indicator | Value | Signal |
|---|---|---|
| RSI (14) | 35.34 | Neutral |
| MACD Histogram | Negative | Bearish |
| Stochastic | 33.04 | Bullish |
| ADX | 28.17 | Strong Downtrend |
| Bollinger | Middle Band | Downtrend |
Key Levels
Support Levels
Resistance Levels
Track markets in real-time
AI-powered analysis, technical indicators and real-time price data.
Join Our Telegram Channel
Breaking market news, AI analysis and trading signals instantly.
Join Channel