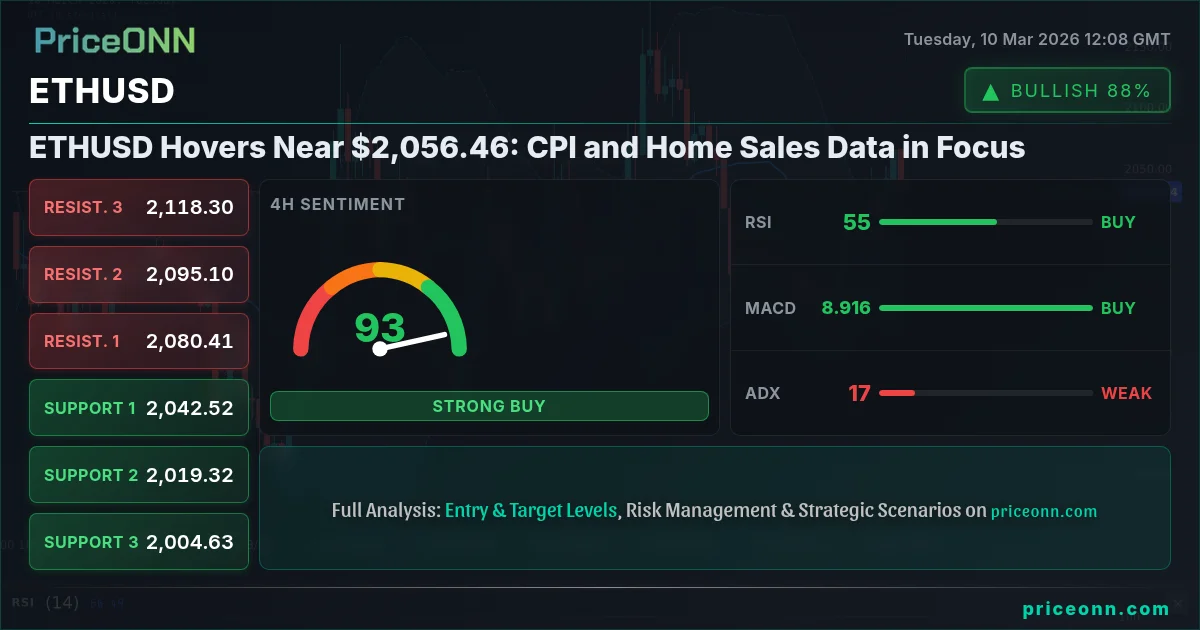
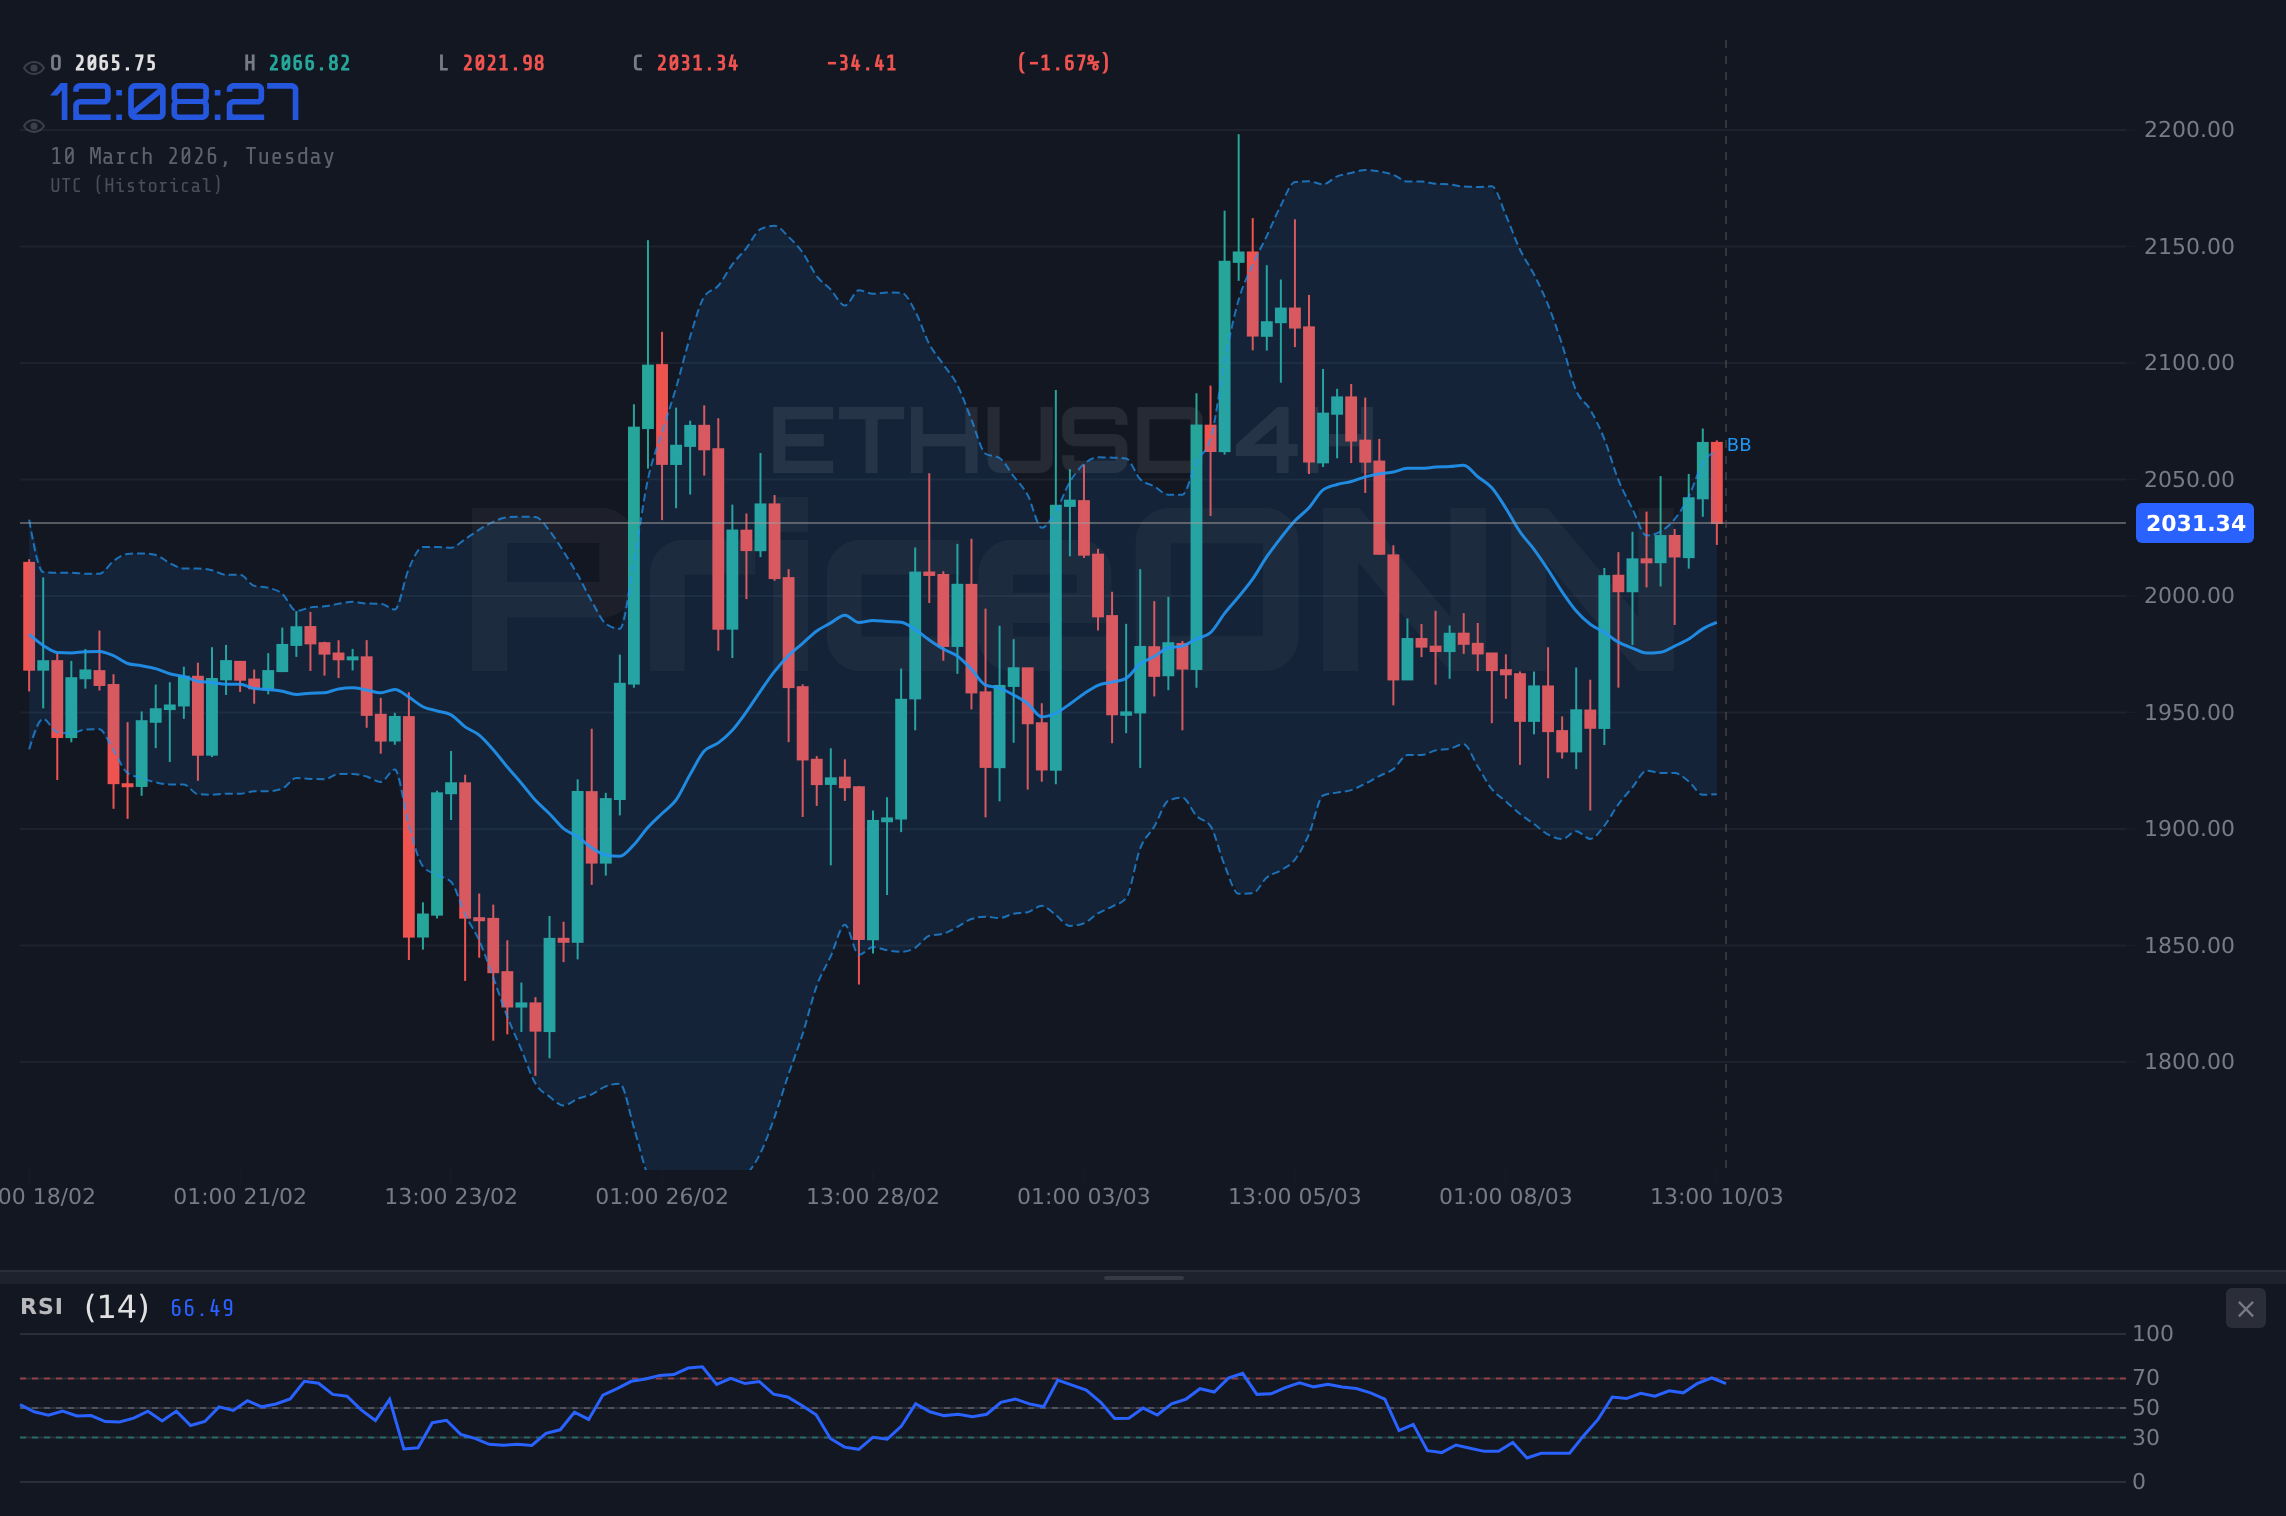
ETHUSD is currently trading near $2,056.46, a level that's proving to be a critical pivot point. The market is holding its breath ahead of key economic data releases, specifically CPI figures and home sales data, which are expected to inject volatility into the crypto markets. This analysis breaks down the potential scenarios that could unfold in the short and medium term, offering insights for both seasoned traders and those new to the ETHUSD landscape.
- RSI at 49.7 on the daily chart suggests neutral momentum, with potential for a breakout in either direction.
- Critical resistance sits at $2,082.19, a break above which could trigger a significant bullish rally.
- MACD histogram shows positive momentum building, but confirmation is needed.
- Upcoming CPI and home sales data are expected to be the primary drivers of ETHUSD volatility this week.
The Bull's Roadmap: Targeting $2,138
For the bullish scenario to materialize, ETHUSD needs to decisively break above the immediate resistance level of $2,082.19. This level has acted as a significant barrier in the past, and a sustained break above it would signal strong buying pressure. If this occurs, the next target for the bulls would be $2,138.64, a level that represents a key Fibonacci extension. A successful test of $2,138.64 could then open the door for a further rally towards $2,225.77. This bullish scenario is predicated on positive news flow regarding crypto adoption and a weaker-than-expected dollar, which would provide a tailwind for ETHUSD. The Stochastics on the 4H chart are showing overbought conditions with K=86.45, but the daily chart still shows room to run.
Scalpers looking to capitalize on this bullish move should watch for a break above $2,067.25 on the 1H chart, setting tight stops just below the breakout level. Swing traders may prefer to wait for a retest of $2,082.19 after the initial breakout before adding to their positions. Long-term investors might see this as an opportunity to accumulate ETHUSD at relatively attractive levels, with a long-term target of $2,500 and beyond. The ADX on the 1H chart is showing a strong upward trend with a value of 35.63, suggesting that the bullish momentum has legs.
Where Bears Take Control: A Slide Towards $1,938
Conversely, a bearish scenario would unfold if ETHUSD fails to sustain its current levels and breaks below the immediate support at $2,053.49 on the 1H chart. A breach of this support could trigger a cascade of sell orders, pushing the price down towards the next support level at $1,938.61. This level represents a significant area of confluence, with multiple moving averages converging around this price point. If $1,938.61 fails to hold, the bears could then target $1,851.48, a level that hasn't been tested since early 2026. This bearish scenario is most likely to occur if the upcoming economic data points to higher inflation and a more hawkish stance from the Federal Reserve, which would strengthen the dollar and put downward pressure on ETHUSD. The 1D RSI reading of 49.7 suggests there is further room for downside movement before ETHUSD becomes oversold.
Scalpers could look to short ETHUSD on a break below $2,053.49, targeting $2,046.40 as an initial profit target. Swing traders may wait for a confirmation of the breakdown below $2,053.49 before entering short positions, with a stop-loss order placed just above the breakout level. Long-term investors might view this as an opportunity to hedge their ETHUSD holdings or reduce their exposure to the crypto market altogether. The MACD on the daily chart is currently showing positive momentum, but a cross below the signal line would confirm the bearish trend.
The Waiting Game: Range-Bound Consolidation
A third possible scenario is a period of range-bound consolidation, where ETHUSD remains trapped between the support level of $2,053.49 and the resistance level of $2,082.19. In this scenario, the price action would be characterized by choppy, sideways movement, with neither the bulls nor the bears able to gain a decisive advantage. This range-bound scenario is most likely to occur if the upcoming economic data is mixed, providing no clear direction for the market. The ADX on the daily chart is currently at 26.29, indicating a lack of a strong trend, which supports this consolidation scenario.
Scalpers could attempt to profit from this range-bound movement by buying near the support level and selling near the resistance level, using tight stop-loss orders to manage their risk. Swing traders may choose to remain on the sidelines, waiting for a clear breakout or breakdown before entering a position. Long-term investors could use this period of consolidation to dollar-cost average into ETHUSD, gradually building their position over time.
Historically, ETHUSD has shown a tendency to consolidate after periods of high volatility, as the market digests the latest news and economic data. This consolidation phase can last for several weeks or even months, providing opportunities for patient traders to accumulate positions at favorable prices.
Correlation Analysis: DXY, Equities, and Oil
ETHUSD's price action is often correlated with movements in the dollar index (DXY), equity markets, and oil prices. A strengthening DXY, currently at 98.49, typically puts downward pressure on ETHUSD, as a stronger dollar makes it more expensive to purchase ETHUSD for international investors. Conversely, a weakening DXY can provide a tailwind for ETHUSD.
Equity markets, particularly the S&P 500 and Nasdaq 100, also play a role in ETHUSD's price action. A risk-off environment, characterized by a decline in equity prices, can lead to increased demand for safe-haven assets, potentially benefiting ETHUSD. Conversely, a risk-on environment, with rising equity prices, can lead to decreased demand for ETHUSD as investors shift their focus to higher-yielding assets. The S&P 500 is currently trading at 6775.85, while the Nasdaq 100 is at 24906.97, both indicating a slight downward trend.
Oil prices, particularly WTI crude oil, can also influence ETHUSD through their impact on inflation expectations. Rising oil prices can lead to higher inflation expectations, which can prompt the Federal Reserve to adopt a more hawkish stance, potentially strengthening the dollar and putting downward pressure on ETHUSD. WTI crude oil is currently trading at $89.45, indicating a strong upward trend.
What I'm Watching: Key Triggers This Week
This week, I'll be closely monitoring the upcoming CPI data and home sales data, both scheduled for release on Wednesday. These data points are expected to provide valuable insights into the state of the economy and the potential path of Federal Reserve policy. A stronger-than-expected CPI reading could lead to a more hawkish stance from the Fed, strengthening the dollar and putting downward pressure on ETHUSD. Conversely, a weaker-than-expected CPI reading could lead to a more dovish stance from the Fed, weakening the dollar and providing a tailwind for ETHUSD.
I'll also be watching for any significant developments in the geopolitical landscape, as these events can often trigger risk-off sentiment and lead to increased demand for safe-haven assets, potentially benefiting ETHUSD. Specifically, I'll be monitoring the ongoing conflict in the Middle East, as well as any signs of escalation in other geopolitical hotspots.
Finally, I'll be paying close attention to the technical indicators on the ETHUSD chart, particularly the RSI, MACD, and ADX. A break above $2,082.19 with strong volume and confirming signals from these indicators would signal a strong bullish trend, while a break below $2,053.49 with similar confirmation would signal a strong bearish trend.
| Scenario | Trigger | Target | Probability |
|---|---|---|---|
| Bullish | Break above $2,082.19 | $2,138.64 | 35% |
| Bearish | Break below $2,053.49 | $1,938.61 | 40% |
| Range-Bound | Stays between $2,053.49 and $2,082.19 | Sideways action | 25% |
Frequently Asked Questions: ETHUSD Analysis
What happens if ETHUSD breaks above $2,082.19 resistance?
A break above the $2,082.19 resistance level could signal a strong bullish trend, potentially leading to a rally towards the $2,138.64 target. This scenario is contingent on positive market sentiment and a weaker dollar.
Should I buy ETHUSD at current levels of $2,056.46 given the neutral RSI reading?
While the RSI at 49.7 suggests neutral momentum, it's prudent to wait for a clear breakout above $2,082.19 or a breakdown below $2,053.49 before initiating a position. This will help to confirm the direction of the trend and reduce the risk of being caught in a false breakout.
Is the positive MACD histogram a reliable buy signal for ETHUSD?
The positive MACD histogram indicates bullish momentum, but it's important to look for confirmation from other indicators and price action. A sustained break above $2,082.19 with increasing volume would provide further confidence in the bullish trend.
How will the upcoming CPI data affect ETHUSD this week?
A stronger-than-expected CPI reading could lead to a more hawkish stance from the Fed, strengthening the dollar and putting downward pressure on ETHUSD. Conversely, a weaker-than-expected CPI reading could lead to a more dovish stance from the Fed, weakening the dollar and providing a tailwind for ETHUSD.
- RSI at 49.7 on the daily chart suggests neutral momentum, with potential for a breakout in either direction.
- Critical resistance sits at $2,082.19, a break above which could trigger a significant bullish rally.
- MACD histogram shows positive momentum building, but confirmation is needed.
- Upcoming CPI and home sales data are expected to be the primary drivers of ETHUSD volatility this week.
Track markets in real-time
AI-powered analysis, technical indicators and real-time price data.
Join Our Telegram Channel
Breaking market news, AI analysis and trading signals instantly.
Join Channel