

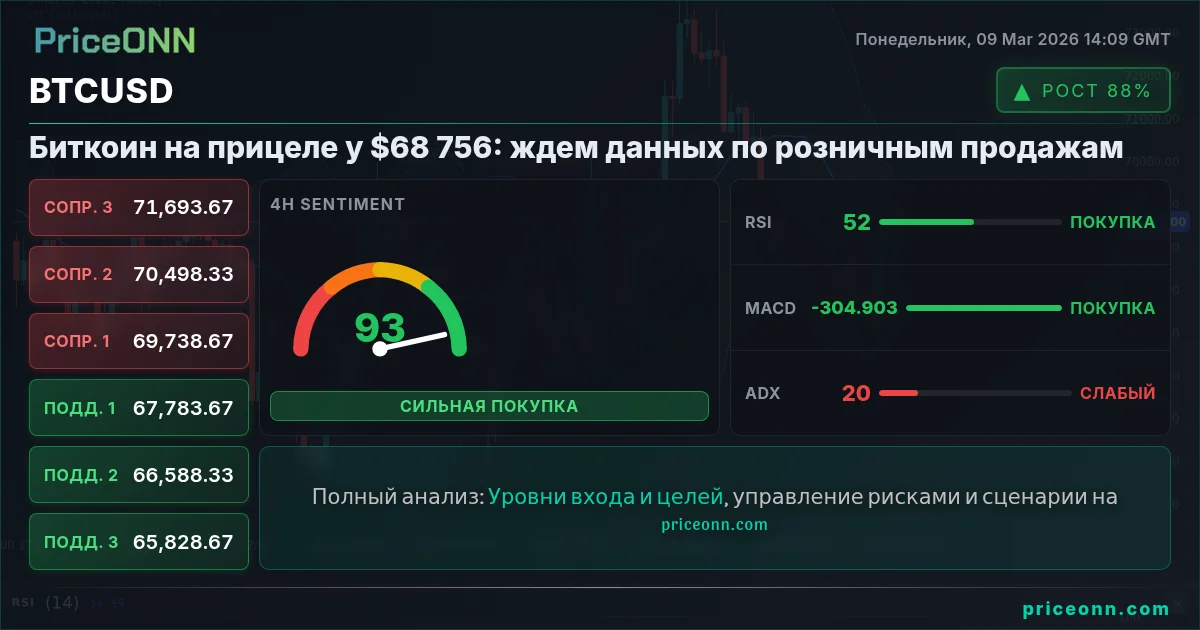
Ценовое движение Биткоина в районе $68 756 привлекает внимание, поскольку трейдеры готовятся к влиянию предстоящих данных по розничным продажам. Главный вопрос: смогут ли текущие уровни институционального спроса на биткоин в 2026 году выдержать потенциальные экономические встречные ветры? Сейчас самое время для анализа биткоин сегодня.
- RSI на уровне 48.29 предполагает нейтральный импульс, указывая на потенциальную нерешительность на рынке.
- Критический уровень сопротивления на $68 907 необходимо пробить для дальнейшего роста.
- Stochastic на уровне 39.1 сигнализирует о потенциальном медвежьем движении в краткосрочной перспективе.
- Предстоящие данные по розничным продажам могут существенно повлиять на корреляцию BTCUSD с DXY.
Криптовалютный рынок, и в частности Биткоин, внимательно следит за макроэкономическими индикаторами. В центре внимания сейчас данные по розничным продажам, ключевой барометр потребительских расходов и экономического здоровья. Сильные показатели розничных продаж могут сигнализировать о сильной экономике, потенциально приводя к усилению инфляционного давления. Это, в свою очередь, может побудить центральные банки поддерживать или даже ужесточать свою денежно-кредитную политику, что может негативно повлиять на рисковые активы, такие как Биткоин. И наоборот, более слабые, чем ожидалось, данные по розничным продажам могут свидетельствовать о замедлении экономики, потенциально приводя к более мягкой денежно-кредитной политике и обеспечивая поддержку Биткоину.
С технической точки зрения, BTCUSD today analysis показывает смешанную картину. 1D график показывает нисходящий тренд с силой 91%, в то время как 4H и 1H графики нейтральны. Текущая цена в $68 756 находится между уровнем поддержки $66 319 и уровнем сопротивления $68 907 на дневном таймфрейме. ADX на дневном таймфрейме находится на уровне 32.05, указывая на сильный нисходящий тренд. Дневной RSI на уровне 48.29 находится в нейтральной зоне, предполагая, что рынок не перекуплен и не перепродан. Гистограмма MACD показывает положительный импульс, но линия MACD все еще ниже сигнальной линии, указывая на то, что медвежий тренд еще не закончился. Осциллятор stochastic находится на уровне 39.1, указывая на потенциальное медвежье движение в краткосрочной перспективе.
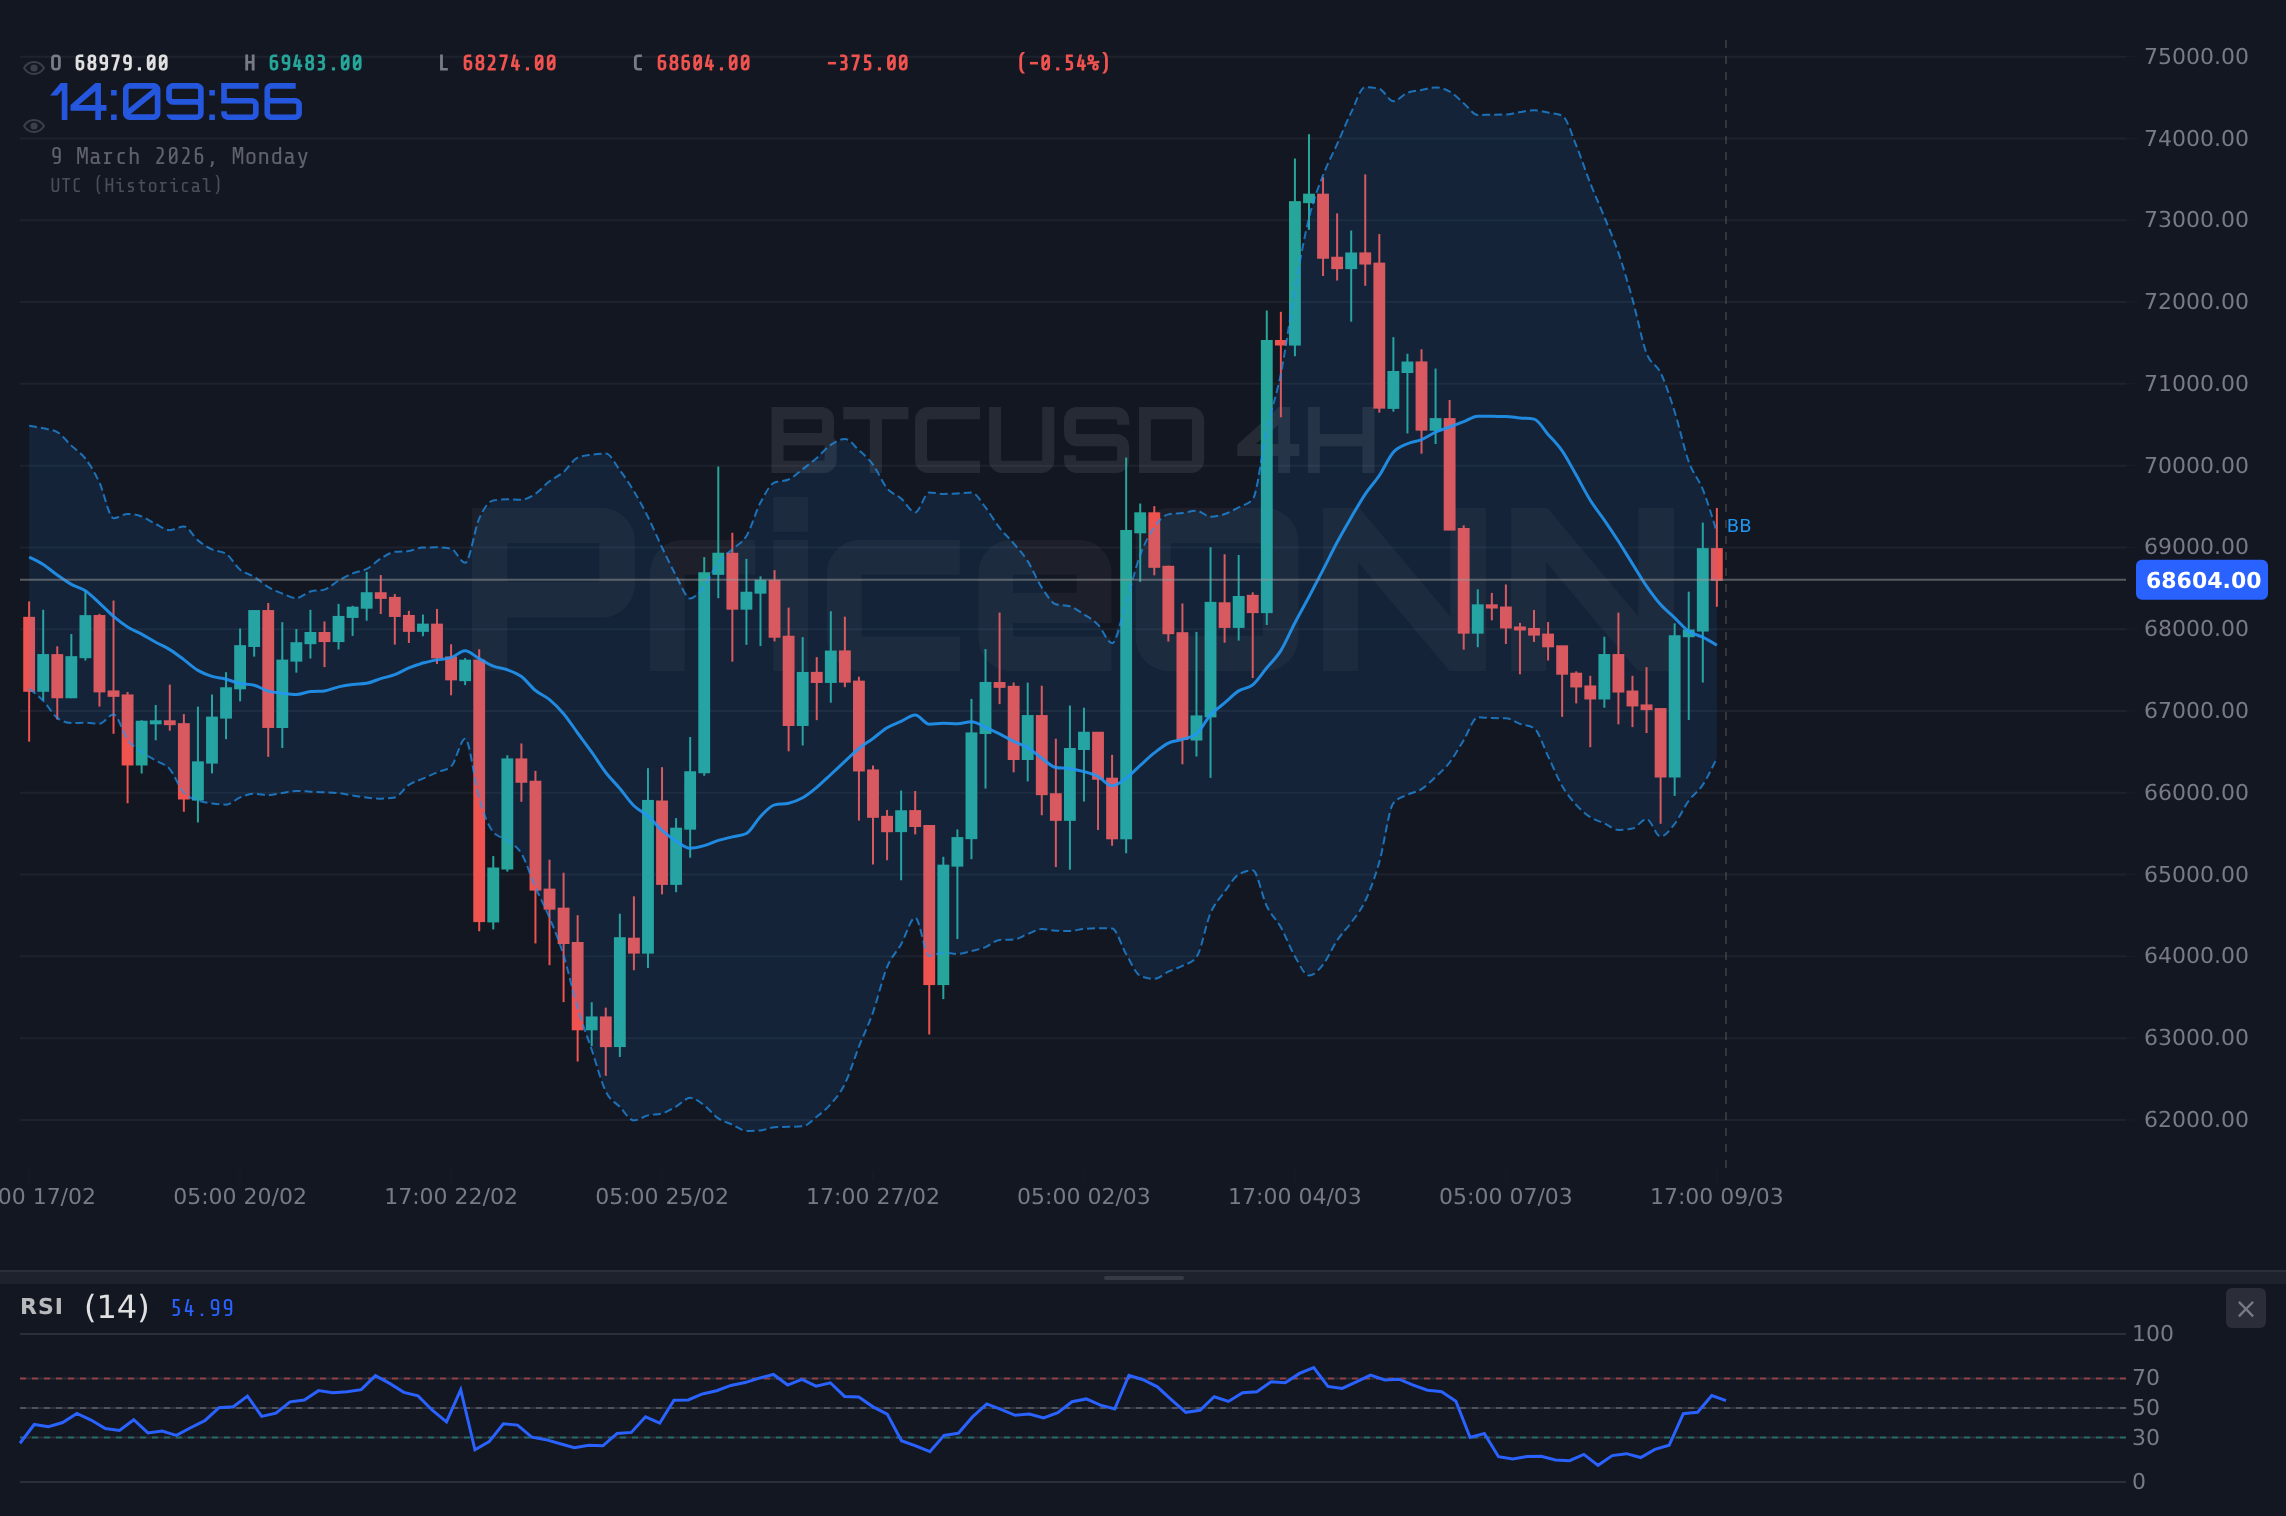
Институциональный спрос на Биткоин в 2026 году был значительным фактором в росте его цены. Крупные институциональные инвесторы выделяли капитал в Биткоин в качестве хеджа против инфляции и как средство сохранения стоимости. Однако этот спрос может быть проверен, если макроэкономические условия ухудшатся. Снижение аппетита к риску, вызванное негативными данными по розничным продажам, может привести к тому, что институциональные инвесторы сократят свою подверженность Биткоину и другим рисковым активам. Важно отметить, что, хотя институциональный спрос был мощной силой, он не застрахован от макроэкономических препятствий.
Глядя на более широкий рыночный контекст, DXY (индекс доллара) в настоящее время находится на уровне 99.09 и имеет тенденцию к росту. Эта сила DXY часто оказывает давление на активы, такие как Биткоин, которые оцениваются в долларах. SP500 сегодня снизился на 1.34%, сигнализируя о потенциальном снижении аппетита к риску. Это неприятие риска может еще больше повлиять на цену Биткоина. Новости Forex указывают на то, что нефтяной кризис, вызванный напряженностью на Ближнем Востоке, посылает ударные волны через валютные рынки. Пара EUR/CAD сталкивается со значительным понижательным давлением, поскольку глобальный нефтяной кризис усиливает экономические различия между экономиками.
Краткосрочный прогноз для BTCUSD зависит от публикации данных по розничным продажам. Сильные данные могут привести к повторному тестированию уровня сопротивления $67 965, в то время как слабые данные могут спровоцировать движение к уровню поддержки $66 319. Среднесрочный прогноз будет зависеть от общей макроэкономической среды и сохраняющейся силы институционального спроса. Дневное закрытие выше $68 907 откроет дверь для потенциального тестирования уровня сопротивления $69 611. И наоборот, дневное закрытие ниже $66 319 может привести к движению к уровню поддержки $65 615.
Несколько технических индикаторов предлагают подсказки о следующем движении Биткоина. Часовой RSI находится на уровне 64.71, предполагая, что рынок приближается к условиям перекупленности. Часовой MACD положителен, указывая на бычий импульс. Однако часовой Stochastic сигнализирует о потенциальном медвежьем движении. ADX на уровне 25.75 предполагает сильный восходящий тренд. Четырехчасовой RSI находится на уровне 53.83, указывая на нейтральный импульс. Четырехчасовой MACD положителен, указывая на бычий импульс. Четырехчасовой Stochastic сигнализирует о потенциальном бычьем движении. Дневной RSI находится на уровне 48.29, указывая на нейтральный импульс. Дневной MACD положителен, указывая на бычий импульс. Дневной Stochastic сигнализирует о потенциальном медвежьем движении.
Отслеживая BTCUSD на протяжении цикла ставок 2024 года, становится ясно, что на цену Биткоина сильно влияют как технические факторы, так и макроэкономические события. Исторически, когда RSI достигает этой зоны на BTCUSD, исход был различным, но коррекция часто наблюдается вскоре после этого. Этот паттерн в последний раз появлялся в ноябре 2025 года, когда цена впоследствии откатилась на 8% в течение недели. С DXY на уровне 99.09, BTCUSD находится под давлением.
Для трейдеров ключевыми уровнями для наблюдения являются поддержка $66 319 и сопротивление $68 907. Прорыв выше уровня сопротивления может сигнализировать о продолжении восходящего тренда, в то время как прорыв ниже уровня поддержки может сигнализировать о развороте тренда. Скальперы могут попытаться извлечь выгоду из краткосрочных ценовых движений в пределах текущего диапазона, в то время как свинг-трейдеры могут дождаться четкого прорыва или пробоя, прежде чем открывать позицию. Долгосрочные инвесторы могут рассматривать любые откаты как возможности для покупки, при условии, что общая макроэкономическая среда остается благоприятной.
По данным Reuters, представители ФРС подчеркнули, что инфляция остается "упорной", что может повлиять на их предстоящие политические решения. Эта ястребиная позиция может еще больше укрепить доллар и оказать давление на цену Биткоина. Данные Bloomberg показывают, что институциональные инвесторы внимательно следят за публикацией данных по розничным продажам, и многие готовы скорректировать свои позиции в зависимости от результата. Последний отчет о занятости показывает значительное замедление на рынке труда США, с сокращением числа занятых в несельскохозяйственном секторе и ростом числа заявок на пособие по безработице. Это потенциально может привести к тому, что ФРС примет более мягкую позицию, что может быть бычьим сигналом для Биткоина.
Общий технический сигнал для BTCUSD в настоящее время является смешанным. Часовой таймфрейм является бычьим, в то время как четырехчасовой и дневной таймфреймы являются медвежьими. Это говорит о том, что рынок находится в состоянии нерешительности и что прорыв или пробой может произойти в ближайшее время. Ключевыми уровнями для наблюдения являются поддержка $66 319 и сопротивление $68 907. Прорыв выше уровня сопротивления может привести к тестированию уровня сопротивления $69 611, в то время как прорыв ниже уровня поддержки может привести к тестированию уровня поддержки $65 615. Предстоящая публикация данных по розничным продажам может стать катализатором, который спровоцирует прорыв или пробой.
Учитывая противоречивые сигналы и неопределенность, окружающую публикацию данных по розничным продажам, рекомендуемое торговое решение - оставаться в WATCH_ZONE. Дневное закрытие выше $68 907 откроет дверь для потенциального тестирования уровня сопротивления $69 611. Управляйте своим риском, ждите своей установки - рынок всегда дает второй шанс.
Часто задаваемые вопросы: Анализ BTCUSD
Стоит ли сейчас покупать BTCUSD?
BTCUSD в настоящее время торгуется около $68 756 со смешанными сигналами. Учитывая неопределенность, окружающую предстоящие данные по розничным продажам, и противоречивые технические индикаторы, целесообразно дождаться четкого прорыва выше $68 907 или пробоя ниже $66 319, прежде чем рассматривать возможность открытия позиции на покупку.
Каков прогноз цены BTCUSD на эту неделю?
Прогноз цены BTCUSD на эту неделю сильно зависит от публикации данных по розничным продажам. Сильные данные могут подтолкнуть цену к $69 611, в то время как слабые данные могут привести к снижению к $65 615. Вероятность любого из этих сценариев на данный момент составляет примерно 50/50.
Каковы ключевые уровни поддержки и сопротивления для BTCUSD?
Ключевые уровни поддержки для BTCUSD: $66 319, $65 615 и $64 673. Ключевые уровни сопротивления: $68 907, $69 611 и $67 965. Эти уровни получены из дневного таймфрейма и представляют собой потенциальные области давления покупателей или продавцов.
Почему BTCUSD движется сегодня?
BTCUSD движется в первую очередь из-за ожидания предстоящих данных по розничным продажам и их потенциального влияния на политику Федеральной резервной системы. Сильные данные могут привести к более ястребиной позиции ФРС, в то время как слабые данные могут привести к более мягкой позиции ФРС.
Отслеживайте рынки в реальном времени
ИИ-анализ и данные в реальном времени.