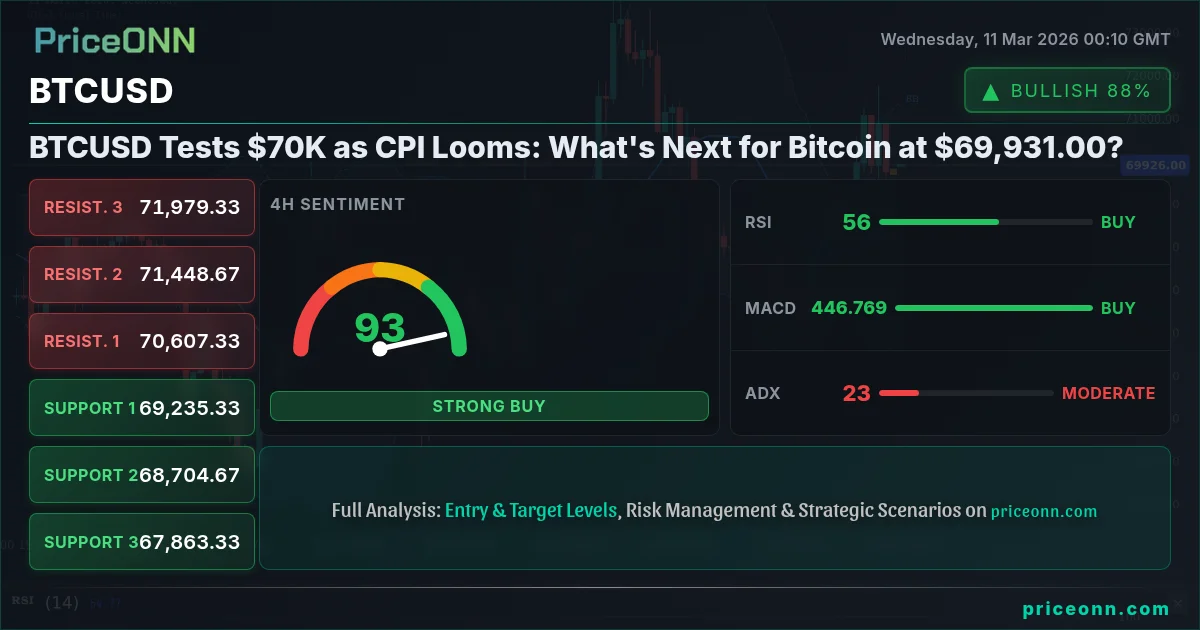
Bitcoin (BTCUSD) is currently navigating a critical juncture, hovering near the $70,000 level and trading at $69,931.00. The cryptocurrency's next move hinges on a confluence of factors, including overall market sentiment and the looming Consumer Price Index (CPI) data release. This article delves into the technical landscape of BTCUSD, analyzing key indicators and potential trade scenarios to equip traders with actionable insights.
- RSI at 49.82 on the 1H chart suggests waning bullish momentum, indicating a potential pullback.
- Key support lies at $69,498.33, a level that needs to hold to prevent further downside.
- A daily close above $70,419.67 resistance could signal a continuation of the upward trend.
- Upcoming US CPI data could significantly impact BTCUSD, depending on inflation expectations.
Navigating Bitcoin's Price Action: A Technical Deep Dive
The immediate outlook for Bitcoin presents a mixed picture. On the 1-hour timeframe, the trend is neutral, with an RSI of 49.82 indicating a potential for further downside. The MACD histogram is also showing negative momentum, suggesting that sellers might be gaining some traction. However, the 4-hour chart paints a slightly more optimistic picture. Although the trend is also neutral, the RSI sits at 55.54, which is in the neutral zone but leaning towards bullish territory. The MACD shows positive momentum on this timeframe, indicating potential for upward movement.
Looking at the daily timeframe, the trend is bearish, with an ADX of 30.04 indicating a strong trend. However, the RSI is at 50.61, which is in the neutral zone, and the MACD shows positive momentum. This divergence between the trend and momentum indicators suggests that the bearish trend might be losing steam.
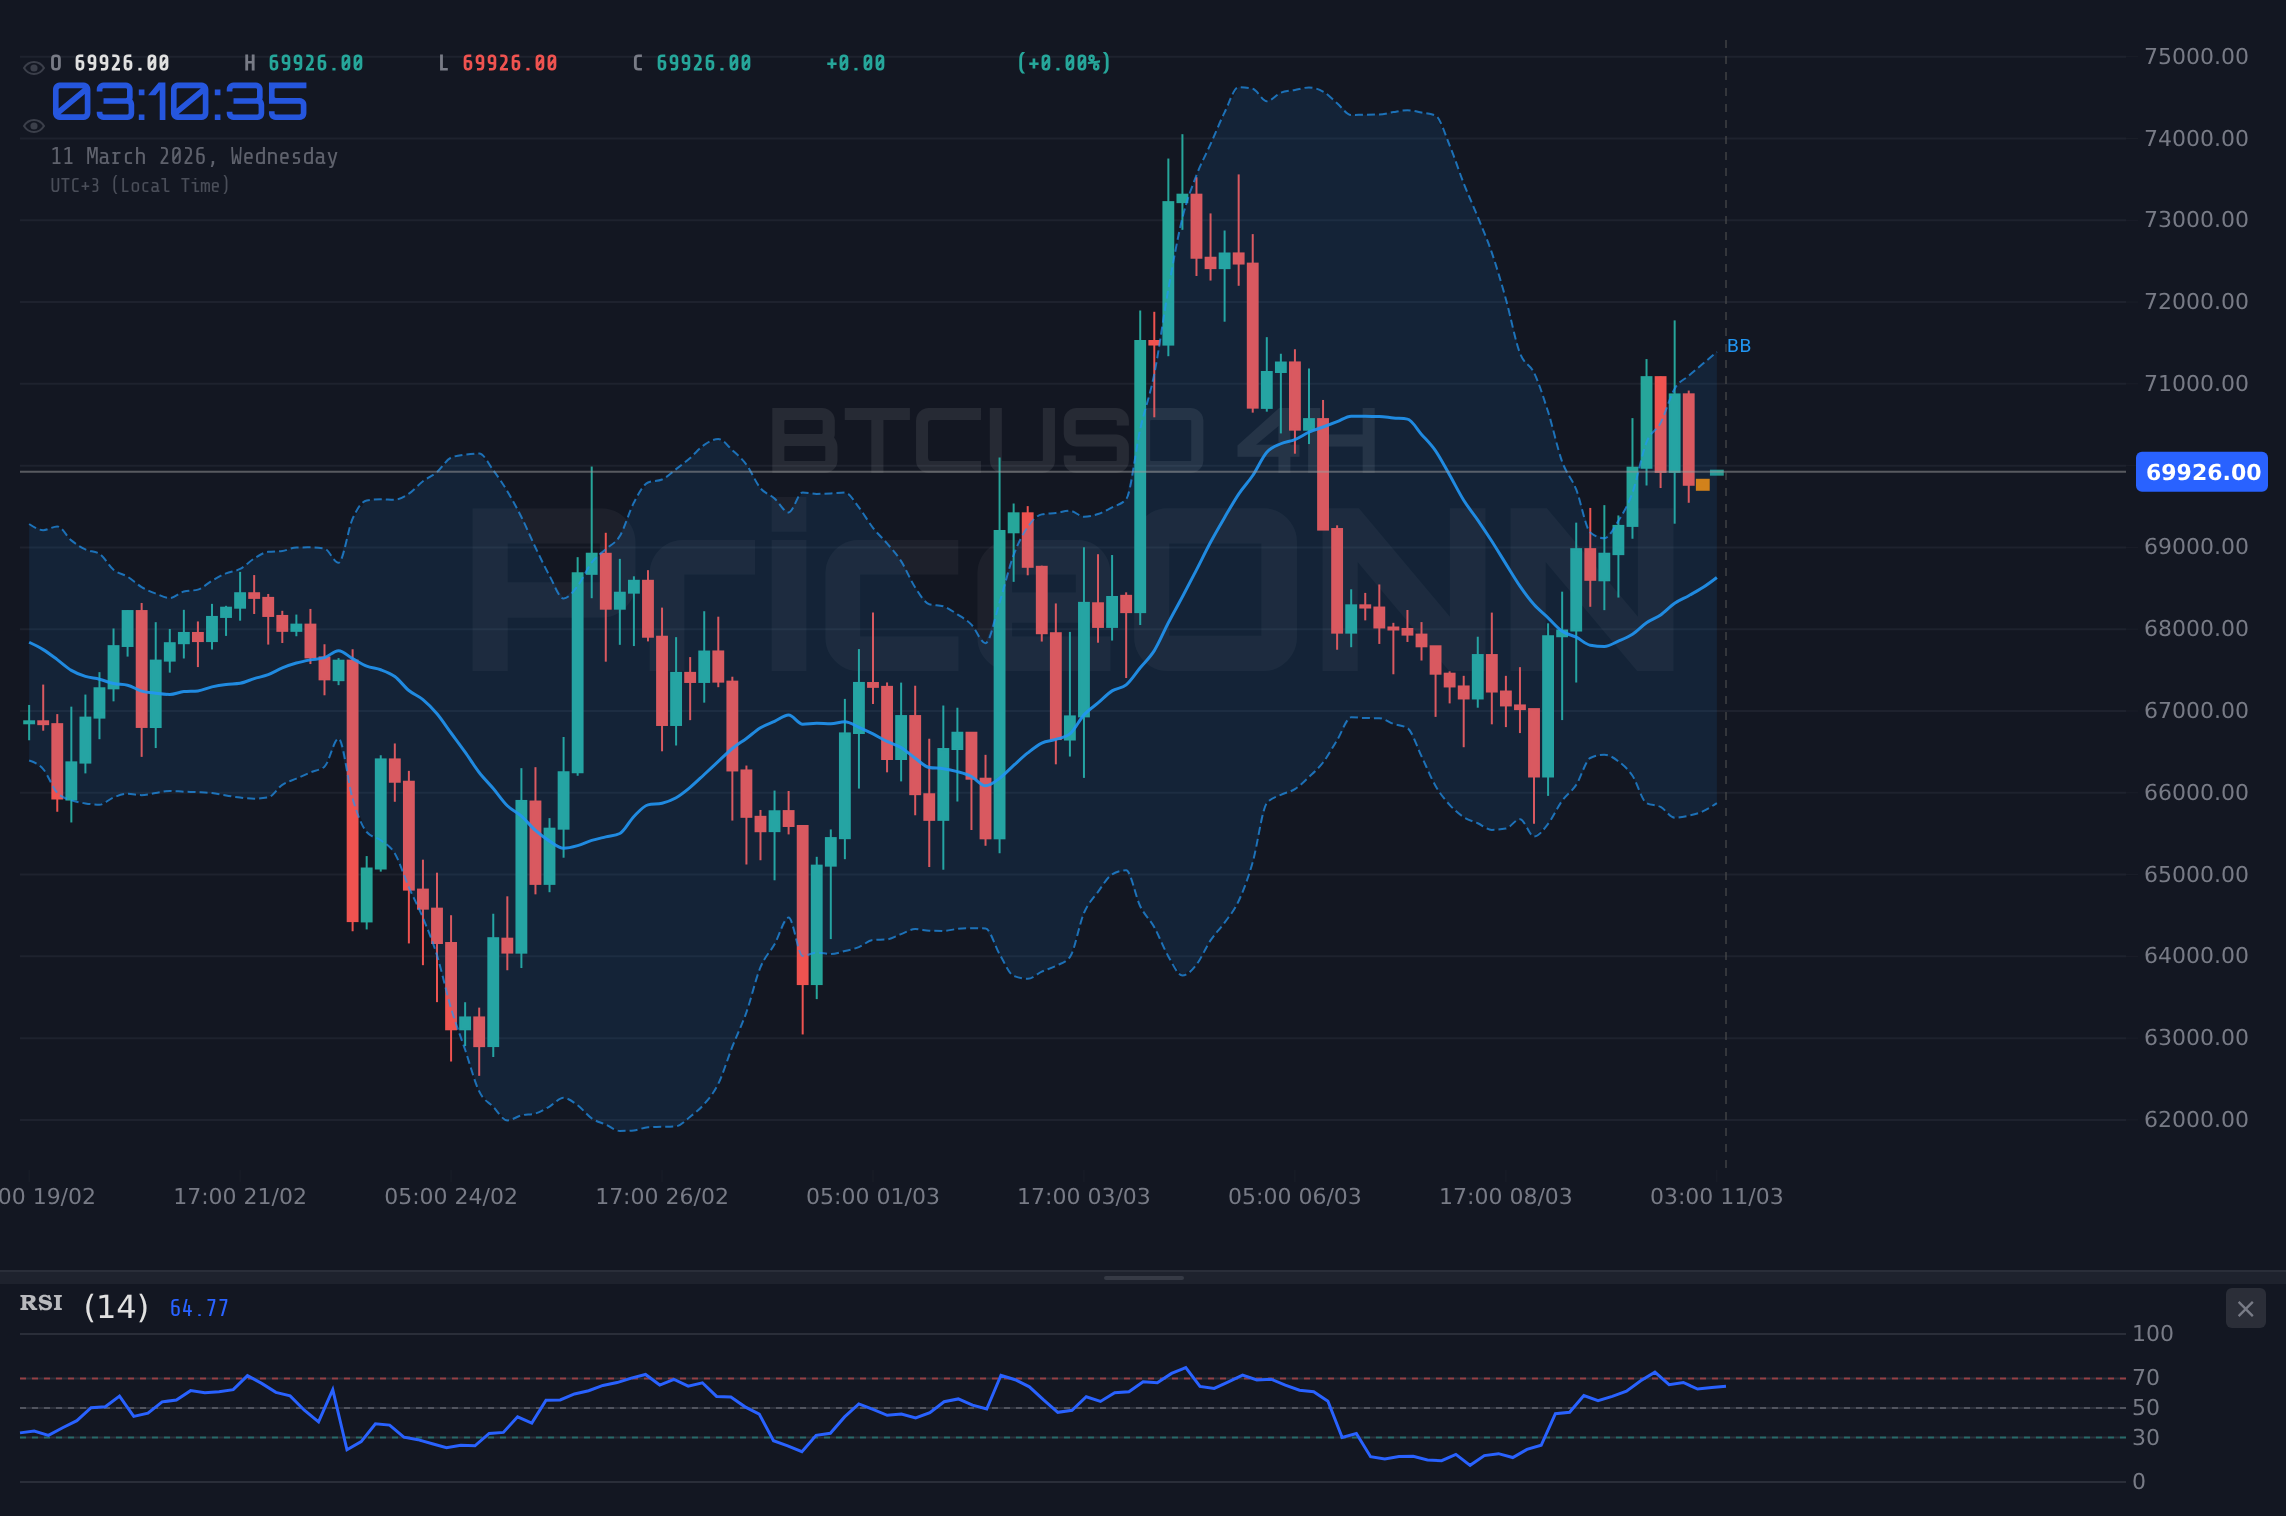
Zooming out on the 4H chart, resistance is observed at $72,001.33. A breakout above this level could potentially open the door for a test of $73,131.67 and $74,487.33, respectively. However, failure to break $72,001.33 could lead to a retest of the support levels. The Stochastic indicator on the 4H chart reads K=71.33 and D=84.59, suggesting the asset is not overbought, giving it room to run.
On the downside, immediate support can be found at $69,498.33. This level has been tested multiple times in the past few days and has held firm. A break below this level could trigger a selloff towards $69,272.67 and $69,085.33. The ADX on the 1H chart is at 29.11, signaling a strong downtrend. This indicator suggests that the price could continue to move lower in the short term.
The daily chart shows Bitcoin is trending downwards with an ADX of 30.04, a strong trend. Critical support sits at $66,523.67. If the price were to fall below this level, further downside movement would be expected. Bitcoin also has resistance at $70,419.67. If the price breaks this level, further upside movement can be expected.
Deciphering On-Chain Metrics and Crypto-Specific Fundamentals
Beyond technical analysis, several crypto-specific factors could influence BTCUSD's trajectory. One key metric is Bitcoin's hash rate, which reflects the network's computational power and security. A rising hash rate typically indicates greater confidence in the network and can be a bullish signal. Monitoring active addresses can provide insights into network usage and adoption trends. An increase in active addresses suggests growing demand for Bitcoin, while a decline could indicate waning interest.
Whale movements, referring to large Bitcoin holders transferring significant amounts of BTC, can also impact prices. Large inflows into exchanges often signal potential selling pressure, while outflows might suggest accumulation and bullish sentiment. Institutional adoption trends, such as the launch of Bitcoin ETFs, are another important factor. Increased institutional participation can provide greater liquidity and stability to the Bitcoin market.
Developments within the DeFi and NFT ecosystems can also influence Bitcoin's price. For example, the increasing integration of Bitcoin into DeFi platforms could drive demand for BTC. Regulatory news, such as potential restrictions or approvals of Bitcoin-related activities, can also have a significant impact on market sentiment.
The Looming CPI Data Release: A Potential Catalyst
The upcoming US CPI data release is poised to be a major catalyst for BTCUSD. Inflation figures significantly impact the Federal Reserve's monetary policy decisions, which, in turn, can influence risk appetite and asset valuations. A higher-than-expected CPI reading could prompt the Fed to adopt a more hawkish stance, potentially leading to higher interest rates and a stronger dollar. This scenario could put downward pressure on Bitcoin, as investors might shift towards less risky assets.
Conversely, a lower-than-expected CPI reading could suggest that inflationary pressures are easing, potentially giving the Fed room to maintain its current monetary policy stance or even consider easing measures. This scenario could be bullish for Bitcoin, as it might boost risk appetite and weaken the dollar. It's important to note that the market's reaction to the CPI data will also depend on expectations and positioning. If the market has already priced in a certain level of inflation, the actual data release might have a limited impact.
According to Reuters, "Fed officials have emphasized that future rate decisions will be data-dependent, with inflation figures playing a crucial role." Therefore, traders should closely monitor the CPI data and the Fed's subsequent commentary to gauge the potential impact on BTCUSD.
BTCUSD: Navigating the Watch Zone
Given the conflicting signals and the uncertainty surrounding the CPI data release, a watch zone approach appears prudent for BTCUSD. A daily close above $70,419.67 resistance would open the door for a potential test of the $72,001.33 level. Conversely, a break below $69,498.33 support could trigger a selloff towards lower support levels.
Traders should carefully monitor price action around these key levels and wait for confirmation before initiating any new positions. Patience will be rewarded here, manage your risk and wait for your setup- the market always gives a second chance. Consider that with the DXY at 98.7, BTCUSD is under some pressure. A strengthening dollar often leads to a decline in Bitcoin's price, due to inverse correlation.
Frequently Asked Questions: BTCUSD Analysis
What happens if BTCUSD breaks above $70,419.67 resistance?
A break above $70,419.67 resistance could signal a continuation of the upward trend, potentially opening the door for a test of the $72,001.33 level. Traders should watch for increased volume and momentum to confirm the breakout.
Should I buy BTCUSD at current levels of $69,931.00 given RSI at 49.82 on the 1H chart?
With the RSI at 49.82 on the 1H chart, it's not advisable to buy at these levels. The RSI signals waning bullish momentum, indicating a potential pullback. It's best to wait for a clearer bullish signal or a retest of support before entering a long position.
Is MACD positive momentum on the daily chart a reliable buy signal for BTCUSD?
While the MACD shows positive momentum on the daily chart, it's important to consider other factors, such as the overall bearish trend and the upcoming CPI data release. A more conservative approach would be to wait for a confirmation of the bullish signal from other indicators or a break above key resistance levels.
How will the upcoming US CPI data affect BTCUSD this week?
The upcoming US CPI data could significantly impact BTCUSD, depending on inflation expectations. A higher-than-expected CPI reading could prompt the Fed to adopt a more hawkish stance, potentially leading to a stronger dollar and downward pressure on Bitcoin. Conversely, a lower-than-expected CPI reading could be bullish for Bitcoin.
Technical Outlook Summary
| Indicator | Value | Signal |
|---|---|---|
| RSI (14) | 50.61 | Neutral |
| MACD Histogram | Positive | Bullish |
| Stochastic | 44.42 | Bearish |
| ADX | 30.04 | Strong Trend |
| Bollinger | Middle Band | Watch |
Key Levels
Support Levels
Resistance Levels
Track markets in real-time
AI-powered analysis, technical indicators and real-time price data.
Join Our Telegram Channel
Breaking market news, AI analysis and trading signals instantly.
Join Channel