As ETHUSD hovers around $2,037.94, the cryptocurrency is facing a critical juncture. Will it successfully breach the $2,082 resistance, or will it succumb to bearish pressures? The upcoming CPI data release looms large, potentially dictating the short-term direction of this pair.
- ETHUSD is currently trading at $2,037.94, showing a 0.6% daily gain.
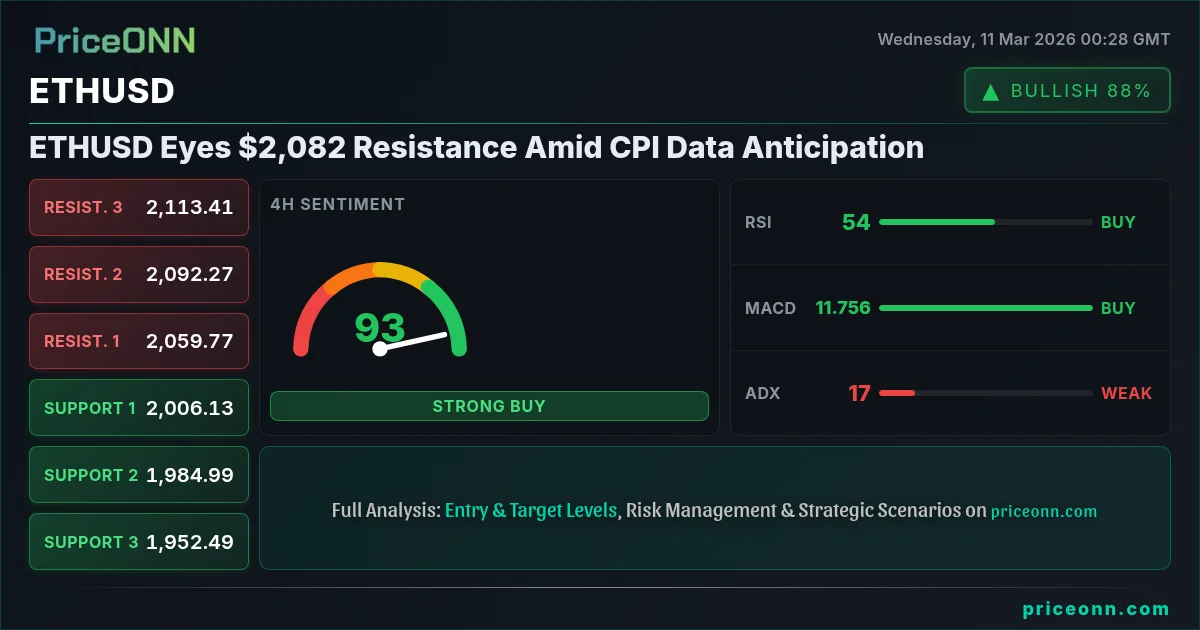
- Key resistance level to watch is $2,082, a break above could signal further upside.
- Stochastic on the 1H chart indicates a potential oversold condition, with K=26.46 and D=41.73.
- CPI data release on Wednesday is expected to inject volatility into the market, impacting ETHUSD direction.
ETHUSD today analysis reveals a mixed bag of signals across different timeframes. On the hourly chart, the trend appears neutral, with the RSI at 50.18 suggesting neither overbought nor oversold conditions. However, the MACD shows negative momentum, with the MACD line below the signal line, indicating potential bearish pressure in the short term. The Stochastic, with K=26.46 and D=41.73, suggests that ETHUSD might be approaching oversold conditions on the hourly timeframe, hinting at a possible short-term bounce. Scalpers should watch for a break above the $2,031.29 resistance on the 1H chart to confirm a bullish move, or a break below the $2,019.12 support for a bearish continuation.
Stepping back to the 4-hour chart, we see a slightly more bullish picture. The trend is also neutral, but the RSI at 54.57 indicates a slight bullish bias. The MACD shows positive momentum, with the MACD line above the signal line, suggesting that the bulls have some control. The Stochastic, however, is in overbought territory, with K=70.46 and D=82.23, signaling a potential pullback. Swing traders should monitor the $2,101.75 resistance level on the 4H chart. A sustained break above this level could open the door for a test of the $2,134.13 and $2,181.80 resistance levels. Failure to break above $2,101.75 could lead to a retest of the $2,021.70 support.

On the daily chart, the overall trend for ETHUSD is neutral. The RSI sits at 48.73, showing neither bullish nor bearish extremes. The MACD is positive, hinting at potential bullish momentum building. However, the Stochastic shows K=39.40 and D=48.94, suggesting that the daily chart is trending down. Long-term investors should pay attention to the $2,082.19 resistance level on the daily chart. A decisive break above this level could pave the way for a move towards the $2,138.64 and $2,225.77 resistance levels. Failure to overcome $2,082.19 could result in a decline towards the $1,938.61 support.
Why is the $2,082 level so critical? Historically, this level has acted as a significant pivot point for ETHUSD. Multiple attempts to break above this level have been met with strong selling pressure, while breaks below have often led to sharp declines. A successful breach of $2,082 could signal a shift in market sentiment, attracting further buying interest and potentially triggering a sustained uptrend. Conversely, failure to break above this level could reinforce the bearish narrative, leading to a retest of lower support levels.
The DXY (Dollar Index) is currently at 98.61, up 0.24% on the day. A stronger dollar typically puts downward pressure on ETHUSD, as it makes the cryptocurrency more expensive for holders of other currencies. Traders should closely monitor the DXY for any significant moves, as this could have a direct impact on ETHUSD. If the DXY continues to strengthen, ETHUSD may struggle to break above the $2,082 resistance. Conversely, a weaker DXY could provide a tailwind for ETHUSD, increasing the likelihood of a breakout.
The SP500 is currently at 6805.55, up 0.27% on the day. ETHUSD has shown a positive correlation with the SP500 in recent times, as both assets are seen as risk-on investments. A rising SP500 typically indicates increased risk appetite, which can benefit ETHUSD. However, this correlation is not always consistent, and traders should not rely solely on the SP500 for ETHUSD direction. If the SP500 experiences a significant pullback, ETHUSD could also face downward pressure, regardless of its technical setup.
The energy sector is also worth watching, especially given the recent news about Iran threatening to halt oil exports. According to reports, oil prices have experienced significant volatility due to these geopolitical tensions. While ETHUSD is not directly correlated with oil prices, rising inflation expectations, often fueled by higher energy costs, can impact broader market sentiment and potentially influence cryptocurrency valuations. Traders should monitor oil prices and any related inflation data, as this could indirectly affect ETHUSD.
The upcoming CPI data release on Wednesday is the key event to watch. Higher-than-expected inflation data could prompt the Federal Reserve to adopt a more hawkish stance, potentially leading to higher interest rates and a stronger dollar. This scenario would likely put downward pressure on ETHUSD. Conversely, lower-than-expected inflation data could lead to a more dovish Fed stance, potentially weakening the dollar and providing support for ETHUSD. Traders should be prepared for increased volatility around the CPI release and adjust their positions accordingly.
For scalpers, the 1H chart offers short-term trading opportunities. A break above $2,031.29 could trigger a quick long position, while a break below $2,019.12 could present a shorting opportunity. Swing traders should focus on the 4H chart, monitoring the $2,101.75 resistance and the $2,021.70 support. A sustained break of either level could signal a larger move. Long-term investors should keep an eye on the daily chart, particularly the $2,082.19 resistance. A decisive break above this level could indicate the start of a new uptrend.
The ADX on the 1H chart is at 23.62, indicating a weak trend. This suggests that ETHUSD is currently in a consolidation phase, and a breakout could be imminent. The ADX measures the strength of a trend, and a reading below 25 typically indicates a weak or non-existent trend. Traders should watch for a surge in the ADX above 25 to confirm a breakout, either to the upside or the downside. Until then, caution is advised, and traders should avoid taking overly aggressive positions.
Given the mixed signals and the upcoming CPI data release, the recommended trade decision is to remain in a WATCH_ZONE. A daily close above $2,082.19 would open the door for a test of the $2,138.64 resistance. This scenario would be further strengthened if the DXY weakens and the SP500 continues its upward trajectory. Conversely, a daily close below $1,938.61 would suggest further downside potential, potentially leading to a retest of the $1,851.48 support. It is best to wait for a clear signal before committing to a specific direction.
Frequently Asked Questions: ETHUSD Analysis
What happens if ETHUSD breaks above $2,082.19 resistance?
A break above the $2,082.19 resistance level could trigger a significant bullish move for ETHUSD. The next target would be the $2,138.64 resistance, followed by a potential test of the $2,225.77 level. This scenario would be supported by a weaker DXY and a continued rally in the SP500.
Should I buy ETHUSD at current levels of $2,037.94 given the Stochastic on the 1H chart?
While the Stochastic on the 1H chart suggests potential oversold conditions, it is prudent to wait for further confirmation before initiating a long position. A break above the $2,031.29 resistance, coupled with a strengthening RSI, could provide a more reliable signal. Risk management is crucial, and a stop-loss order should be placed below the $2,019.12 support.
Is the positive MACD on the 4H chart a reliable indicator of a sustained uptrend for ETHUSD?
The positive MACD on the 4H chart suggests potential bullish momentum, but it is essential to consider other indicators and the overall market context. The overbought Stochastic and the upcoming CPI data release could introduce volatility and potentially negate the bullish MACD signal. A confirmed break above the $2,101.75 resistance would provide stronger evidence of a sustained uptrend.
How will the CPI data release on Wednesday affect ETHUSD this week?
The CPI data release on Wednesday is a major catalyst that could significantly impact ETHUSD. Higher-than-expected inflation data could lead to a stronger dollar and downward pressure on ETHUSD, while lower-than-expected data could weaken the dollar and provide support for ETHUSD. Traders should be prepared for increased volatility and adjust their positions accordingly.
Volatility creates opportunity- those prepared will be rewarded.
Track markets in real-time
AI-powered analysis, technical indicators and real-time price data.
Join Our Telegram Channel
Breaking market news, AI analysis and trading signals instantly.
Join Channel