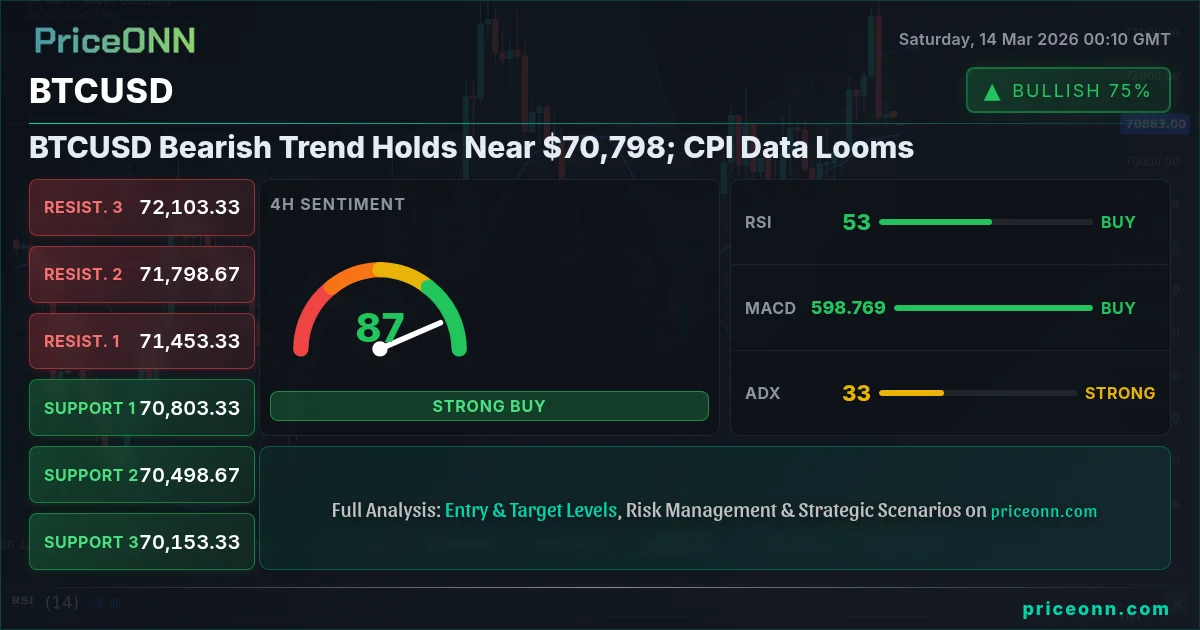
BTCUSD is currently navigating a bearish trend, hovering around $70,798 as of last Friday's close. Market participants are keenly awaiting the upcoming CPI data, which could significantly influence Bitcoin's trajectory. The confluence of technical indicators and fundamental factors suggests a cautious approach is warranted, and patience will be key for traders looking to capitalize on potential setups.
- RSI at 43.53 on the 1H chart indicates potential for further downside before oversold conditions are met.
- Key support lies at $70,000, a break below which could trigger a sharper sell-off.
- MACD on the 1H chart shows negative momentum, reinforcing the bearish sentiment in the short term.
- Upcoming CPI data is expected to be a major catalyst, influencing Fed policy and, consequently, BTCUSD's correlation with the DXY.
Why $70,000 is the Line in the Sand
The $70,000 level is proving to be a critical juncture for BTCUSD. A sustained break below this psychological support could pave the way for further declines, potentially targeting the $69,340.33 level, based on daily timeframe support. The one-hour chart shows a bearish trend with an ADX of 22.31, indicating moderate trend strength. Furthermore, the RSI at 43.53 suggests that there's still room for downside movement before the asset becomes oversold. Scalpers should be cautious, as the short-term momentum favors sellers. A failed retest of $71,151.33 resistance would likely confirm the continuation of the downtrend, making it a key level to watch for intraday traders. The current weakness aligns with broader market sentiment, where risk assets are facing headwinds amid concerns over inflation and potential adjustments in Fed policy.
The Bull's Roadmap: Reclaiming $72,000
For bullish traders to regain control, BTCUSD needs to decisively break above the $71,151.33 resistance level on the hourly chart. If this occurs, the next target would be $71,486.67, followed by $71,781.33. A successful push above these levels could signal a shift in momentum, attracting buyers and potentially leading to a retest of the recent highs. The four-hour chart reveals a slightly more optimistic picture, with the RSI at 52.5, suggesting neutral conditions and room for upside movement. However, the MACD still indicates negative momentum, so caution is advised. Swing traders should look for confirmation signals, such as a bullish crossover on the MACD and increasing volume, before committing to long positions. The overall bullish scenario is contingent on positive developments regarding the upcoming CPI data, which could ease concerns about inflation and support risk assets. The market's reaction to the $72,000 level will be telling, as it represents a significant hurdle that bulls need to overcome to establish a sustained uptrend.
Where Bears Take Control: Sub-$69,000 Breakdown
On the bearish side, a decisive break below the $70,000 support level could trigger a significant sell-off. The next support levels to watch are $69,340.33 (daily timeframe) and $68,409.67. A sustained move below these levels could open the door for a test of the $67,603.33 support. The one-day chart is showing a bearish trend, with an ADX of 26.06. The daily RSI, though at 52.34, indicates the potential for a shift towards oversold conditions if the bearish momentum persists. Long-term investors should monitor these levels closely, as a breakdown below $69,000 could signal a deeper correction. The bearish scenario is further supported by the strength of the DXY, which is currently trading at 100.2, putting pressure on BTCUSD. Any further escalation of geopolitical tensions, as highlighted by recent news regarding the Middle East conflict, could further exacerbate the bearish sentiment, increasing safe-haven demand for the dollar and weighing on risk assets like Bitcoin.
The Waiting Game: Range-Bound Consolidation
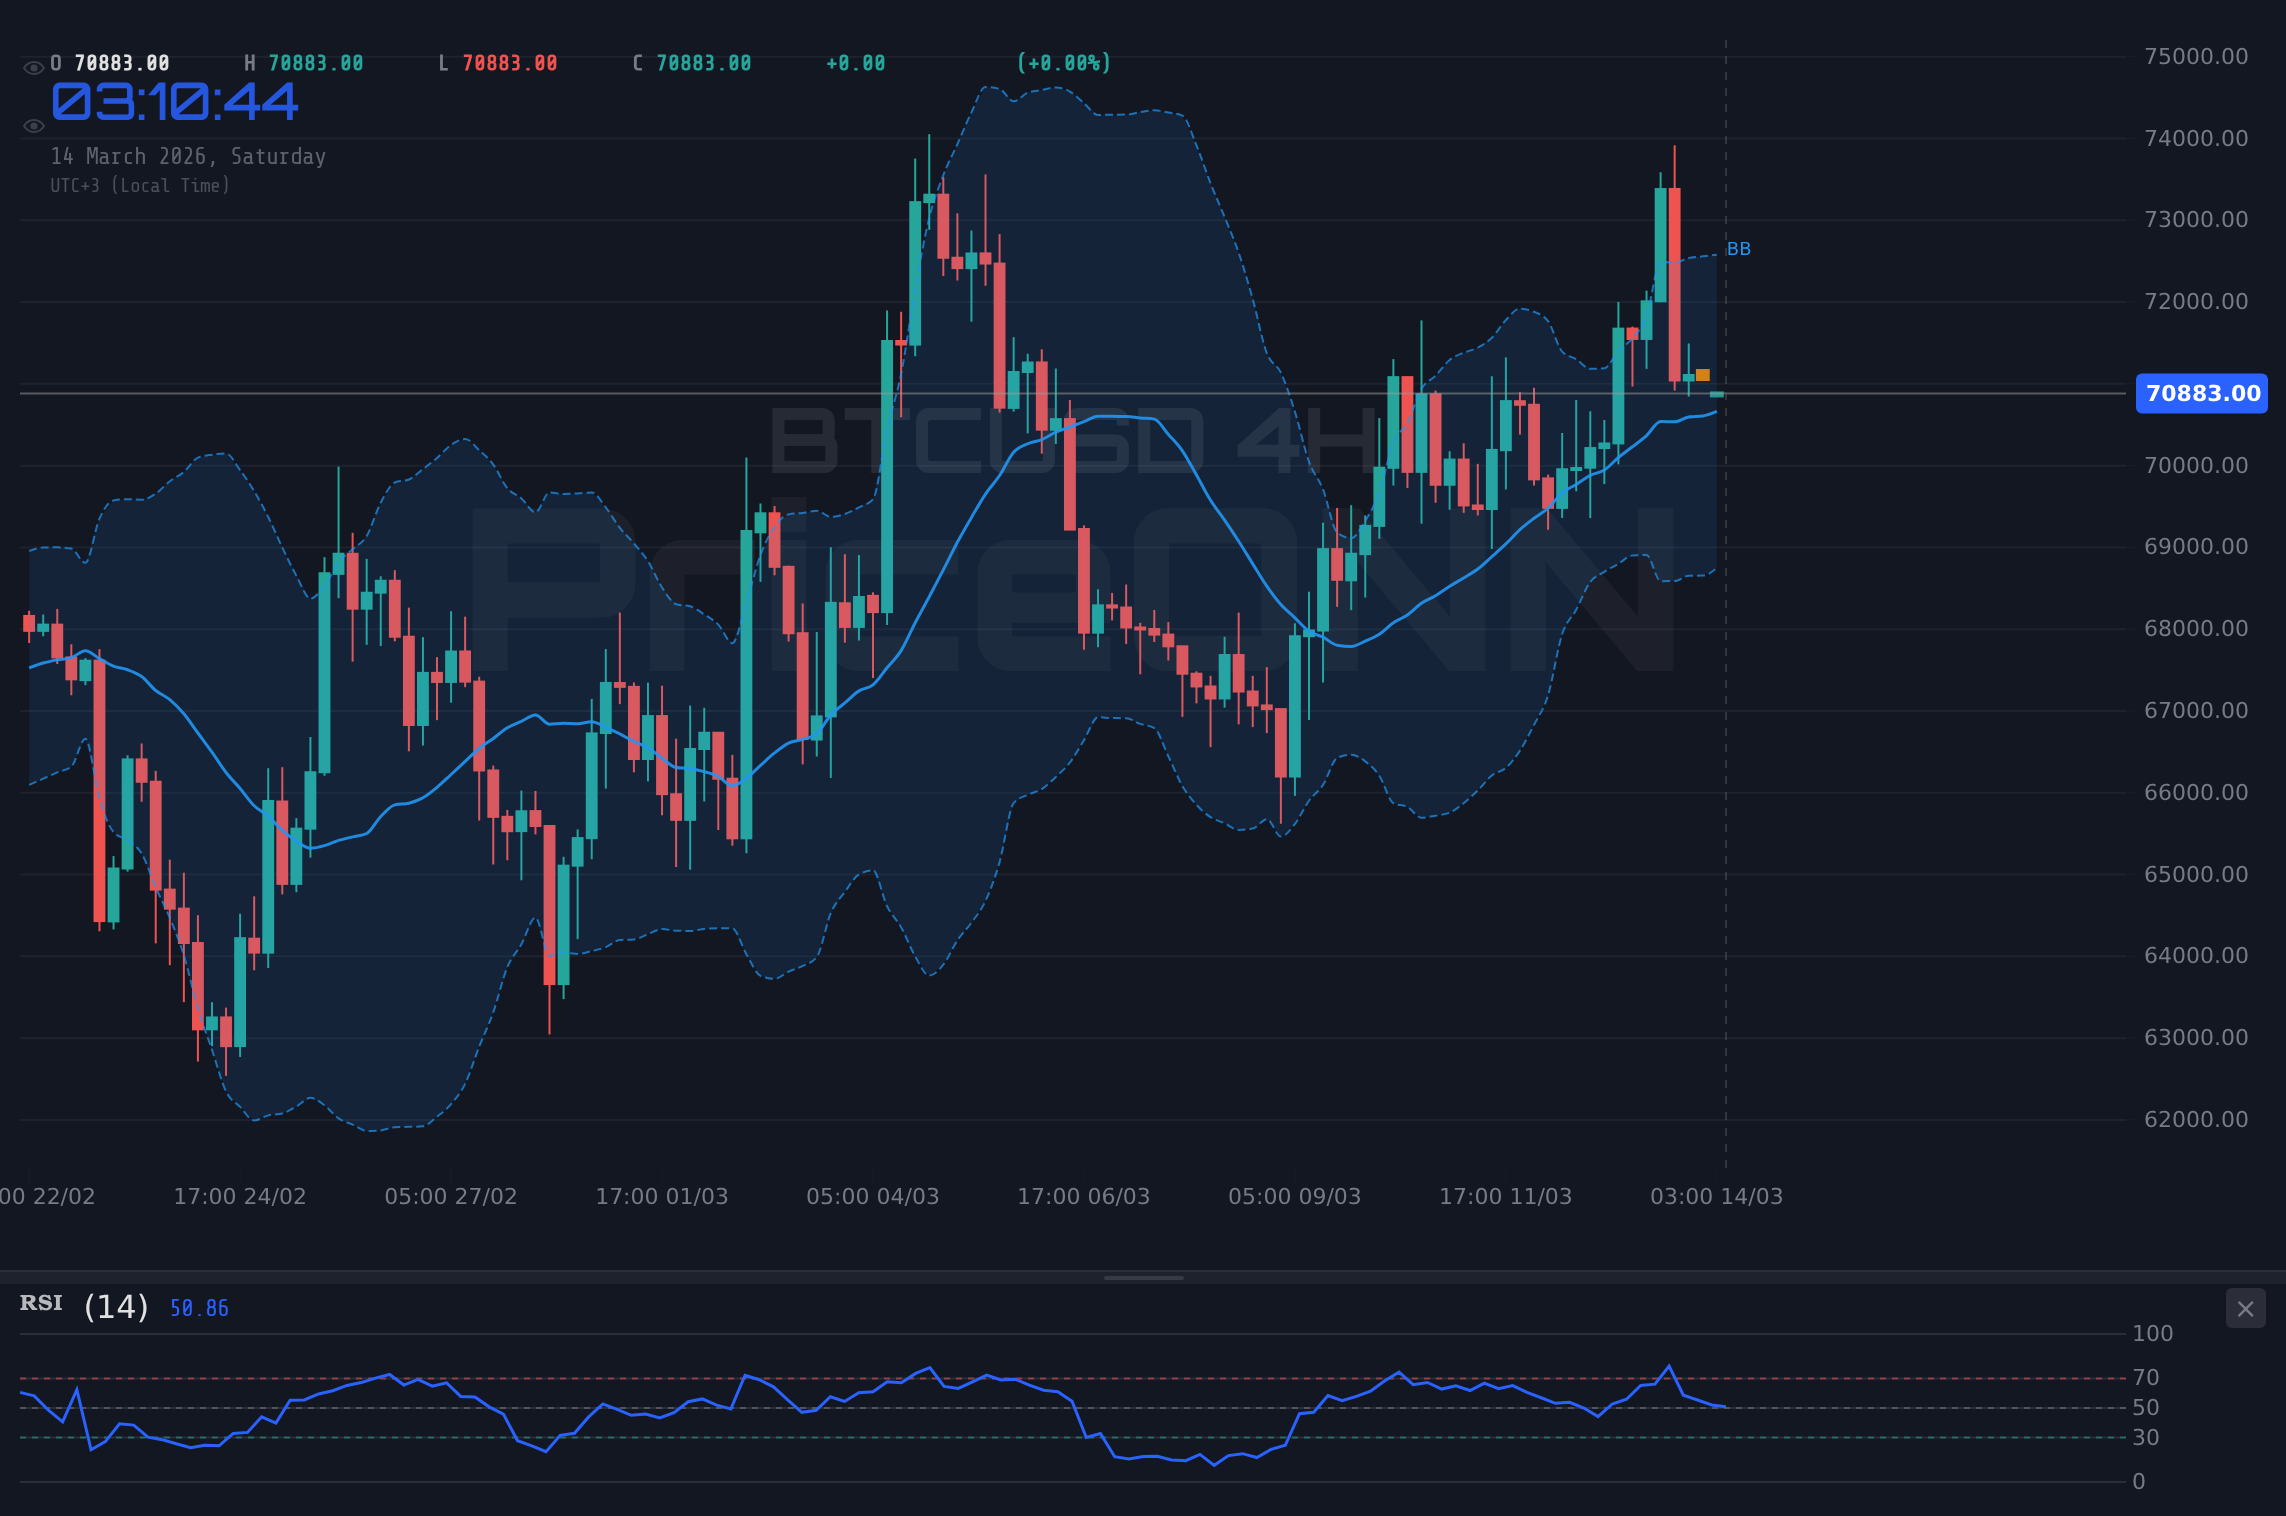
In a neutral scenario, BTCUSD could remain range-bound between $70,000 and $71,151.33. This consolidation phase would likely be characterized by choppy price action and indecision among traders. The hourly chart indicators suggest a lack of clear direction, with the RSI hovering around neutral levels and the MACD showing weak negative momentum. The key to determining the next direction would be a breakout from this range. Scalpers might find opportunities in this range-bound environment, but swing traders and long-term investors should exercise caution and wait for a clear breakout signal before making any significant moves. On the daily chart, BTCUSD is trading near the middle of its Bollinger Bands, further reinforcing the range-bound scenario. The market's focus will likely remain on the upcoming CPI data, and until that is released, BTCUSD may continue to trade sideways.
Scenario Likelihood: Leaning Bearish (55%)
Considering the current technical indicators and the strength of the dollar, the bearish scenario appears to be the most likely (55% probability). The negative momentum on the hourly and four-hour charts, coupled with the proximity to key support levels, suggests that BTCUSD is vulnerable to further downside pressure. The DXY's strength, fueled by geopolitical tensions and potential adjustments in Fed policy, adds to the headwinds facing Bitcoin. The neutral scenario has a 30% probability, as the market could consolidate before making a decisive move. The bullish scenario has a 15% probability, as it would require a significant catalyst, such as surprisingly positive CPI data, to overcome the current bearish sentiment. The overall risk-off environment favors the dollar and weighs on risk assets like Bitcoin.
Correlation Analysis: DXY, Equities, and Oil
BTCUSD's price action is closely correlated with several other markets. The DXY, currently trading at 100.2, exerts downward pressure on Bitcoin, as a stronger dollar typically leads to weaker performance in risk assets. The SP500, which is down 0.81%, also reflects the risk-off sentiment prevailing in the market, further weighing on BTCUSD. Conversely, rising oil prices, with Brent Crude at $103.82 and WTI at $99.18, could contribute to inflationary pressures, potentially supporting Bitcoin as a hedge against inflation. However, the overall impact of rising oil prices is likely to be outweighed by the strength of the dollar and the risk-off sentiment. Traders should monitor these correlations closely, as they can provide valuable insights into the potential direction of BTCUSD. A decoupling from these correlations could signal a shift in market dynamics and should be carefully evaluated.
Historical Perspective: Echoes of Past Downtrends
Analyzing historical price action, similar bearish patterns have emerged in the past. During the 2022 bear market, BTCUSD experienced sustained periods of negative momentum, characterized by similar technical indicators and fundamental factors. A key difference this time is the increased institutional adoption, which could provide some support and mitigate the downside risk. However, the overall market sentiment and the strength of the dollar remain significant headwinds. Long-term investors should consider these historical patterns and the current market dynamics when making investment decisions. Understanding past downtrends can provide valuable insights into potential future price action and help manage risk effectively. The current market environment shares similarities with previous periods of uncertainty, emphasizing the importance of disciplined risk management and patience.
Trading Strategies: Scalpers, Swing Traders, and Long-Term Investors
Different types of traders should adopt different strategies based on the current market conditions. Scalpers can look for short-term opportunities within the $70,000-$71,151.33 range, but should be cautious due to the overall bearish momentum. Swing traders should wait for a clear breakout signal, either above $71,151.33 or below $70,000, before committing to long or short positions. Long-term investors should monitor the $69,340.33 and $68,409.67 support levels closely, as a breakdown below these levels could signal a deeper correction. Diversification and risk management are crucial for long-term investors in the current environment. The upcoming CPI data will likely be a major catalyst, and traders should adjust their strategies accordingly. Patience is key, as the market is likely to provide opportunities for those who are prepared to wait for the right setup.
Key Triggers to Watch This Week
The key triggers to watch this week are the upcoming CPI data and the DXY's price action. A higher-than-expected CPI reading could further strengthen the dollar and weigh on BTCUSD, while a lower-than-expected reading could provide some support. The DXY's movement above 100.2 is a bearish signal for BTCUSD, and any further gains in the dollar could exacerbate the downside pressure. Traders should also monitor geopolitical developments, as any escalation of tensions could increase safe-haven demand for the dollar and weigh on risk assets. The $70,000 level remains a critical support, and a sustained break below this level could trigger a sharper sell-off. The $71,151.33 resistance is the key hurdle for bulls to overcome, and a successful push above this level could signal a shift in momentum. Overall, the market is likely to remain volatile in the coming week, and traders should exercise caution and manage their risk effectively.
Frequently Asked Questions: BTCUSD Analysis
What happens if BTCUSD breaks below $70,000 support?
A break below $70,000 could trigger a significant sell-off, with the next support levels at $69,340.33 and $68,409.67. Sustained weakness below these levels could open the door for a test of $67,603.33, based on daily timeframe analysis.
Should I buy BTCUSD at current levels of $70,798 given the RSI at 43.53?
With the RSI at 43.53 on the 1H chart, BTCUSD is not yet oversold, suggesting potential for further downside. While it's not a clear sell signal, traders should wait for confirmation of a bullish reversal before entering long positions, such as a break above $71,151.33.
Is the negative MACD signal on the 1H chart a strong bearish indicator for BTCUSD?
Yes, the negative MACD signal reinforces the bearish sentiment in the short term. However, it's important to consider other factors, such as the DXY's strength and the upcoming CPI data, before making any trading decisions. Look for confluence with price action near key levels.
How will the upcoming CPI data affect BTCUSD this week?
The upcoming CPI data is expected to be a major catalyst. A higher-than-expected reading could strengthen the dollar and weigh on BTCUSD, while a lower-than-expected reading could provide some support. Monitor the market's reaction to the release and adjust your strategy accordingly.
Technical Outlook Summary
| Indicator | Value | Signal |
|---|---|---|
| RSI (14) | 43.53 | Neutral |
| MACD Histogram | Negative | Bearish |
| Stochastic | 8.86 | Bearish |
| ADX | 22.31 | Weak Trend |
| Bollinger | Middle Band | Watch |
Key Levels
Support Levels
Resistance Levels
Track markets in real-time
AI-powered analysis, technical indicators and real-time price data.
Join Our Telegram Channel
Breaking market news, AI analysis and trading signals instantly.
Join Channel