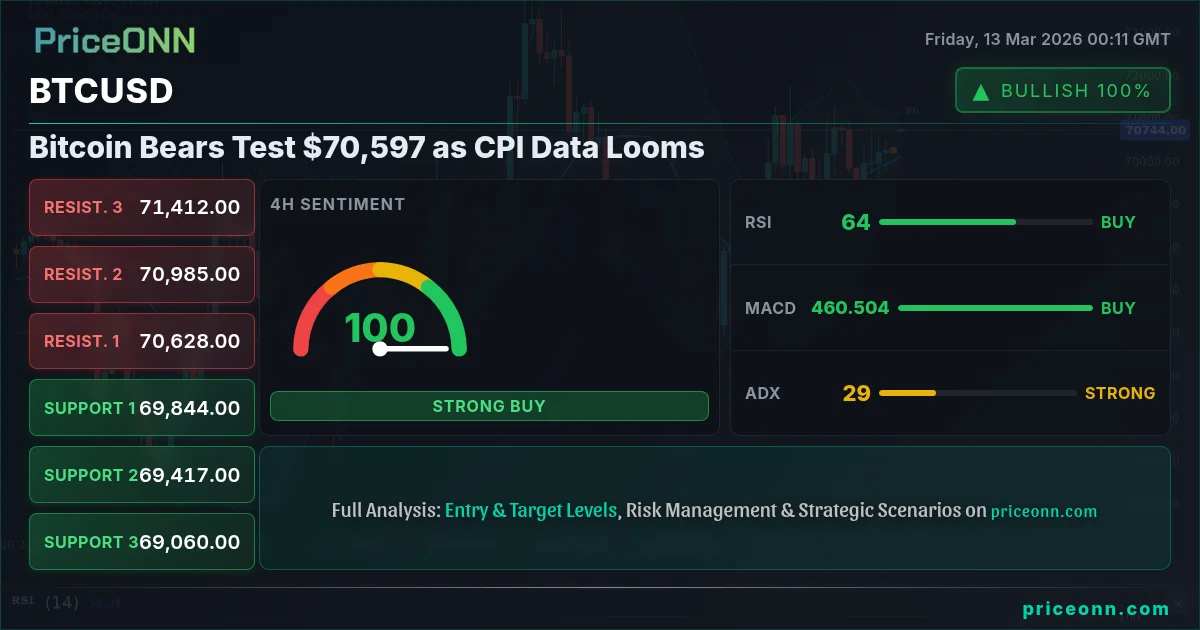
Bitcoin (BTCUSD) finds itself at a crucial juncture, with bears testing the $70,597 level amid growing anticipation for upcoming CPI data. The tug-of-war between bullish momentum and bearish pressure is palpable, leaving traders and investors alike on high alert. This confluence of technical and fundamental factors warrants a deeper dive into the potential scenarios that could unfold.
- RSI at 56.75 on the 1H chart suggests room for further downside before oversold conditions are reached.
- Immediate support lies at $70,027.33, a break below which could trigger a sharper decline.
- The upcoming US CPI data on Friday is a key catalyst that could significantly impact BTCUSD direction.
- DXY strength, currently at 99.38, is adding pressure on BTCUSD, reinforcing the bearish narrative.
The Bullish Case for Bitcoin
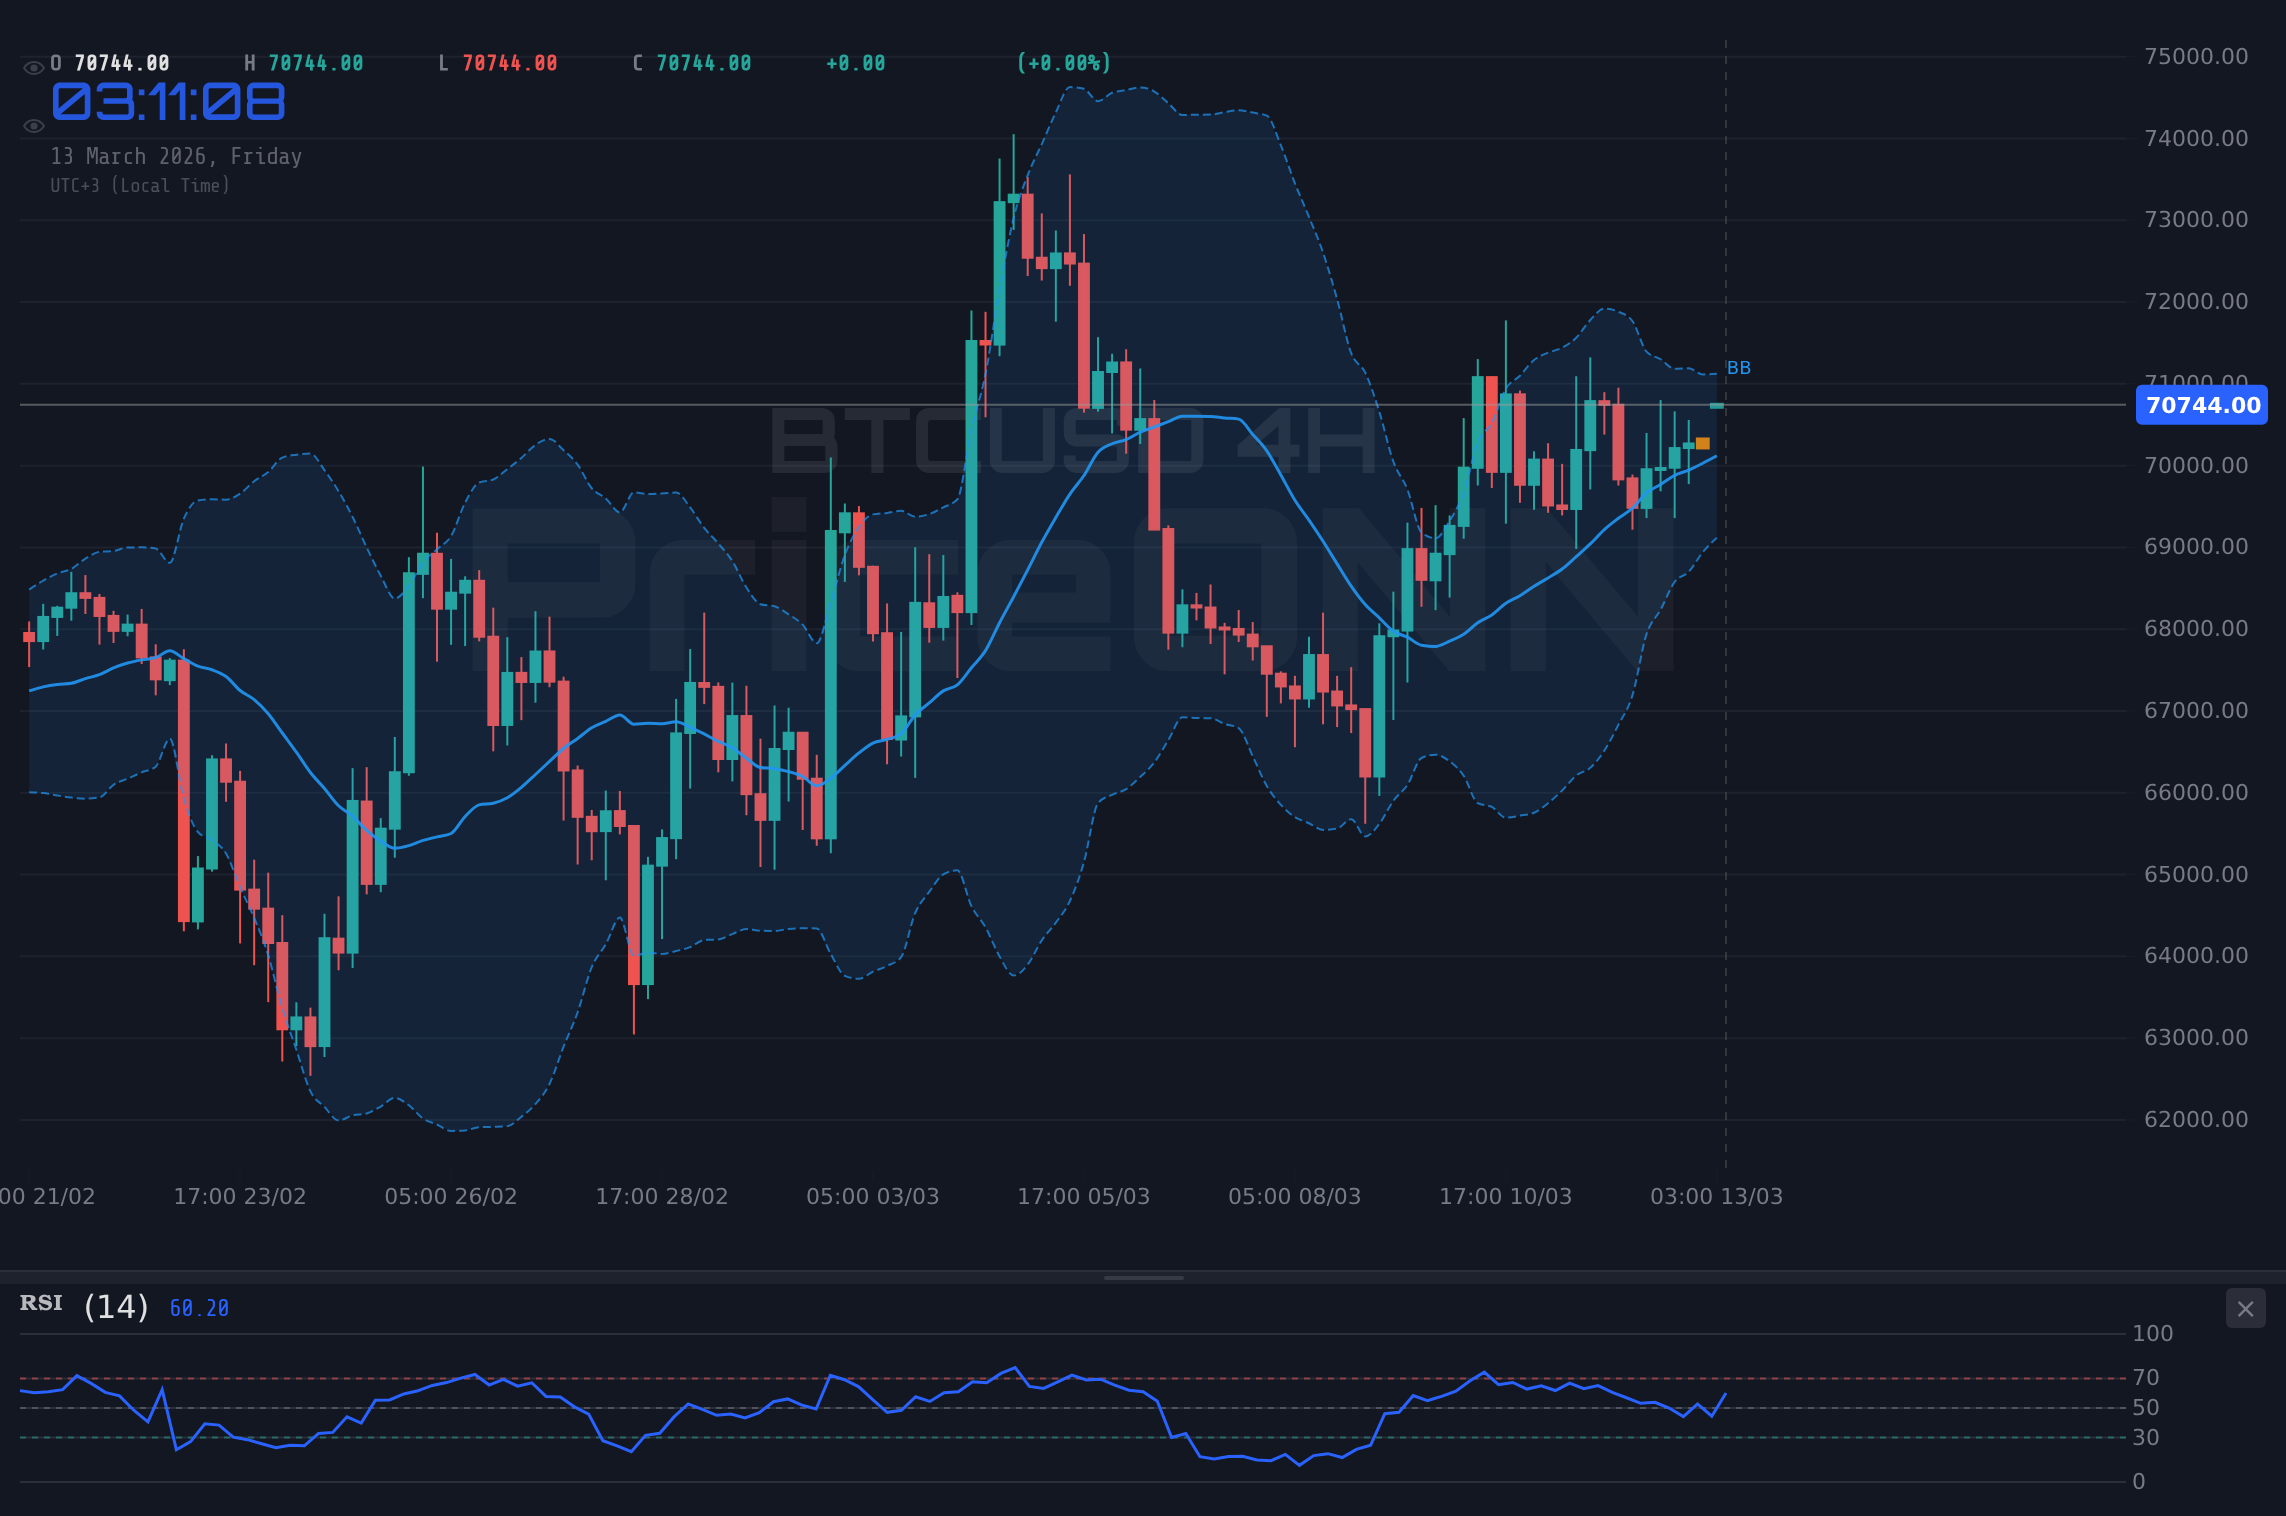
Despite the current bearish pressure, a compelling bullish case can still be made for Bitcoin. The cryptocurrency has demonstrated remarkable resilience, repeatedly bouncing back from pullbacks. The 4H chart shows a bullish trend with the price holding above the middle Bollinger band, suggesting underlying buying interest. Moreover, the Stochastic on the 1D timeframe shows %K at 57.37, above %D at 48, signaling continued upward momentum. Should the bulls regain control, a retest of the recent high near $71,718.33 becomes increasingly likely.
The fundamental underpinning for the bullish case rests on continued institutional adoption and growing acceptance of Bitcoin as a store of value. Recent ETF inflows have provided a steady stream of demand, absorbing selling pressure and supporting prices. Furthermore, the upcoming halving event in 2024 is historically associated with bullish price action, as the reduced supply of new Bitcoin entering the market creates scarcity and potentially drives prices higher. The current sideways consolidation could be viewed as a period of accumulation before the next leg up. The positive momentum in ETHUSD, which stands at $2074.42, further supports the bullish narrative.
The Bearish Case for Bitcoin
However, the bearish case for Bitcoin cannot be ignored. The recent decline from its highs suggests that the market may be entering a period of correction. The 1H chart reveals a clear downtrend with the price trading below the middle Bollinger band. The ADX on the 1H timeframe is at 13.66, indicating a weak trend, but the overall signal is sell. The daily chart shows a downtrend, with the price facing resistance at $71,718.33. A break below the immediate support at $70,027.33 could pave the way for a deeper correction towards $69,375.33 or even $68,006.67.
Fundamentally, concerns about regulatory headwinds and macroeconomic uncertainty are weighing on Bitcoin's price. Increased scrutiny from regulatory bodies could dampen institutional enthusiasm and discourage retail participation. Moreover, the strengthening US Dollar Index (DXY), currently at 99.38, is exerting downward pressure on Bitcoin, as the cryptocurrency is often inversely correlated with the dollar. According to Reuters, the Fed officials remain concerned about ‘sticky’ inflation. The looming CPI data release is a key event that could trigger further dollar strength if inflation surprises to the upside, adding to Bitcoin's woes.
Technicals as the Tiebreaker: Multi-Timeframe Analysis
To resolve the bull vs bear debate, a multi-timeframe technical analysis provides valuable insights. The hourly chart points to bearish momentum with the RSI at 56.75, indicating room for further downside. The 4-hour chart, however, paints a mixed picture, with the RSI at 57.46 suggesting neutral conditions, but the ADX is at 28.5, indicating a strong uptrend. The daily chart offers a more bullish perspective, with the RSI at 51.91, the MACD showing positive momentum, and the price trading above the middle Bollinger band.
A closer look at the support and resistance levels reveals key areas to watch. Immediate support lies at $70,027.33, followed by $69,375.33 and $68,006.67. On the upside, resistance is seen at $71,718.33, $72,692.67 and $74,061.33. A decisive break above the resistance could signal a resumption of the uptrend, while a breakdown below the support could confirm the bearish scenario. The Stochastic indicator further complicates the picture, with the 1H chart showing a bullish signal (%K > %D), but the 4H chart showing a bearish signal (%K
Correlation Analysis: DXY, Equities, and Oil
Understanding the correlations between Bitcoin and other asset classes is crucial for assessing its potential direction. A strong positive correlation with equities, particularly the Nasdaq 100, suggests that Bitcoin tends to move in tandem with risk assets. The recent decline in the Nasdaq 100, currently at 24508.87, is adding to the bearish pressure on Bitcoin. Conversely, a negative correlation with the US Dollar Index (DXY) implies that a stronger dollar often weighs on Bitcoin's price. The DXY's current strength at 99.38 is therefore a headwind for Bitcoin.
Oil prices, currently with Brent at $101.85 and WTI at $96.04, serve as an indicator of inflation expectations. Rising oil prices could fuel inflation concerns, potentially leading to a more hawkish stance from the Federal Reserve and further strengthening the dollar. This, in turn, could exert additional downward pressure on Bitcoin. Investors should closely monitor these correlations to gauge the overall risk environment and its impact on Bitcoin's price.
What Different Trader Types Should Watch
The current market conditions require different strategies for different types of traders. Scalpers should focus on short-term price action and look for opportunities to profit from small price swings. Key levels to watch include the immediate support at $70,027.33 and resistance at $71,718.33. Swing traders should take a longer-term view and focus on potential breakouts or breakdowns from key levels. A daily close above $71,718.33 would open the door for a move towards $72,692.67, while a daily close below $70,027.33 could trigger a decline towards $69,375.33.
Long-term investors should focus on the fundamental picture and consider the long-term growth potential of Bitcoin. The current pullback could be viewed as a buying opportunity, as the cryptocurrency is still trading well below its all-time highs. However, it's crucial to remain vigilant about regulatory risks and macroeconomic headwinds. A diversified portfolio and disciplined risk management are essential for navigating the volatile cryptocurrency market.
Historical Perspective and Potential Outcomes
Historically, Bitcoin has exhibited a pattern of boom-and-bust cycles, characterized by periods of parabolic gains followed by sharp corrections. The current market conditions may be indicative of a similar pattern unfolding. A historical comparison with previous market cycles suggests that a deeper correction towards $68,006.67 or even $67,032.33 cannot be ruled out. However, it's important to note that each market cycle is unique, and past performance is not necessarily indicative of future results.
The market's reaction to the upcoming CPI data will be crucial in determining Bitcoin's next move. A higher-than-expected inflation reading could trigger a sharp sell-off, while a lower-than-expected reading could fuel a relief rally. Investors should remain flexible and adjust their strategies based on the incoming data. Having tracked BTCUSD through the 2024 rate cycle, it is crucial to monitor the upcoming CPI data on Friday.
Trade Recommendation: Watch Zone
Given the conflicting signals and the upcoming CPI data release, a WATCH_ZONE approach is warranted for BTCUSD. A daily close above $71,718.33 would open the door for a test of $72,692.67, while a daily close below $70,027.33 would likely trigger a selloff towards $69,375.33. Patience is key, and waiting for a clear signal before entering a trade is advisable.
Frequently Asked Questions: BTCUSD Analysis
What happens if BTCUSD breaks above $71,718.33 resistance?
A decisive break above the $71,718.33 resistance level could signal a resumption of the uptrend, potentially leading to a test of the next resistance level at $72,692.67. This scenario would likely be supported by a weaker US dollar and positive market sentiment.
Should I buy BTCUSD at current levels of $70,597 given RSI at 56.75?
Given that the RSI at 56.75 on the hourly chart indicates neutral conditions, a buy signal is not immediately apparent. It would be prudent to wait for a more decisive bullish signal, such as a break above the $71,718.33 resistance, before considering a long position.
Is ADX at 13 a reliable signal for BTCUSD trend strength?
An ADX reading of 13 on the 1H chart indicates a weak trend, suggesting that the current price action may be range-bound or subject to whipsaws. Traders should exercise caution and avoid aggressive directional bets until the ADX shows a stronger trend signal.
How will the US CPI data on Friday affect BTCUSD this week?
The US CPI data release on Friday is a key catalyst that could significantly impact BTCUSD. A higher-than-expected inflation reading could trigger a sell-off in Bitcoin, while a lower-than-expected reading could fuel a relief rally. The market's reaction will depend on whether the data confirms or contradicts the prevailing expectations.
Volatility creates opportunity - those prepared will be rewarded. With disciplined risk management, these choppy waters can be navigated safely.
Track markets in real-time
AI-powered analysis, technical indicators and real-time price data.
Join Our Telegram Channel
Breaking market news, AI analysis and trading signals instantly.
Join Channel