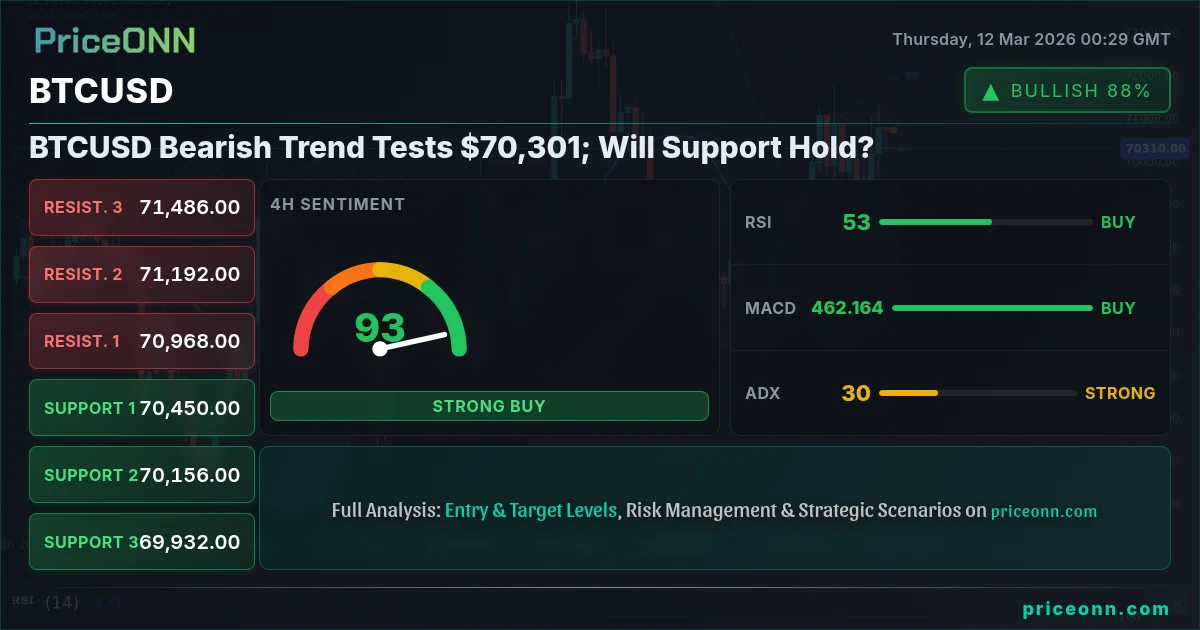
Bitcoin just did something that has bears excited, testing the critical $70,301 level. This isn't just a minor dip; it's a test of resolve, with both technical indicators and overall market sentiment suggesting a potential shift in momentum. The question now is whether this level will hold, or if we're about to see a deeper correction.
- RSI at 51.74 indicates neutral momentum but leaning towards a potential bullish bounce.
- Critical support sits at $70,096.33, a break below which could trigger further selling.
- MACD shows positive momentum, suggesting a possible bullish continuation if key levels hold.
- DXY strength is putting pressure on BTCUSD, underscoring the inverse correlation.
BTCUSD today analysis reveals a market at a crossroads. The $70,301 level is not just a psychological barrier; it's a battleground where bulls are attempting to defend their gains against increasing bearish pressure. The recent dip is causing many to re-evaluate their positions, especially given the mixed signals from various technical indicators. The key is to watch for confirmation, not just react to the initial move.
Why $70,096 is the Line in the Sand
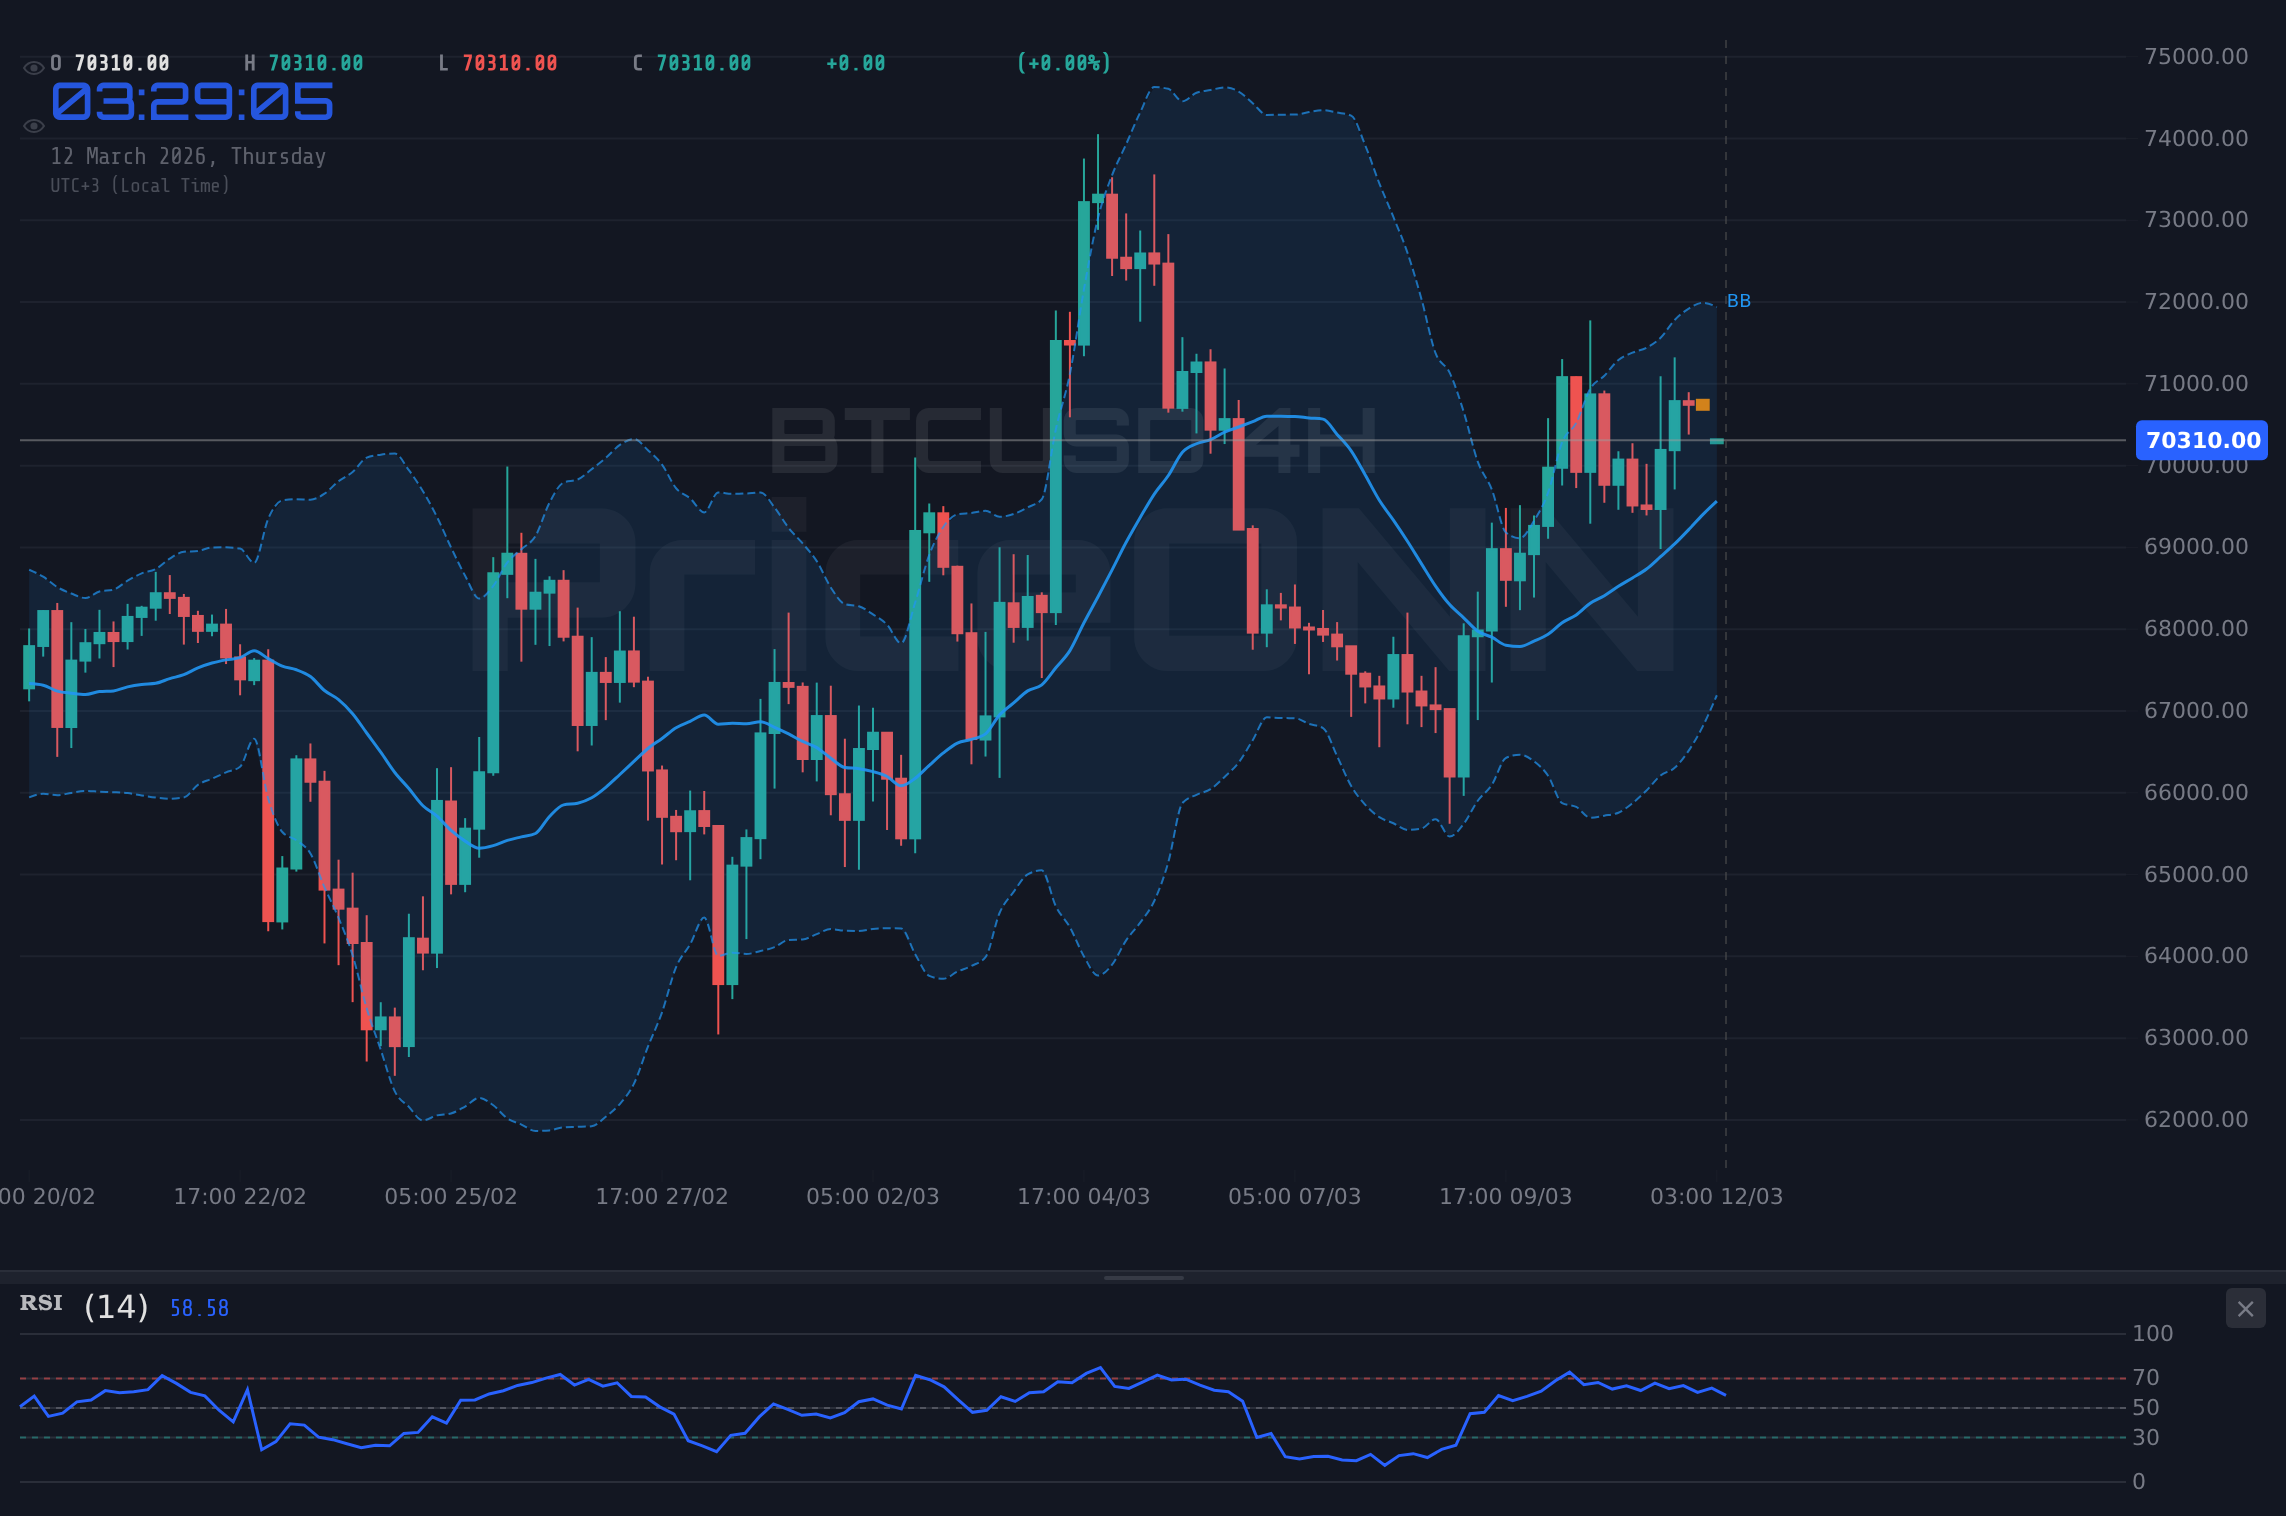
Look, this level is absolutely critical. The $70,096.33 support is the first line of defense. A sustained break below this level could open the floodgates, potentially leading to a test of lower supports at $69,816.67 and $69,388.33. Traders need to be vigilant here. The four-hour chart shows a clear bearish engulfing pattern, which is another red flag for the bulls. The overall trend on the daily timeframe remains bullish, but this short-term weakness cannot be ignored.
What the MACD Signal Tells Us About BTCUSD Trend Analysis
The MACD histogram is currently showing positive momentum, but it's weakening. This divergence is a warning sign, suggesting that the bullish trend may be losing steam. The MACD’s positive momentum is in conflict with the downward price action. This creates a need for confirmation, either through the price stabilizing at current levels and resuming its upward trajectory, or breaking down below the support, confirming the bearish divergence. This indicator can be a bit of a head-fake; patience looks like it will be rewarded here.
The Impact of DXY Strength on BTCUSD Price Forecast
With DXY at 99.25, the dollar index strength is putting pressure on BTCUSD. Historically, there's an inverse correlation between the two. A rising DXY often translates to a weaker BTCUSD, as it makes Bitcoin relatively more expensive for international buyers. Manage your risk, wait for your setup - the market always gives a second chance. News from March 11 highlights the potential for USD volatility, given the US inflation watch. This is exactly where you need to pay attention...
Multi-Timeframe Analysis: Conflicting Signals
A multi-timeframe analysis paints a mixed picture. On the hourly chart, the trend is bearish, with the RSI at 51.74 indicating neutral momentum. However, the four-hour chart shows a more pronounced bearish trend with the RSI at 55.99, while the daily chart still maintains a bullish outlook with the RSI at 51.38. This divergence in signals underscores the need for caution and confirmation before making any decisive moves. The ADX on the hourly chart is only at 18.46, indicating a weak trend, so the bearish move may not have committed yet.
On-Chain Metrics and Institutional Adoption Trends
Beyond the technicals, it's crucial to consider on-chain metrics and institutional adoption trends. Whale movements are always a key indicator. Large transfers to exchanges often precede sell-offs, while outflows from exchanges can signal accumulation. Additionally, the growth of DeFi and NFT ecosystems, regulatory news, Bitcoin dominance, altcoin correlations, and institutional adoption trends all play a significant role in Bitcoin’s price action. News about potential ETF inflows or regulatory crackdowns can trigger sharp moves, so staying informed is paramount.
Crude Oil Eyes $90: What It Means for Bitcoin
The recent news about crude oil eyeing $90 as Iran tensions threaten Eurozone stability adds another layer of complexity. Rising oil prices can fuel inflation fears, which, in turn, can impact Bitcoin's appeal as an inflation hedge. If the inflation narrative gains traction, we could see increased demand for Bitcoin. However, the relationship is not always straightforward, and other factors such as interest rate expectations and overall risk sentiment can also play a significant role.
Trading Signals and Key Level Alerts
Key level alerts are crucial for any BTCUSD trader. A daily close above $70,804.33 would open the door for a retest of higher resistances at $71,232.67 and $71,512.33. Conversely, a break below $70,096.33 could trigger a move towards $69,816.67 and $69,388.33. The stochastic on the hourly chart is showing a potential oversold condition, with K=49.6 and D=66.49. The four-hour chart shows the stochastic K at 51.75 and D at 47.63, indicating a bullish crossover.
Volatility Analysis: Why a Breakout is Imminent
Why BTCUSD volatility analysis points to a breakout: The Bollinger Bands are currently contracting, which often precedes a period of increased volatility. This consolidation phase suggests that a significant move is on the horizon. The question is whether it will be a bullish breakout or a bearish breakdown. The key is to watch for a decisive break of either the upper or lower Bollinger Band, accompanied by a surge in volume.
Frequently Asked Questions: BTCUSD Analysis
What happens if BTCUSD breaks below $70,096.33 support?
If BTCUSD decisively breaks below the $70,096.33 support level, we could see a swift move down to the next support levels at $69,816.67 and potentially $69,388.33. This breakdown would likely confirm the bearish divergence indicated by the weakening MACD histogram, triggering further selling pressure.
Should I buy BTCUSD at current levels of $70,301 given the neutral RSI?
Given the neutral RSI of 51.74 and the conflicting signals from other indicators, buying BTCUSD at $70,301 is a high-risk move. It's best to wait for confirmation, either through a sustained break above $70,804.33 resistance or a hold above $70,096.33 support. A clear signal is needed before committing capital.
Is the weakening MACD histogram a sell signal for BTCUSD?
The weakening MACD histogram is not a definitive sell signal, but it is a warning sign that bullish momentum is fading. A sell signal would be confirmed by a break below the $70,096.33 support, which would likely lead to further downside.
How will US inflation data affect BTCUSD this week?
US inflation data release on March 11 could have a significant impact on BTCUSD. If inflation comes in higher than expected, it could strengthen the dollar, putting downward pressure on BTCUSD. Conversely, weaker-than-expected inflation could weaken the dollar, providing a boost to BTCUSD.
The Bottom Line: Manage Risk, Watch Key Levels
Volatility creates opportunity - those prepared will be rewarded. Markets are cyclical; every downturn plants seeds for the next rally. Patient investors always find opportunities - the key is waiting for the right moment. Be bold when the market is fearful, cautious when euphoric - this golden rule applies today.
Technical Outlook Summary
| Indicator | Value | Signal |
|---|---|---|
| RSI (14) | 51.74 | Neutral |
| MACD Histogram | Positive | Bullish |
| Stochastic | K=49.6, D=66.49 | Bearish |
| ADX | 18.46 | Weak Trend |
| Bollinger | Contracting | Volatility Squeeze |
Key Levels
Support Levels
Resistance Levels
Track markets in real-time
AI-powered analysis, technical indicators and real-time price data.
Join Our Telegram Channel
Breaking market news, AI analysis and trading signals instantly.
Join Channel