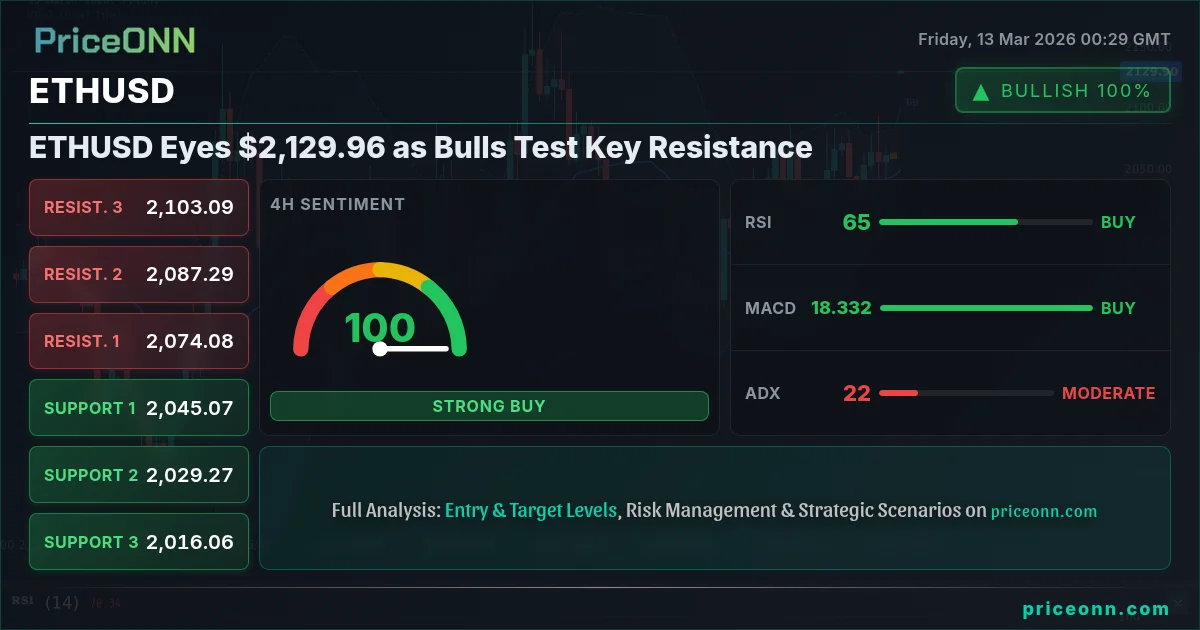
ETHUSD is currently trading near $2,129.96, and frankly, the crypto bulls are testing a critical level here. After a period of consolidation, ETHUSD is attempting to break higher, but the path ahead is fraught with challenges. Key levels will determine if this rally has legs or if it’s just another fake-out.
- RSI at 71.15 signals overbought conditions on the 1-hour chart, suggesting a potential pullback.
- Immediate resistance lies at $2,068.22 on the 1-hour chart, a level to watch for breakout confirmation.
- MACD remains positive on the 4-hour chart, supporting bullish momentum but needs confirmation.
- DXY strength is pressuring ETHUSD, making a sustained breakout more challenging.
Is $2,100 the New Floor for ETHUSD?
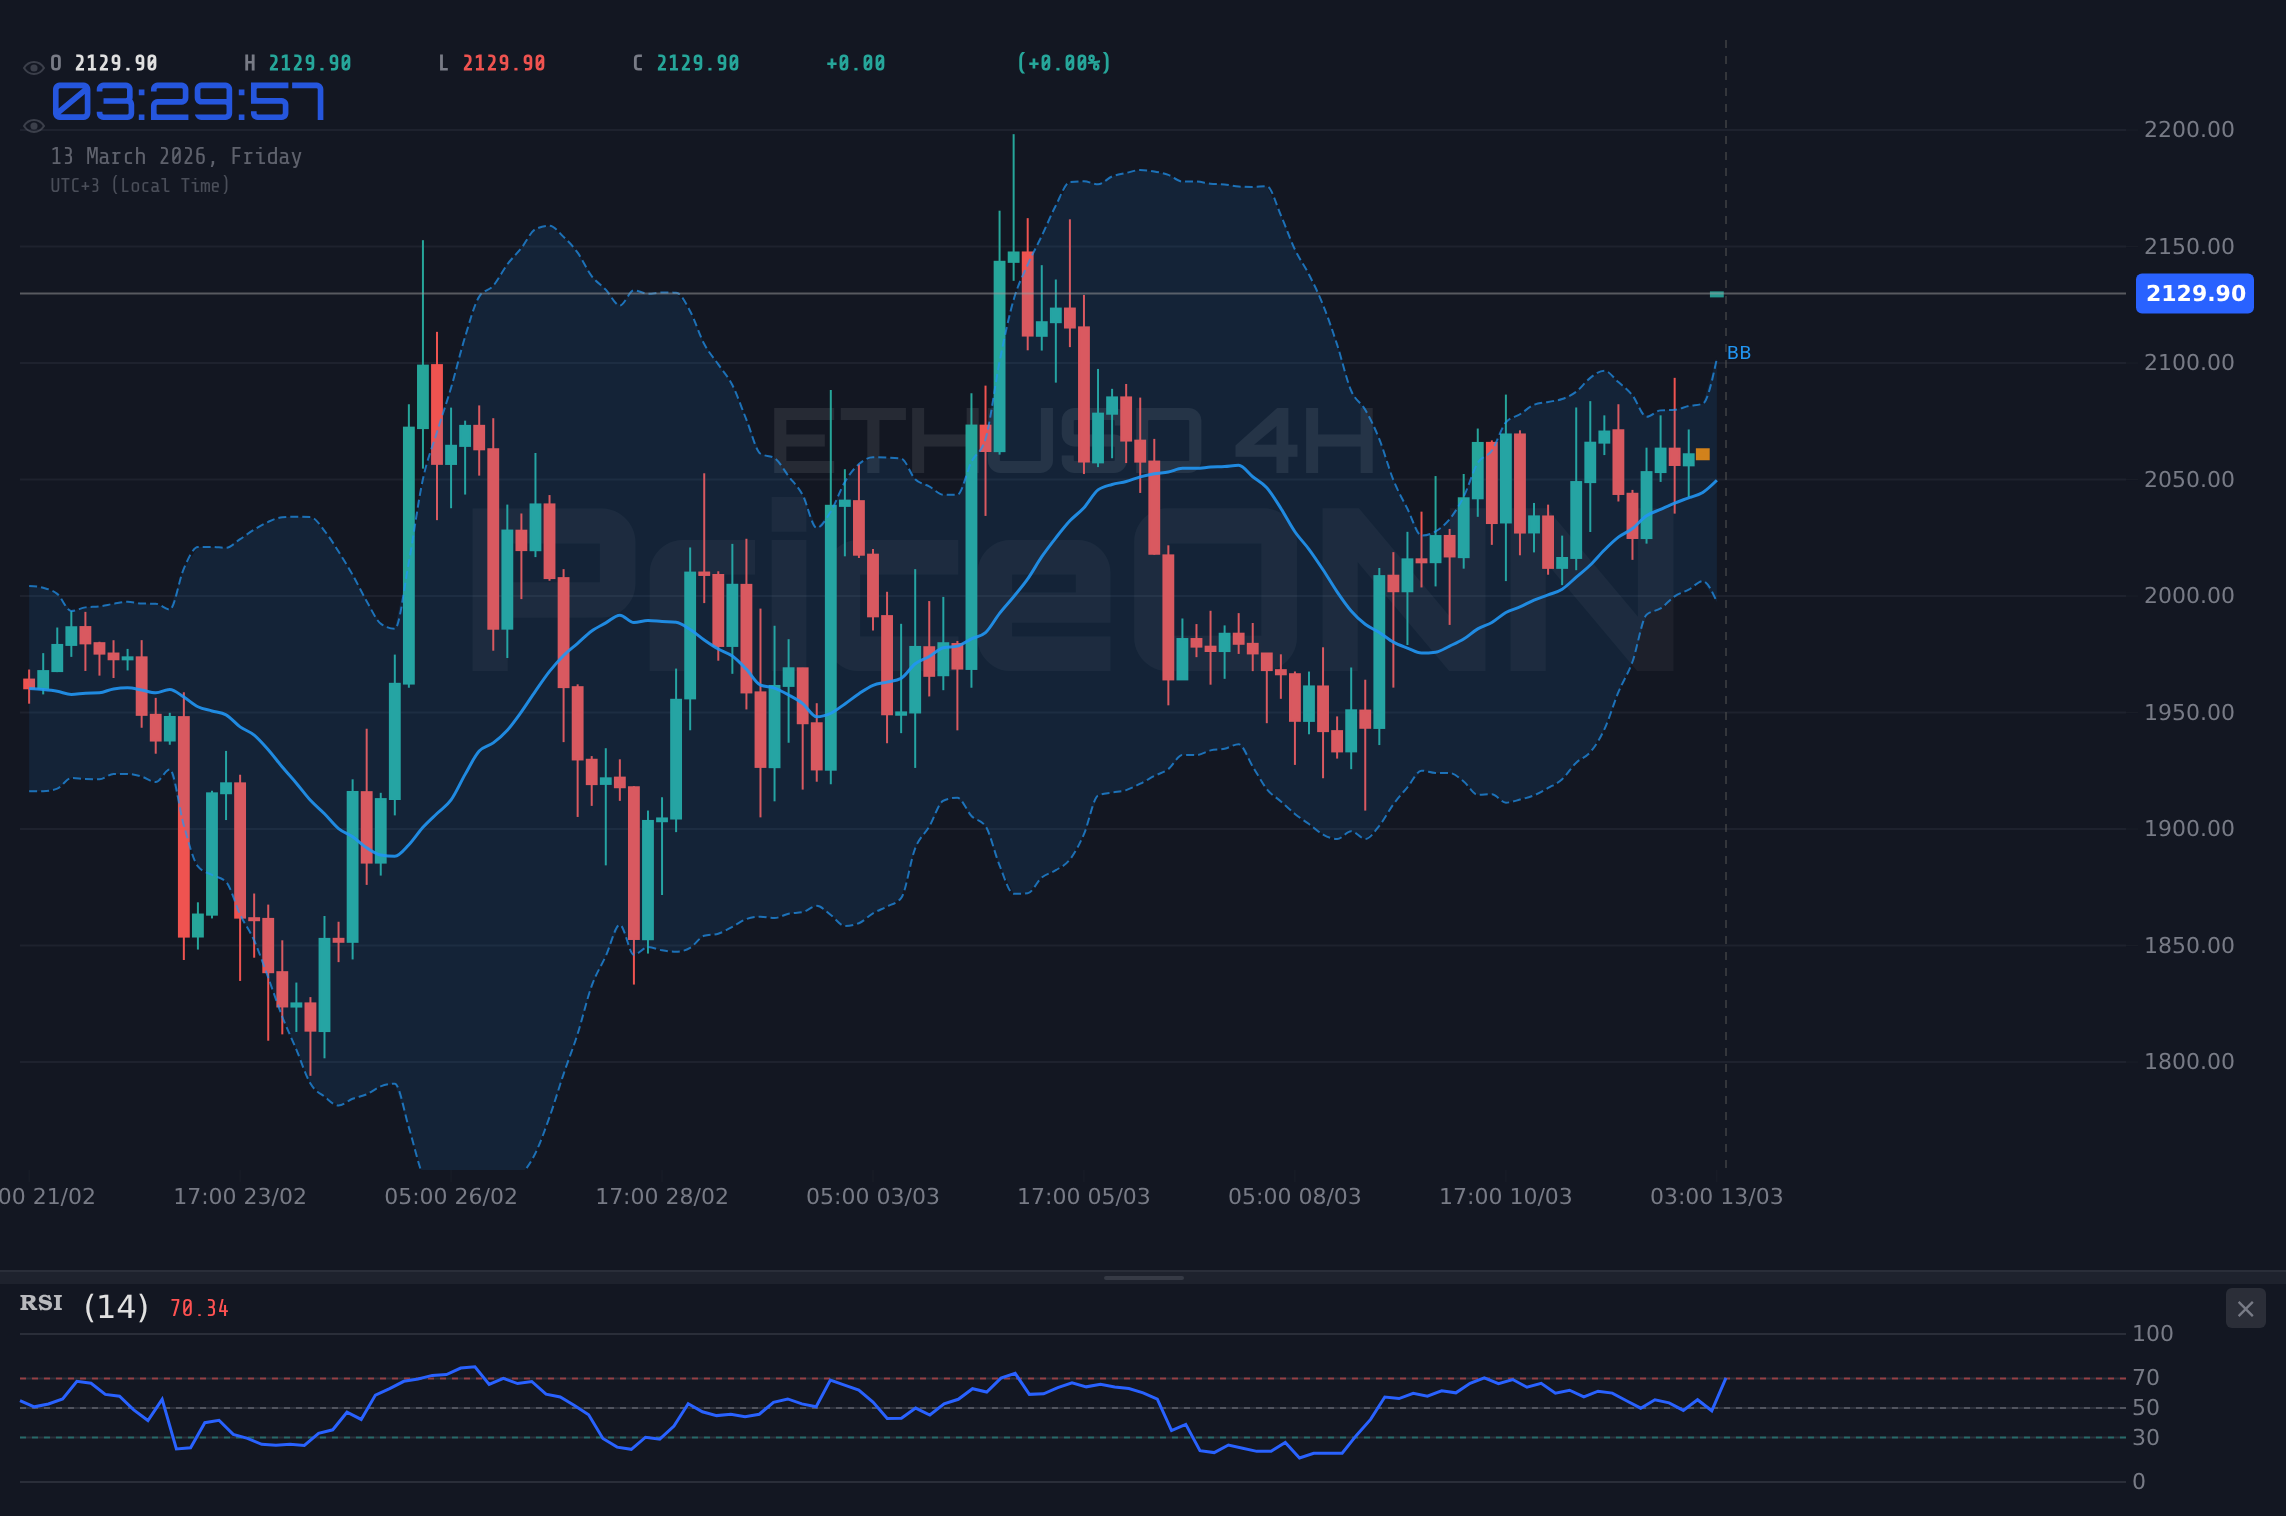
The immediate question on traders' minds: can ETHUSD establish a new support base around $2,100? The psychological level is important, but technicals tell a more nuanced story. The 1-hour chart shows ETHUSD trending sideways, with the RSI at 71.15 indicating overbought conditions. This suggests the bulls may be losing steam in the short term. However, the 4-hour chart presents a more bullish picture, with the MACD signaling positive momentum. The ADX on the 1-hour chart is at 31.48, indicating a strong uptrend. It's a tug-of-war between short-term exhaustion and medium-term bullishness.
Multi-Timeframe Analysis: Conflicting Signals
A multi-timeframe analysis reveals conflicting signals. On the daily chart, ETHUSD faces resistance at $2,101.29. The RSI sits at 53.77, suggesting the asset has room to move higher before reaching overbought territory. However, the MACD indicates positive momentum. This divergence highlights the need for caution. The 1-hour chart shows immediate resistance at $2,068.22. A breakout above this level would open the door for a test of $2,073.07. Conversely, failure to break higher could lead to a retest of support at $2,056.02.
On-Chain Metrics: What's Really Happening?
Beyond the technicals, it's important to assess what's happening on-chain. Active addresses have seen a slight increase, indicating growing network activity. Whale movements are also worth monitoring. Large transfers to exchanges could signal selling pressure, while outflows from exchanges may indicate accumulation. DeFi activity is also a key factor. Increasing TVL (Total Value Locked) in DeFi protocols suggests growing confidence in the Ethereum ecosystem. Keep an eye on gas fees as well. High gas fees can deter smaller transactions and impact overall network usage. The current positive trend in active addresses and TVL could mean an increase in the price of ETHUSD.
Regulatory Winds: A Double-Edged Sword
Regulatory news continues to cast a long shadow over the crypto market. Recent discussions around stricter KYC (Know Your Customer) and AML (Anti-Money Laundering) regulations could dampen enthusiasm. Conversely, positive developments, such as the approval of a spot ETH ETF, could trigger a significant rally. The current regulatory landscape is a double-edged sword, capable of both hindering and boosting ETHUSD. We need to be aware of the risks and opportunities that could arise.
Bitcoin Dominance and Altcoin Correlations
Bitcoin dominance is another important factor to consider. A rising Bitcoin dominance often coincides with a pullback in altcoins, including ETHUSD. Conversely, a declining Bitcoin dominance can create opportunities for altcoins to outperform. At the moment, Bitcoin is showing strength. This could suggest that ETHUSD may face headwinds in the near term. Moreover, ETHUSD's correlation with other altcoins can provide valuable insights. If other altcoins are showing weakness, it could be a warning sign for ETHUSD as well.
The DXY Factor: A Headwind for ETHUSD?
The dollar index (DXY) is currently at 99.38, up 0.5% on the day. As the dollar strengthens, it tends to put pressure on ETHUSD. This inverse correlation is crucial to understand. With the DXY showing strength, ETHUSD faces a significant headwind. Traders need to be mindful of this relationship and adjust their positions accordingly. The recent break above 99 on the DXY is not a small event, and should be taken into account.
What the Fed is Signaling
Federal Reserve policy continues to be a major driver of market sentiment. Expectations for future rate hikes can significantly impact ETHUSD. According to Reuters, "Fed officials emphasized that inflation remained 'stubborn'." This hawkish tone could support further dollar strength and weigh on ETHUSD. Traders should closely monitor upcoming Fed meetings and economic data releases for clues about the future direction of monetary policy. The Fed is currently not in a good place, which could be bad for ETHUSD.
Trading ETHUSD: A Watch Zone for Now
Given the conflicting signals and the challenging macro environment, ETHUSD is currently in a watch zone. A daily close above $2,101.29 would open the door for a test of the resistance at $2,131.95. Conversely, a break below $2,056.02 would signal further downside potential, with a target of $2,048.67. Patience is key here. Wait for a clear breakout or breakdown before committing to a position. The current environment is not conducive to chasing momentum.
Trading cryptocurrencies involves significant risk. The market is highly volatile and prone to unexpected swings. Always use proper risk management techniques and never invest more than you can afford to lose.
Frequently Asked Questions: ETHUSD Analysis
What happens if ETHUSD breaks above $2,101.29 resistance?
A break above the $2,101.29 resistance level could open the door for a test of the next resistance level at $2,131.95. This would suggest renewed bullish momentum and could attract further buying interest.
Should I buy ETHUSD at current levels of $2,129.96 given RSI at 71.15?
Given the RSI at 71.15 on the 1-hour chart indicating overbought conditions, buying at current levels carries risk. It would be prudent to wait for a pullback or a breakout above $2,101.29 with confirmation before entering a long position.
Is RSI at 71.15 a sell signal for ETHUSD right now?
While an RSI of 71.15 suggests overbought conditions, it's not a definitive sell signal. It indicates that the asset may be due for a pullback, but the trend could still continue higher. Look for confirmation from other indicators or price action before initiating a short position.
How will the Fed decision affect ETHUSD this week?
If the Fed adopts a hawkish stance and signals further rate hikes, it could strengthen the dollar and put downward pressure on ETHUSD. Conversely, a dovish stance could weaken the dollar and provide a boost to ETHUSD.
Volatility creates opportunity- those prepared will be rewarded. Patient investors always find opportunities- the key is waiting for the right moment.
Track markets in real-time
AI-powered analysis, technical indicators and real-time price data.
Join Our Telegram Channel
Breaking market news, AI analysis and trading signals instantly.
Join Channel