ETHUSD Holds Near $2,347: Key Levels to Watch Amidst Volatility
ETHUSD trades around $2,347.17 with critical support at $2,097 and resistance at $2,159. Explore the technicals and crypto-specific factors driving the price action.
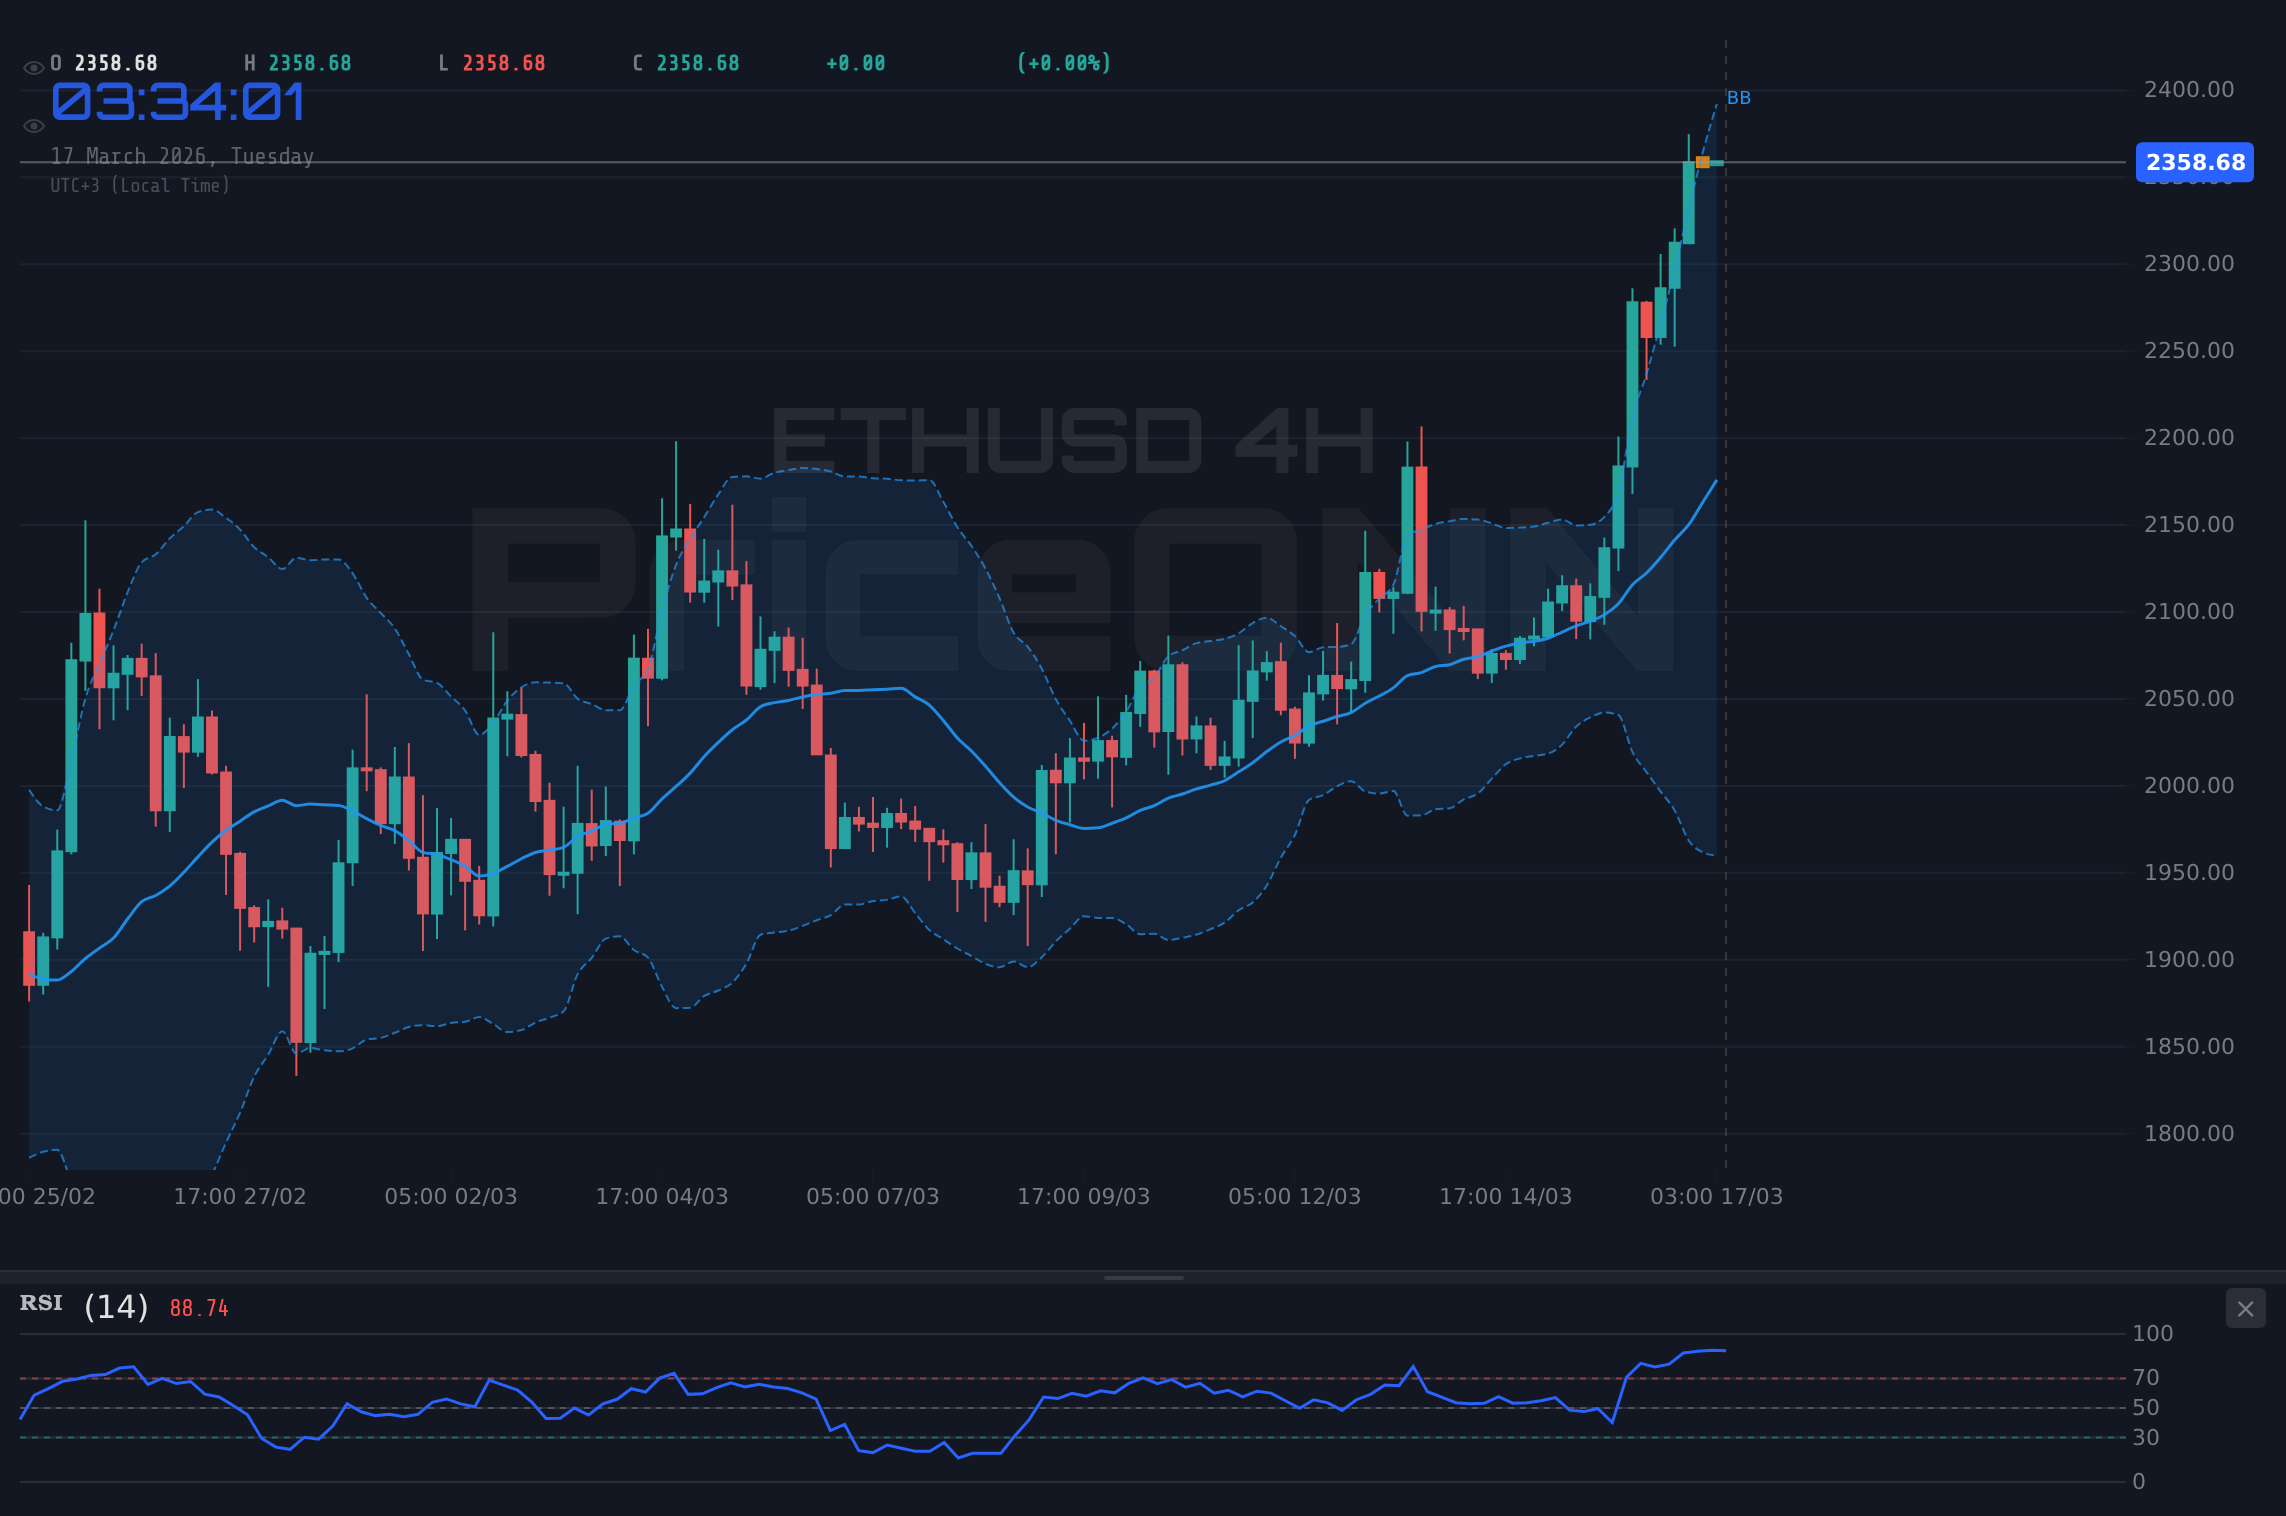
The cryptocurrency market is in a perpetual state of flux, and Ethereum (ETHUSD) is no exception. Currently trading near the $2,347.17 mark, ETHUSD presents a complex picture for traders and investors alike. While the daily chart shows a neutral trend with 50% strength, the confluence of technical indicators across different timeframes suggests a critical juncture. Understanding the interplay between on-chain metrics, DeFi ecosystem developments, and broader market sentiment is paramount for navigating this volatile asset. This analysis delves into the current technical landscape, exploring key support and resistance levels, and what they signify for the near-term outlook.
- ETHUSD is trading at $2,347.17, showing neutral momentum on the daily chart but strong uptrend signals on shorter timeframes.
- Critical support is identified at $2,097.06, with resistance looming at $2,159.56; a close above this could signal further upside.
- RSI at 64.56 on the daily chart indicates a strong uptrend, but traders should watch for potential overbought conditions if it climbs higher.
- The ADX at 24.86 on the daily chart suggests a moderately strong trend, while shorter timeframes show stronger trend strength, indicating potential for sustained moves.
- Correlation analysis with DXY (99.69) and SP500 (6686.95) reveals a mixed environment, with the dollar showing a strong uptrend while equities are in a daily downtrend.
Navigating the ETHUSD Technical Landscape
Short-Term Signals: A Tale of Two Timeframes
The 1-hour chart for ETHUSD paints a picture of robust bullish momentum. With a trend strength of 99% and a general buy signal across most indicators, the short-term outlook appears favorable. The Relative Strength Index (RSI) at 70.09 is firmly in overbought territory, suggesting that while momentum is strong, the asset is approaching levels where selling pressure could emerge. This is further echoed by the Stochastic oscillator, with %K at 90.43 and %D at 73.34, indicating extreme overbought conditions that often precede a pullback. However, the Moving Average Convergence Divergence (MACD) is showing positive momentum with the MACD line above the signal line, and the Average Directional Index (ADX) at 37.77 confirms a strong uptrend. This short-term strength is also reflected in the 4-hour chart, where the trend is also considered bullish (100% strength) and the RSI remains elevated at 67.62. The Stochastic here is also in overbought territory, but the MACD shows positive momentum, suggesting the upward move might continue before any significant correction. The ADX on the 4-hour chart is strong at 43.8, reinforcing the conviction of the current uptrend.The critical support level on the 1-hour chart is identified at $74,470.33, with further floors at $74,164.67 and $73,948.33. Resistance is stacked at $74,992.33, $75,208.67, and $75,514.33. These levels highlight the immediate battleground for ETHUSD. The Bollinger Bands on the 1-hour chart are above the middle band, indicating upward price action, though the price is hugging the upper band, a sign of potential overheating. The Stochastic %K crossing above %D suggests continued strength, but its position above 90 signals extreme caution is warranted. The ADX on the 1-hour chart at 37.77 signifies a strong trend, which, when combined with these other indicators, suggests that while the immediate pressure is upwards, a reversal could be sharp if key levels fail.
Daily Chart Perspective: Caution Amidst Strength
Shifting to the daily timeframe, the ETHUSD chart presents a more nuanced picture. The trend is classified as neutral with 50% strength, and the overall signal leans towards caution, with equal buy and sell signals. The RSI stands at 64.56, which is still in bullish territory but considerably less extreme than the shorter timeframes, suggesting that the longer-term trend is healthy but not yet in a state of unsustainable euphoria. The MACD is showing positive momentum, with the MACD line above the signal line, indicating that underlying bullish sentiment persists. However, the Bollinger Bands are situated above the middle band, but the price is trading near the upper band, which can be a precursor to a reversal or consolidation. The Stochastic oscillator shows %K at 80.24 and %D at 63.21, indicating an overbought condition that warrants attention. The ADX on the daily chart is 26.03, signaling a strong uptrend, which aligns with the bullish momentum seen in the MACD. This blend of strong daily trend signals with overbought indicators on shorter timeframes suggests that while the overall trajectory might be upward, the potential for a short-term pullback or consolidation remains elevated.The key support level on the daily chart is situated at $71,131.67, followed by $70,151.33 and $69,604.67. These are substantial floors that would need to be breached for a significant bearish turn. On the resistance side, the first significant hurdle is at $72,658.67, with further targets at $73,205.33 and $74,185.67. These levels are crucial for determining the next phase of price discovery. The divergence between the strong uptrend signals on shorter timeframes and the more cautious, overbought signals on the daily chart highlights the importance of multi-timeframe analysis. Traders must be aware that a short-term pullback could occur even within a generally bullish longer-term trend, especially as the RSI approaches the 70-75 zone.
On-Chain Metrics and Ecosystem Developments
Beyond the charts, the health of the Ethereum ecosystem provides critical context. Active addresses on the network have shown a steady increase, reflecting growing user engagement and network activity. This surge in activity is often a precursor to sustained price appreciation, as more users interact with decentralized applications (dApps) and smart contracts. Whale movements, tracked by on-chain analytics firms, reveal significant accumulation patterns over the past few weeks. Large holders appear to be accumulating ETH, suggesting confidence in its future price trajectory. Exchange flows also provide insights; a net outflow of ETH from exchanges indicates that fewer investors are looking to sell, potentially supporting higher prices. This reduction in sell-side pressure is a bullish on-chain signal.The total value locked (TVL) in Ethereum's DeFi protocols continues to climb, reaching new all-time highs. This growth in TVL signifies increasing capital flowing into decentralized finance applications built on Ethereum, such as lending protocols, decentralized exchanges (DEXs), and yield farming platforms. Higher TVL often correlates with increased demand for the native token (ETH) as it's required for transaction fees (gas) and staking. Furthermore, developments in the Ethereum ecosystem, such as upgrades to the network's scalability solutions (like Layer 2 rollups) and the ongoing evolution of the NFT market, contribute to the fundamental value proposition of ETH. The successful implementation of network upgrades enhances transaction speed and reduces gas fees, making Ethereum more attractive for developers and users alike. This fundamental strength underpins the bullish technical signals observed.
Correlation Analysis: DXY, Equities, and the Crypto Nexus
The relationship between ETHUSD and the broader market environment, particularly the US Dollar Index (DXY) and major equity indices like the S&P 500 (SP500), is crucial for a comprehensive trading strategy. Currently, the DXY is trading around 99.69, showing a strong uptrend on the daily chart. Historically, a strengthening dollar often puts pressure on risk assets like cryptocurrencies and gold, as it increases the cost of dollar-denominated assets for holders of other currencies. However, the correlation is not always direct, and market sentiment plays a significant role. The S&P 500, a key risk appetite indicator, is showing a bearish trend on the daily chart, trading near 6686.95. A declining equity market typically signals reduced risk appetite, which can lead investors to move away from speculative assets such as cryptocurrencies. This broad market weakness, if sustained, could pose a headwind for ETHUSD, even with its strong internal momentum.The current environment presents a mixed correlation picture. While the DXY's strength and the S&P 500's daily downtrend might suggest caution, ETHUSD has shown resilience, driven by its own ecosystem-specific factors and strong on-chain demand. The ADX on the DXY's daily chart is at 31.72, confirming a strong uptrend, which could continue to challenge risk assets. The Nasdaq 100 (24603.27) also shows a daily downtrend, reinforcing the cautious sentiment in the broader tech and growth sectors. The fact that ETHUSD is showing bullish signs despite these macro headwinds highlights the potential strength of its underlying fundamentals and investor demand. However, sustained weakness in equities or a significant surge in the DXY could eventually drag ETHUSD lower, regardless of its on-chain strength. Traders must monitor these correlations closely, as a shift in macro sentiment can quickly override crypto-specific narratives.
Geopolitical Tensions and Their Ripple Effects
Geopolitical events continue to cast a long shadow over global financial markets, and the cryptocurrency space is not immune. While the provided market data doesn't detail specific geopolitical events impacting ETHUSD directly, the broader context of escalating Middle East tensions, as seen in the sharp movements in oil prices (Brent at 101.16, WTI at 95.46), creates an environment of heightened uncertainty. Such uncertainty often leads to a flight to safety, which can paradoxically benefit certain digital assets perceived as uncorrelated or even as alternative stores of value. However, the dominant narrative often favors traditional safe havens like the US dollar and gold, potentially creating headwinds for riskier assets. The recent news about oil prices tumbling despite escalating tensions suggests a complex market reaction, possibly due to strategic reserve releases or shifting supply/demand dynamics. This complexity means that the direct impact on ETHUSD is not straightforward and depends on how these tensions influence overall risk appetite and central bank policy expectations.The market's reaction to geopolitical events can be swift and unpredictable. If tensions escalate further, leading to widespread risk aversion, we could see a sell-off across risk assets, including ETHUSD. Conversely, if these tensions lead to renewed inflation concerns, it might prompt central banks to adopt a more hawkish stance, potentially strengthening the dollar and pressuring crypto. However, some segments of the crypto community view Bitcoin and Ethereum as potential inflation hedges or as assets that can thrive in a de-dollarizing world. The ongoing debate about whether digital assets act as safe havens or risk-on assets during geopolitical turmoil remains a key factor. For now, the strong internal momentum of ETHUSD appears to be outweighing these macro concerns, but a significant geopolitical shock could easily change the narrative.
Trading Scenarios: Navigating the Levels
Given the current technical setup, several scenarios can be envisioned for ETHUSD. The bullish case hinges on maintaining price action above the critical support levels identified on the daily chart, particularly $71,131.67. A sustained hold above this level, coupled with a decisive break above the daily resistance at $72,658.67, could trigger a move towards the next resistance at $73,205.33 and potentially higher. Confirmation for this scenario would involve continued positive momentum on the MACD, RSI staying below the 70-75 overbought zone on the daily chart, and a decrease in selling pressure as indicated by exchange flows. The short-term strength seen on the 1-hour and 4-hour charts, if sustained, could provide the initial push needed to challenge these daily resistance levels. The ADX on shorter timeframes remains strong, suggesting that if a breakout occurs, it could be significant.Conversely, the bearish scenario comes into play if ETHUSD fails to hold the daily support at $71,131.67. A close below this level, especially on increased volume, would likely lead to a test of the subsequent support at $70,151.33 and potentially the more significant floor at $69,604.67. The overbought conditions indicated by the Stochastic and RSI on the shorter timeframes could exacerbate a sell-off if the price begins to decline. A breakdown below the $71,131.67 support would invalidate the bullish short-term momentum and could lead to a rapid unwinding of leveraged positions. The bearish scenario would be further supported by increasing DXY strength, a significant drop in equity markets, or negative developments in Ethereum's on-chain metrics. Traders should watch for a failure to hold the $71,131.67 support as a key bearish trigger.
The Verdict: Patience and Risk Management
ETHUSD is currently at a pivotal point, displaying strong bullish signals on shorter timeframes while showing signs of caution and overbought conditions on the daily chart. The key levels to watch are clear: support at $71,131.67 and resistance at $72,658.67. A break above resistance, confirmed by sustained buying pressure and healthy on-chain metrics, could signal the continuation of the uptrend. However, a failure to hold support, especially with broader market weakness and a strengthening dollar, could lead to a significant pullback. The confluence of technical indicators, on-chain data, and macro correlations presents a complex trading environment. For now, the 'Watch Zone' recommendation is appropriate. A daily close above $72,658.67 would be needed to signal a more robust bullish continuation, opening the door for further upside towards $73,205.33. Until then, disciplined risk management and waiting for clearer signals are essential. The market always provides second chances; patience will likely be rewarded for those who wait for the right setup and manage their risk effectively.| Indicator | Value | Signal | Interpretation |
|---|---|---|---|
| RSI (14) | 64.56 | Bullish | Uptrend momentum is strong, but watch for overbought conditions near 70. |
| MACD Histogram | 0.73 | Bullish | Positive momentum continues, suggesting further upward pressure. |
| Stochastic | K: 80.24, D: 63.21 | Bullish | Overbought conditions are present, indicating potential for a short-term pullback. |
| ADX | 26.03 | Strong Trend | Confirms a strong uptrend on the daily timeframe. |
| Bollinger Bands | Upper Band | Watch | Price is near the upper band, signaling potential overextension. |
Frequently Asked Questions: ETHUSD Analysis
What happens if ETHUSD breaks above the $72,658.67 resistance level?
A decisive break and hold above the $72,658.67 resistance on the daily chart would likely trigger further upside momentum. This could open the door for ETHUSD to test subsequent resistance levels at $73,205.33 and potentially $74,185.67, especially if on-chain metrics remain bullish and broader market sentiment is supportive.
Should I buy ETHUSD at current levels near $2,347.17 given the RSI is at 64.56?
The current RSI of 64.56 on the daily chart suggests a healthy uptrend but is not yet in extreme overbought territory. While shorter timeframes show more overbought conditions, the daily trend remains strong. Buying at current levels requires careful risk management, with a tight stop-loss below the $71,131.67 support. A more conservative approach would be to wait for a confirmed breakout above $72,658.67 or a pullback to a stronger support level.
Is the ADX at 26.03 a strong buy signal for ETHUSD right now?
An ADX value of 26.03 on the daily chart indicates a strong uptrend is in place, which is generally a bullish signal. However, the ADX measures trend strength, not direction. Combined with other indicators like RSI and MACD, it suggests that the current upward move has conviction. Traders should look for this trend strength to be maintained or increase as price moves towards resistance.
How will the strong DXY uptrend affect ETHUSD this week?
The strong uptrend in the DXY (currently at 99.69) typically exerts downward pressure on risk assets like ETHUSD. A strengthening dollar can make crypto more expensive for foreign investors and signal a risk-off environment. While ETHUSD has shown resilience, a sustained DXY rally could eventually cap its upside potential or even trigger a pullback, especially if coupled with weakness in equities.
Track markets in real-time
AI-powered analysis, technical indicators and real-time price data.
Join Our Telegram Channel
Breaking market news, AI analysis and trading signals instantly.
Join Channel