BTCUSD Tests $72,903 as Bulls and Bears Clash
BTCUSD is testing the $72,903 level amid a battle between bulls and bears. Will it hold, or will we see a significant pullback?
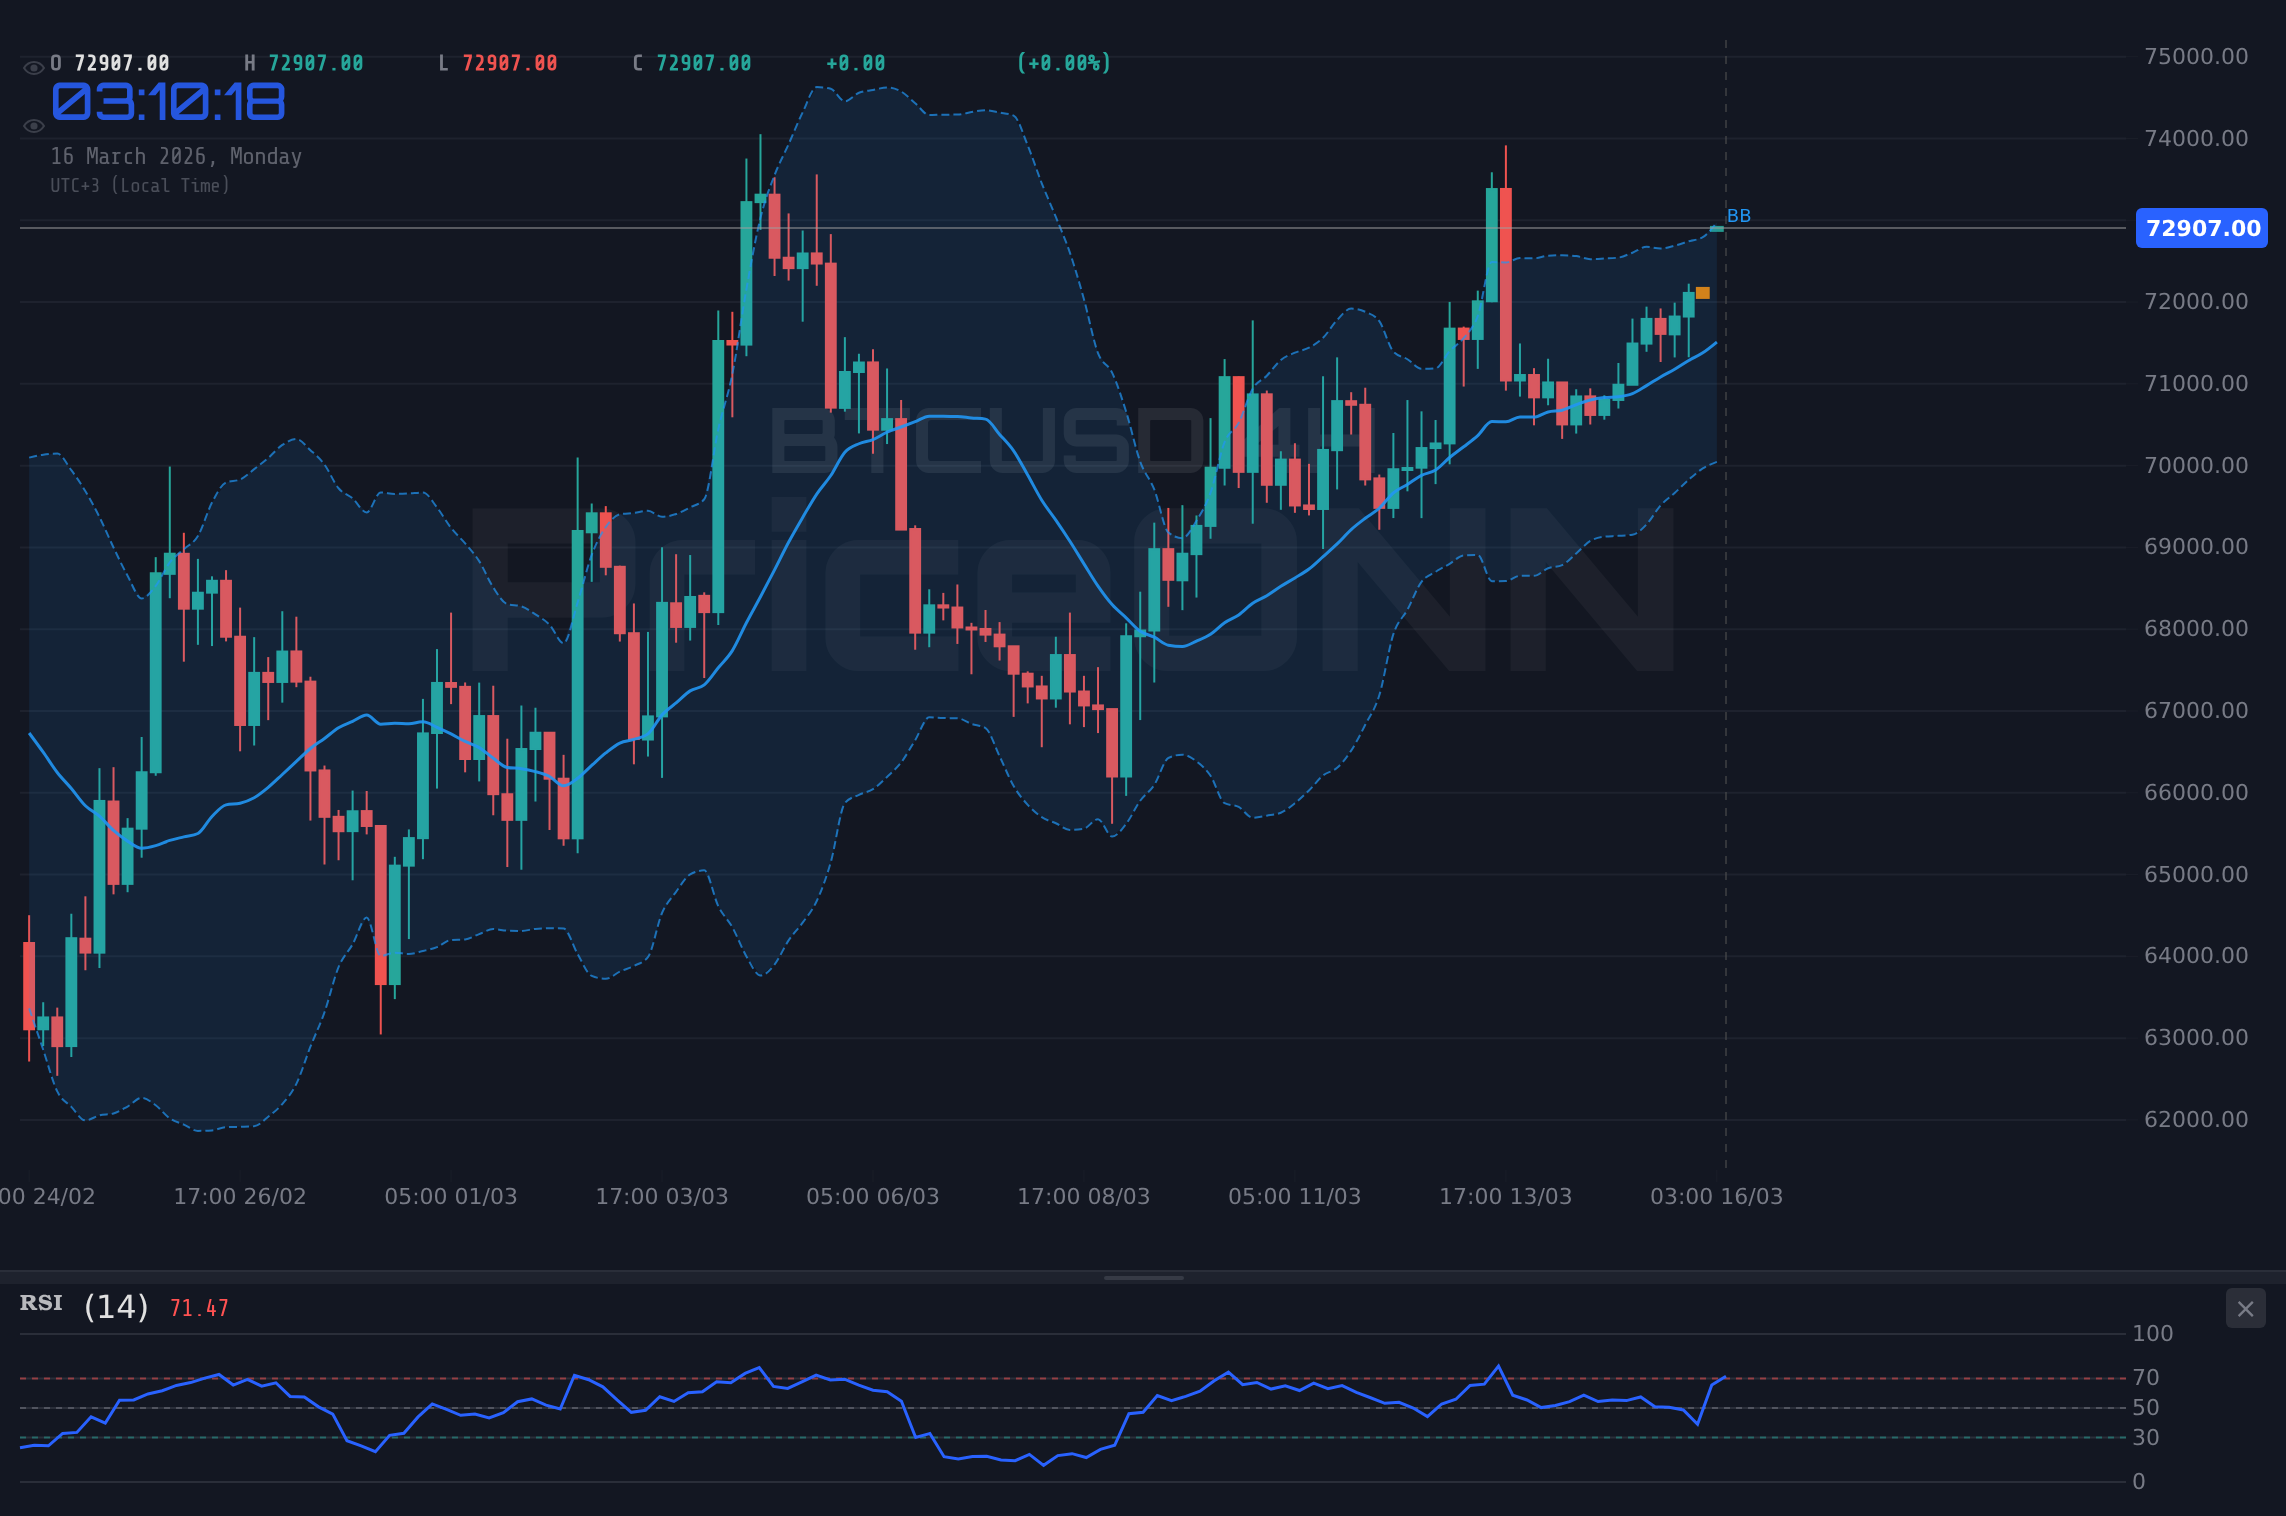
BTCUSD is currently trading around $72,903, where bulls and bears are locked in a fierce battle. The question is, can the bulls maintain control, or will the bears manage to push the price lower?
- RSI at 73.42 suggests overbought conditions on the 1H timeframe, potentially signaling a pullback.
- Key support level to watch is $71,965, a break below this could trigger further downside.
- MACD histogram is positive, but with a potential divergence, indicating fading bullish momentum.
- Upcoming regulatory clarity act deadline could significantly impact BTCUSD volatility.
The Bull Case for BTCUSD at $72,903
The bullish scenario for BTCUSD hinges on several factors. First, the overall trend on the daily chart remains upward, despite the current consolidation. The daily RSI, while at 56.79, still has room to run before reaching overbought territory. Furthermore, the MACD on the daily timeframe is positive, indicating continued bullish momentum, although it's weakening.
On-chain metrics also support the bull case. Active addresses remain high, signaling continued network activity and adoption. Whale movements, while always a factor to watch, haven't shown any significant outflows from exchanges, suggesting that large holders are not yet selling off their positions. Moreover, the recent approval of Bitcoin ETFs has opened the door to significant institutional investment, which could provide a sustained tailwind for BTCUSD.
Click to expand
Technically, a sustained break above the immediate resistance at $73,295 on the 1H chart could open the door for a move towards $73,842 and potentially $74,625. The stochastic on the 1H chart shows K=84.79, D=58.6, which signals a continuation of the bullish trend. A successful retest of the $71,965 support could confirm bullish strength. A daily close above $73,000 would further validate the bullish outlook, setting the stage for new all-time highs.
The Bear Case Against BTCUSD at $72,903
Despite the bullish arguments, there are several reasons to be cautious about BTCUSD at these levels. The most immediate concern is the overbought condition on the 1H chart, with the RSI at 73.42. This suggests that the market is due for a pullback, as buyers become exhausted and profit-taking ensues. The negative momentum on the MACD, although not yet confirmed, is a warning sign that bullish momentum is waning. The stochastic on the 1H chart shows K>D, which signals a potential reversal.
From a fundamental perspective, regulatory uncertainty remains a significant headwind for BTCUSD. The CLARITY Act faces a critical April deadline, and failure to advance could spook investors and lead to a sell-off. Concerns about energy consumption and environmental impact also continue to dog Bitcoin, potentially limiting its appeal to some institutional investors.
Technically, a break below the immediate support at $71,965 on the 1H chart could trigger a move towards $71,182 and potentially $70,635. The overall signal on the 1H timeframe is "AL" however this is based on mixed signals. The ADX at 32.14 indicates a strong upward trend, but this could be misleading if the RSI signals overbought conditions. A daily close below $70,000 would invalidate the bullish outlook and open the door for a deeper correction.
Technical Signals: Bullish Momentum vs. Overbought Conditions
The technical picture for BTCUSD is mixed, with bullish momentum clashing with overbought conditions. On the 1H chart, the RSI at 73.42 signals that the market is overbought, while the MACD histogram is positive, indicating continued bullish momentum. The stochastic on the 1H chart is also overbought, suggesting that the market is due for a pullback. However, the ADX at 32.14 indicates a strong upward trend, which could override the overbought signals.
On the 4H chart, the RSI is at 65.07, which is in neutral territory, while the MACD histogram is positive, indicating continued bullish momentum. The stochastic on the 4H chart is also overbought, suggesting that the market is due for a pullback. However, the ADX at 31.1 indicates a strong upward trend, which could override the overbought signals.
On the daily chart, the RSI is at 56.79, which is in neutral territory, while the MACD histogram is positive, indicating continued bullish momentum. The stochastic on the daily chart is also overbought, suggesting that the market is due for a pullback. However, the ADX at 25.61 indicates a strong upward trend, which could override the overbought signals.
The Verdict: Watch $71,965 for Confirmation
Given the conflicting signals, the best course of action is to remain cautious and wait for confirmation. A break above $73,295 on the 1H chart would confirm the bullish outlook and open the door for a move towards $73,842 and potentially $74,625. Conversely, a break below $71,965 on the 1H chart would invalidate the bullish outlook and open the door for a move towards $71,182 and potentially $70,635. If Saudi Arabia's NEOM Revision causes Oil Price Volatility, this could cause a risk off event sending BTCUSD lower.
Frequently Asked Questions: BTCUSD Analysis
What happens if BTCUSD breaks above $73,295 resistance?
A break above $73,295 resistance on the 1H chart could trigger a move towards the next resistance levels at $73,842 and $74,625. This would confirm the bullish outlook and set the stage for new all-time highs.
Should I buy BTCUSD at current levels of $72,903 given RSI at 73.42?
Given the overbought conditions on the 1H chart, it may be prudent to wait for a pullback before entering a long position. A retest of the $71,965 support could provide a more favorable entry point.
Is RSI at 73.42 a sell signal for BTCUSD right now?
While RSI at 73.42 suggests overbought conditions, it is not a definitive sell signal. It would be prudent to wait for confirmation from other indicators, such as a break below the $71,965 support level, before entering a short position.
How will the CLARITY Act decision affect BTCUSD this week?
The outcome of the CLARITY Act decision could have a significant impact on BTCUSD this week. If the act fails to advance, it could spook investors and lead to a sell-off. Conversely, if the act passes, it could provide regulatory certainty and boost investor confidence.
Track markets in real-time
Empower your investment decisions with AI-powered analysis, technical indicators and real-time price data.
Join Our Telegram Channel
Get breaking market news, AI analysis and trading signals delivered instantly to your Telegram.
Join Channel