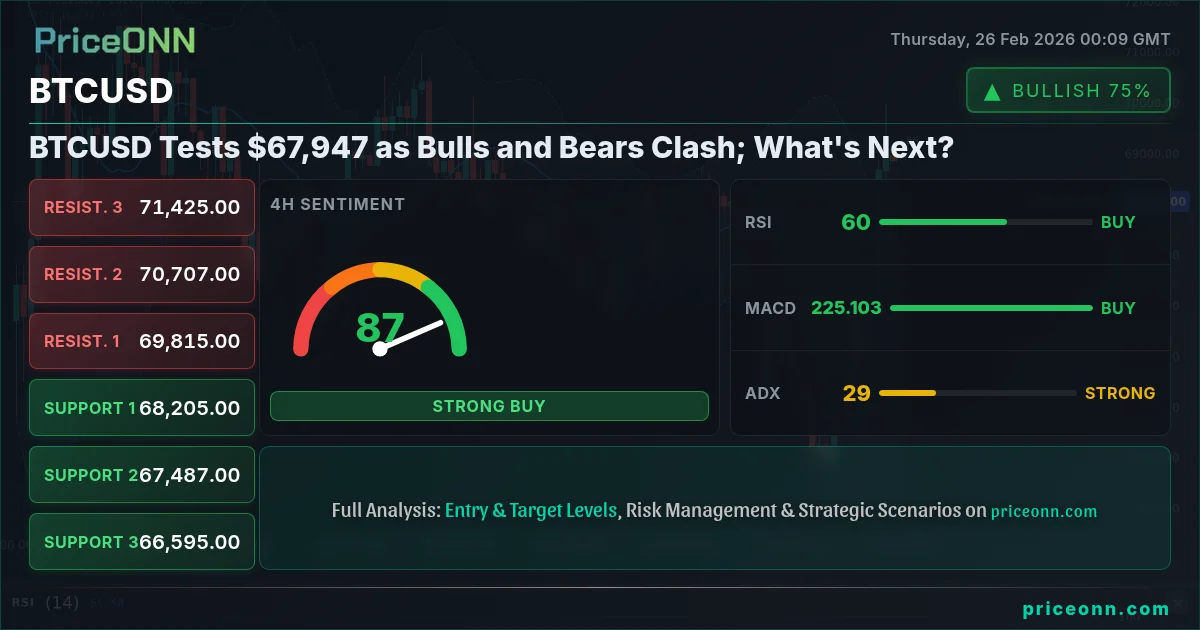
BTCUSD is currently trading around $67,947, a pivotal level where bullish hopes and bearish realities are colliding. After a significant rally, Bitcoin faces a crucial test: can it sustain its upward momentum, or is this just a temporary reprieve before another leg down? The tension between buyers and sellers at this juncture sets the stage for a potentially volatile period, demanding a careful analysis of technical indicators and market sentiment.
The Bull Case for BTCUSD: Momentum and Technical Breakouts
The bullish narrative hinges on several factors. First, BTCUSD has demonstrated considerable strength in recent trading sessions, rebounding from lower levels with significant buying pressure. The 1-hour chart shows a strong uptrend, with the ADX at 36.01, confirming the strength of the current rally. The RSI, currently at 61.8, is in neutral territory but trending upwards, suggesting that there's room for further gains before the asset becomes overbought.
Moreover, the MACD on the 1-hour timeframe is displaying positive momentum, with the MACD line above the signal line, reinforcing the bullish signal. This technical alignment suggests that buyers are in control and that the upward trend is likely to continue. A successful break above the immediate resistance at $69,073 could pave the way for a test of higher levels, potentially targeting $69,686 and beyond. The SP500 is showing strength, up 0.73% today, which indicates risk-on sentiment is helping crypto.
From a multi-timeframe analysis perspective, while the 1-day chart still indicates a downtrend, the shorter timeframes are showing signs of reversal. The Stochastic on the daily chart is at 34.06, signaling oversold conditions. If this indicator crosses upwards, it could confirm a broader trend reversal. This bullish scenario also depends on sustained weakness in the DXY, which is currently at 97.35. A further decline in the dollar index would provide additional tailwinds for BTCUSD.
The Bear Case for BTCUSD: Resistance and Overextended Conditions
However, the bearish perspective presents a compelling counter-argument. Despite the recent rally, BTCUSD faces significant resistance at the $69,000 level, which has historically acted as a strong ceiling. A failure to break above this level could trigger a wave of selling pressure, leading to a retracement towards key support levels. The daily chart’s ADX at 54.91 indicates a very strong downtrend, which still needs to be overcome.
The Stochastic indicator on the 1-hour chart, with K=56.71 and D=82.47, shows a potential overbought condition. The %K is below %D which is a bearish sign. This, coupled with negative momentum in MACD on the 4H chart, suggests that the current rally might be losing steam. The RSI on the daily chart, at 42.62, is in neutral territory but trending downwards, indicating weakening bullish momentum. Brent Crude Oil is up nearly 2% today, which could add to inflationary worries.
Furthermore, the overall market sentiment remains cautious, with regulatory uncertainties and macroeconomic headwinds continuing to weigh on investor confidence. The upcoming high-impact USD data could introduce volatility. If the data comes in stronger than expected, it could strengthen the dollar and put downward pressure on BTCUSD. This bearish scenario would be further validated if BTCUSD breaks below the immediate support at $67,444, potentially targeting lower supports at $66,831 and $65,000.
Technicals as Tiebreaker: Multi-Timeframe Analysis
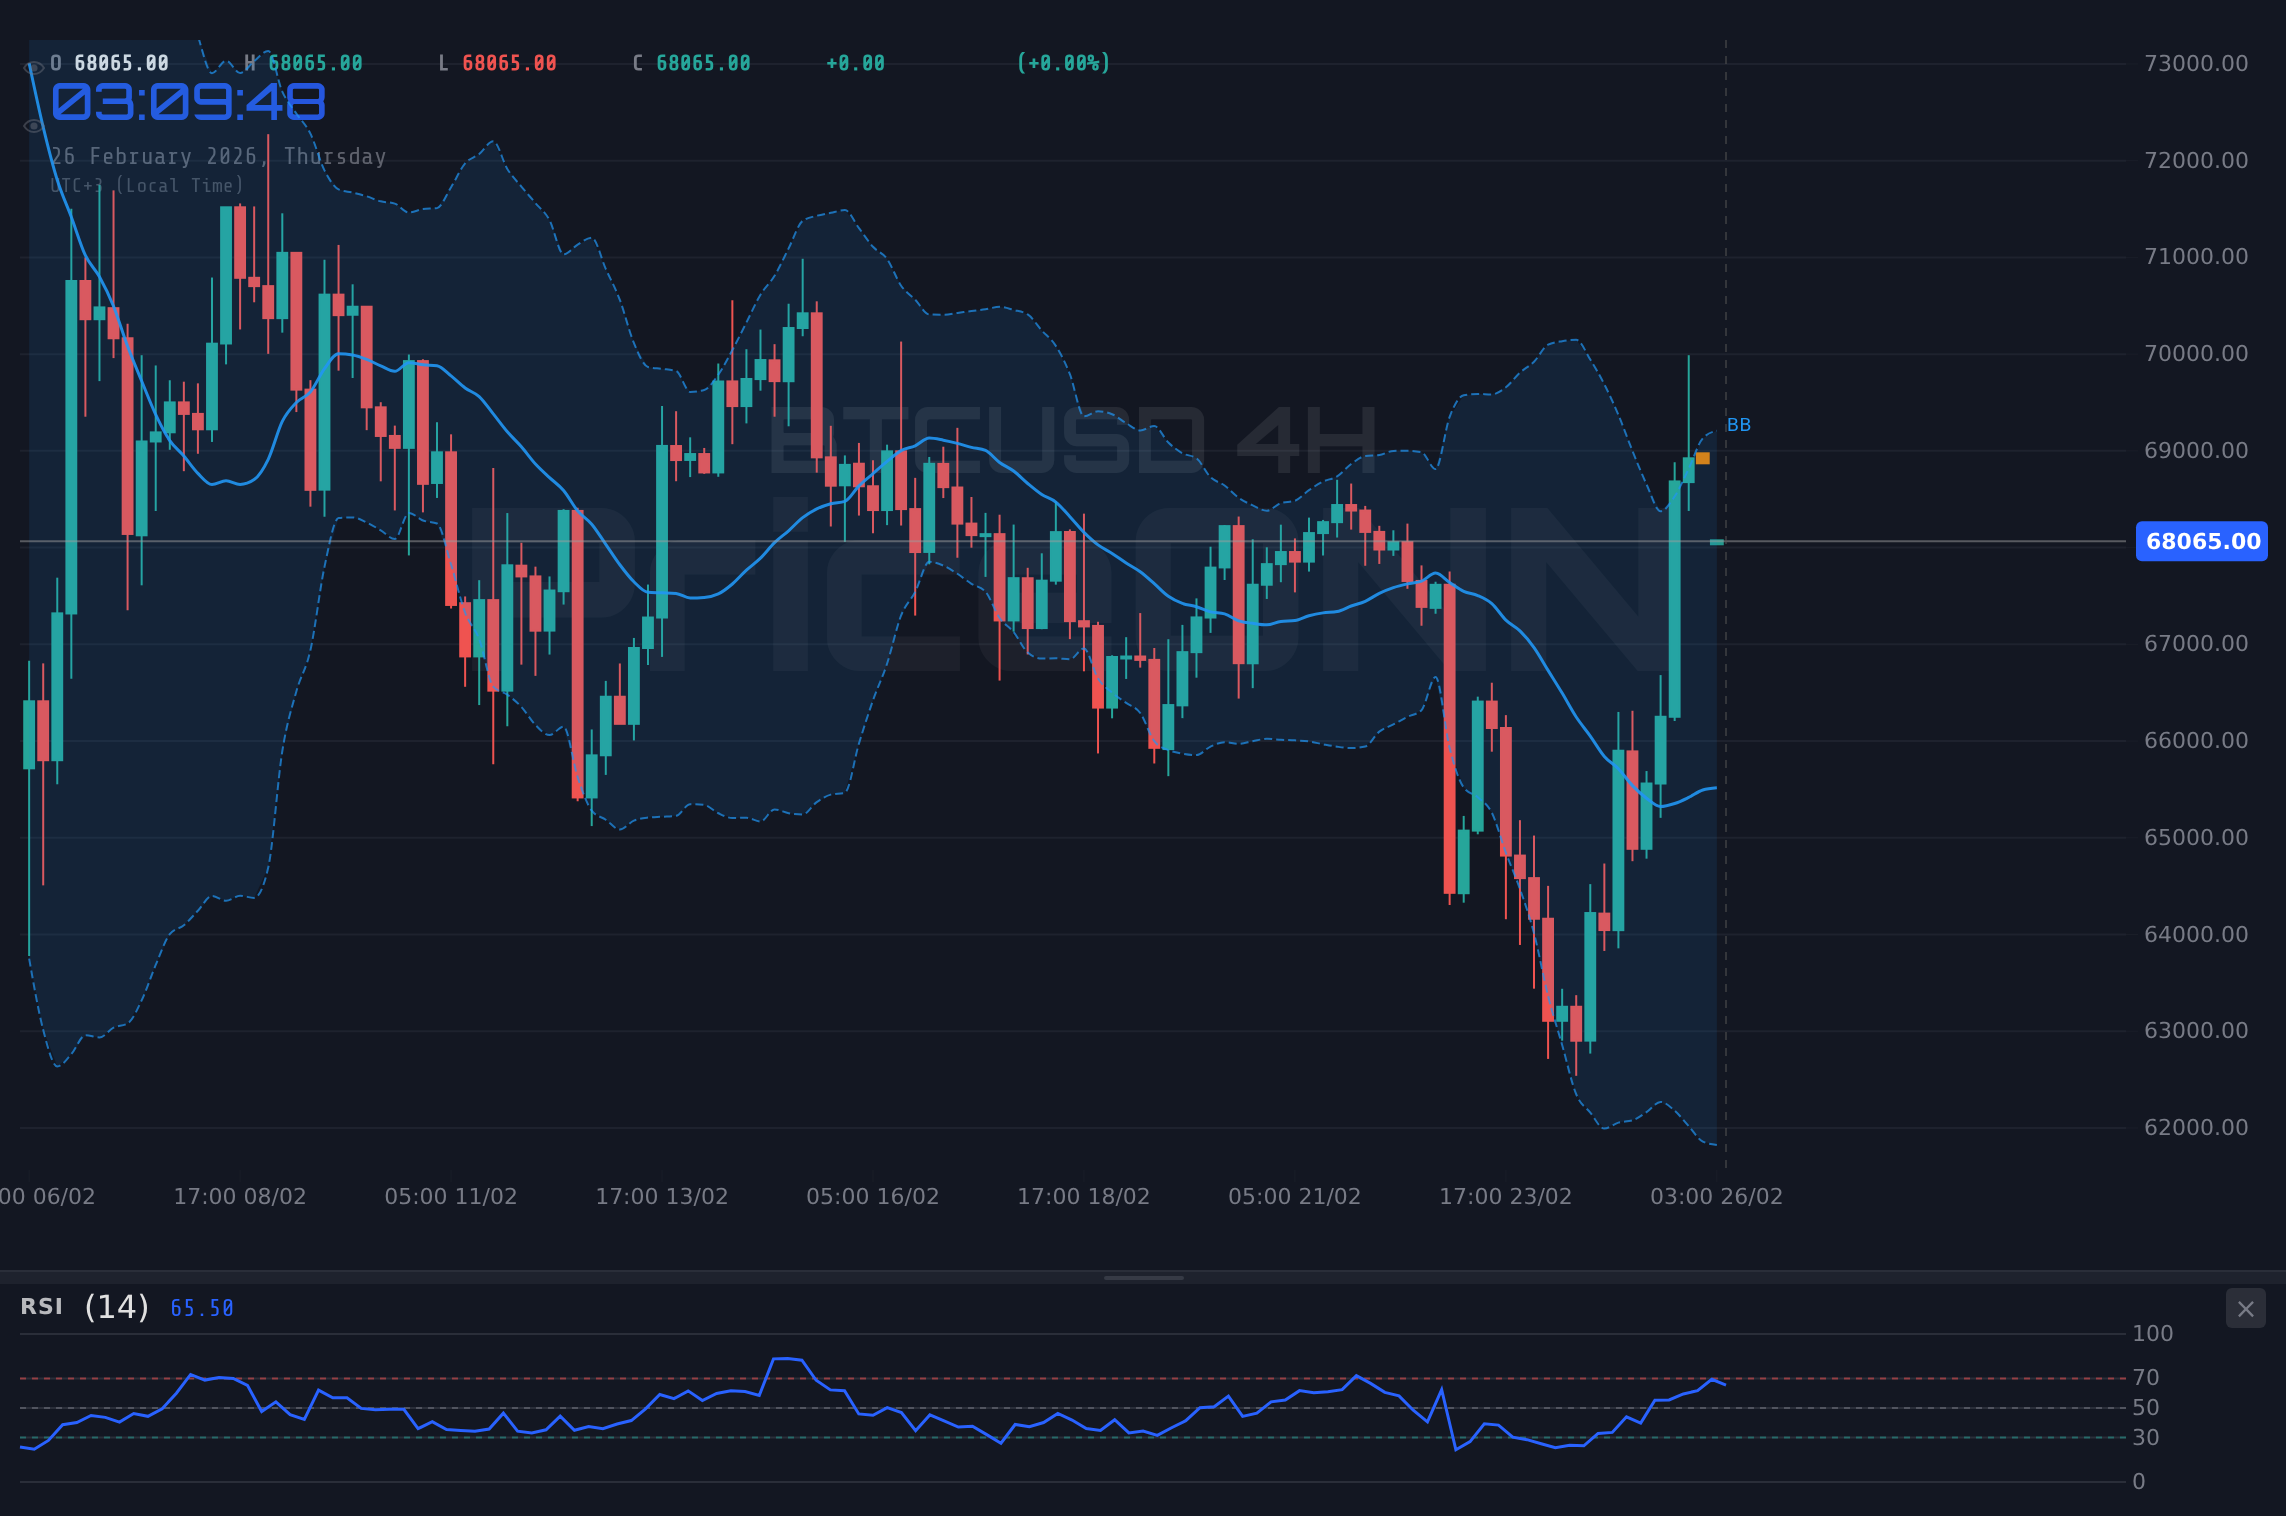
To reconcile these conflicting signals, a multi-timeframe analysis is essential. While the short-term charts (1H and 4H) suggest bullish momentum, the daily chart paints a more cautious picture. The key lies in observing how BTCUSD reacts to the immediate resistance at $69,073. A decisive break above this level, accompanied by strong volume, would confirm the bullish scenario. Conversely, a failure to breach this resistance could signal a bearish reversal.
The 4-hour chart's indicators provide additional clues. The RSI at 58.86 is neutral but trending upwards, suggesting potential for further gains. The MACD histogram is positive, indicating increasing bullish momentum. However, the Stochastic indicator, with K=86.36 and D=74.75, is nearing overbought territory, which could trigger a pullback. The key support levels to watch are $67,952 and $67,444. Holding above these levels would maintain the bullish bias, while a break below could signal a shift in momentum.
Analyzing the broader market context, the DXY's performance will continue to play a crucial role. If the dollar index weakens further, it would provide additional support for BTCUSD. Conversely, a strengthening dollar could exacerbate the bearish pressure. Monitoring the SP500 is also important, as risk-on sentiment in the equity markets tends to correlate positively with Bitcoin's price action. A significant downturn in the SP500 could trigger a flight to safety, potentially impacting BTCUSD negatively.
Trade Plan for BTCUSD: Navigating the Volatility
Given the conflicting signals and the potential for volatility, a well-defined trade plan is essential. Here’s a strategy that considers both bullish and bearish scenarios.
BTCUSD breaks above $69,073 resistance, confirming bullish momentum. The uptrend is sustained with strong volume, targeting $69,686 and potentially $70,194.
BTCUSD fails to break $69,073 and falls below $67,444 support, signaling a potential downtrend. Targets include $66,831 and $65,000.
Economic Events and Risk Considerations
Traders should closely monitor upcoming economic events, particularly high-impact USD data releases. According to the economic calendar, the next releases are highly anticipated. Stronger-than-expected data could boost the dollar, putting downward pressure on BTCUSD. Conversely, weaker data could weaken the dollar and support further gains for Bitcoin. The market consensus is divided on the potential impact, so caution is advised.
Risk management is paramount in such a volatile environment. Traders should use stop-loss orders to limit potential losses and avoid overleveraging their positions. Given the conflicting signals and the potential for surprise economic data releases, a conservative approach is warranted. Patience looks like it will be rewarded here. Manage your risk, wait for your setup - the market always gives a second chance.
Frequently Asked Questions: BTCUSD Analysis
Is BTCUSD a good buy right now?
BTCUSD at $67,947 shows bullish potential but faces resistance at $69,073. A break above this level could signal a buy opportunity, targeting higher levels. However, caution is advised until the resistance is cleared.
What is the BTCUSD price forecast for this week?
The BTCUSD price forecast for this week depends on breaking the $69,073 resistance. If broken, targets include $69,686 and $70,194. Failure to break could lead to a retest of $67,444 support with a 40% probability.
What are the key support and resistance levels for BTCUSD?
Key support levels for BTCUSD are $67,952, $67,444 and $66,831. Key resistance levels are $69,073, $69,686 and $70,194. These levels are crucial for identifying potential entry and exit points.
Why is BTCUSD moving today?
BTCUSD is moving today due to a combination of technical factors and market sentiment. Risk-on sentiment in equities and a weaker DXY are supporting gains. However, resistance at $69,073 is capping further upside.
Technical Outlook Summary
| Indicator | Value | Signal |
|---|---|---|
| RSI (14) | 61.8 | Neutral |
| MACD Histogram | Positive | Bullish |
| Stochastic | 56.71/82.47 | Bearish |
| ADX | 36.01 | Strong Uptrend |
| Bollinger | Middle Band | Watch |
Key Levels
Support Levels
Resistance Levels
Track markets in real-time
AI-powered analysis, technical indicators and real-time price data.
Join Our Telegram Channel
Breaking market news, AI analysis and trading signals instantly.
Join Channel