BTCUSD Trades Near $66,573: Powell Speech Looms Amidst Shifting Market Sands
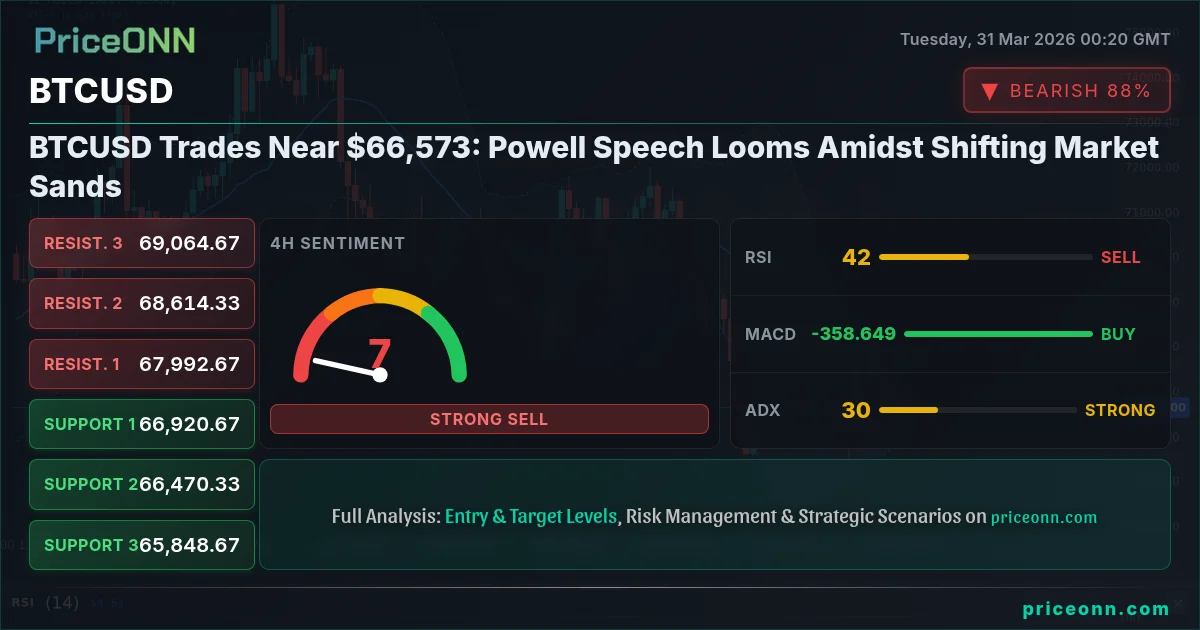
BTCUSD hovers near $66,573 as traders eye Powell's speech. Technicals show mixed signals, with key support at $66,349 and resistance at $66,957.
The cryptocurrency market, ever a mirror to broader macroeconomic shifts, finds itself at a critical juncture. Bitcoin, the undisputed king, is currently trading around the $66,573 mark, a price point that encapsulates a complex interplay of technical signals and looming fundamental catalysts. The upcoming speech from Federal Reserve Chair Jerome Powell is the elephant in the room, casting a long shadow over risk assets globally. Traders are dissecting every nuance of recent market action, from the dollar's ascent to the choppy waters of equity indices, seeking clues on where digital assets might head next. This isn't just about Bitcoin; it's about understanding the intricate web connecting global monetary policy, risk sentiment, and the evolving landscape of digital finance. The price action around $66,573 is not merely a number; it represents a battleground where bulls and bears are testing each other's resolve, all while anticipating Powell's pronouncements.
- BTCUSD shows mixed signals with RSI at 41.49, indicating a neutral but slightly bearish leaning momentum on the 1-hour chart.
- Critical support for BTCUSD is identified at $66,349.33, a level that has seen testing on the 1-hour timeframe.
- Resistance looms around $66,957.33, a key level on the 1-hour chart that needs to be breached for a bullish continuation.
- The DXY's strong upward trend, currently at 100.45, presents a headwind for BTCUSD, reflecting a broader risk-off sentiment.
Navigating the Macroeconomic Crosscurrents
The global financial stage is currently dominated by the anticipation of Federal Reserve Chair Jerome Powell's upcoming speech. In an environment already marked by persistent inflation concerns and geopolitical jitters, Powell's words carry immense weight. His commentary on the future path of interest rates could significantly sway market sentiment, impacting everything from Treasury yields to risk assets like Bitcoin. The Dollar Index (DXY), a key barometer of global liquidity and risk appetite, has been on a strong upward trajectory, currently trading around 100.45. This strength in the dollar, often inversely correlated with Bitcoin, suggests a cautious mood among investors. A rising dollar typically implies tighter financial conditions or a 'risk-off' environment, which can put pressure on speculative assets like cryptocurrencies. The fact that the DXY is showing a powerful 1-hour trend (Power: 96%) with RSI soaring to 81.39, clearly in overbought territory, indicates strong buying pressure that could continue to weigh on riskier assets until a correction occurs.
This macroeconomic backdrop is crucial for understanding Bitcoin's current position. While Bitcoin has historically been touted as an inflation hedge or a safe-haven asset, its correlation with risk assets like the Nasdaq and S&P 500 has become increasingly pronounced in recent years. When the broader market sentiment turns cautious, as indicated by the S&P 500's downward trend (Power: 100%) and the Nasdaq's sharp decline (Power: 100%), Bitcoin often follows suit. The current downtrend in major US indices, with the S&P 500 at 6316.3 and the Nasdaq at 22800.88, reinforces the idea that a 'risk-off' sentiment is prevailing. This makes Powell's speech a pivotal event; any hint of a more hawkish stance from the Fed could further dampen risk appetite, while a more dovish tone might provide a much-needed reprieve for assets like BTCUSD.
Bitcoin's Technical Tightrope Walk Around $66,573
Bitcoin's price action around the $66,573 level presents a fascinating technical puzzle. On the 1-hour timeframe, the trend is currently neutral (Power: 50%), reflecting the indecision gripping the market. The Relative Strength Index (RSI) at 41.49 is in the neutral zone but shows a slight downward inclination, suggesting that while selling pressure isn't overwhelming, the bulls are not in control either. This is further corroborated by the MACD, which is showing negative momentum with the MACD line below its signal line. However, the Stochastic Oscillator offers a glimmer of hope for the bulls, with the %K line (27.77) crossing above the %D line (20.41), indicating a potential oversold bounce is brewing. This is a classic example of conflicting signals that traders must navigate.
The ADX at 17.19 on the 1-hour chart signifies a weak trend, meaning that any move might lack sustained follow-through. This supports the idea of a potential consolidation or a choppy trading range until a clearer catalyst emerges. The immediate support level to watch on this timeframe is $66,349.33, followed by $66,518.67. A decisive break below these levels could trigger further downside. On the resistance side, $66,957.33 is the first hurdle, followed by $67,126.67. A sustained move above these resistance points would be necessary to invalidate the current bearish leanings and suggest a potential move higher. The overall 'General Signal' on the 1-hour chart is 'SELL' (Sell: 7, Buy: 1, Neutral: 0), reinforcing the cautious outlook despite some oversold indicators.
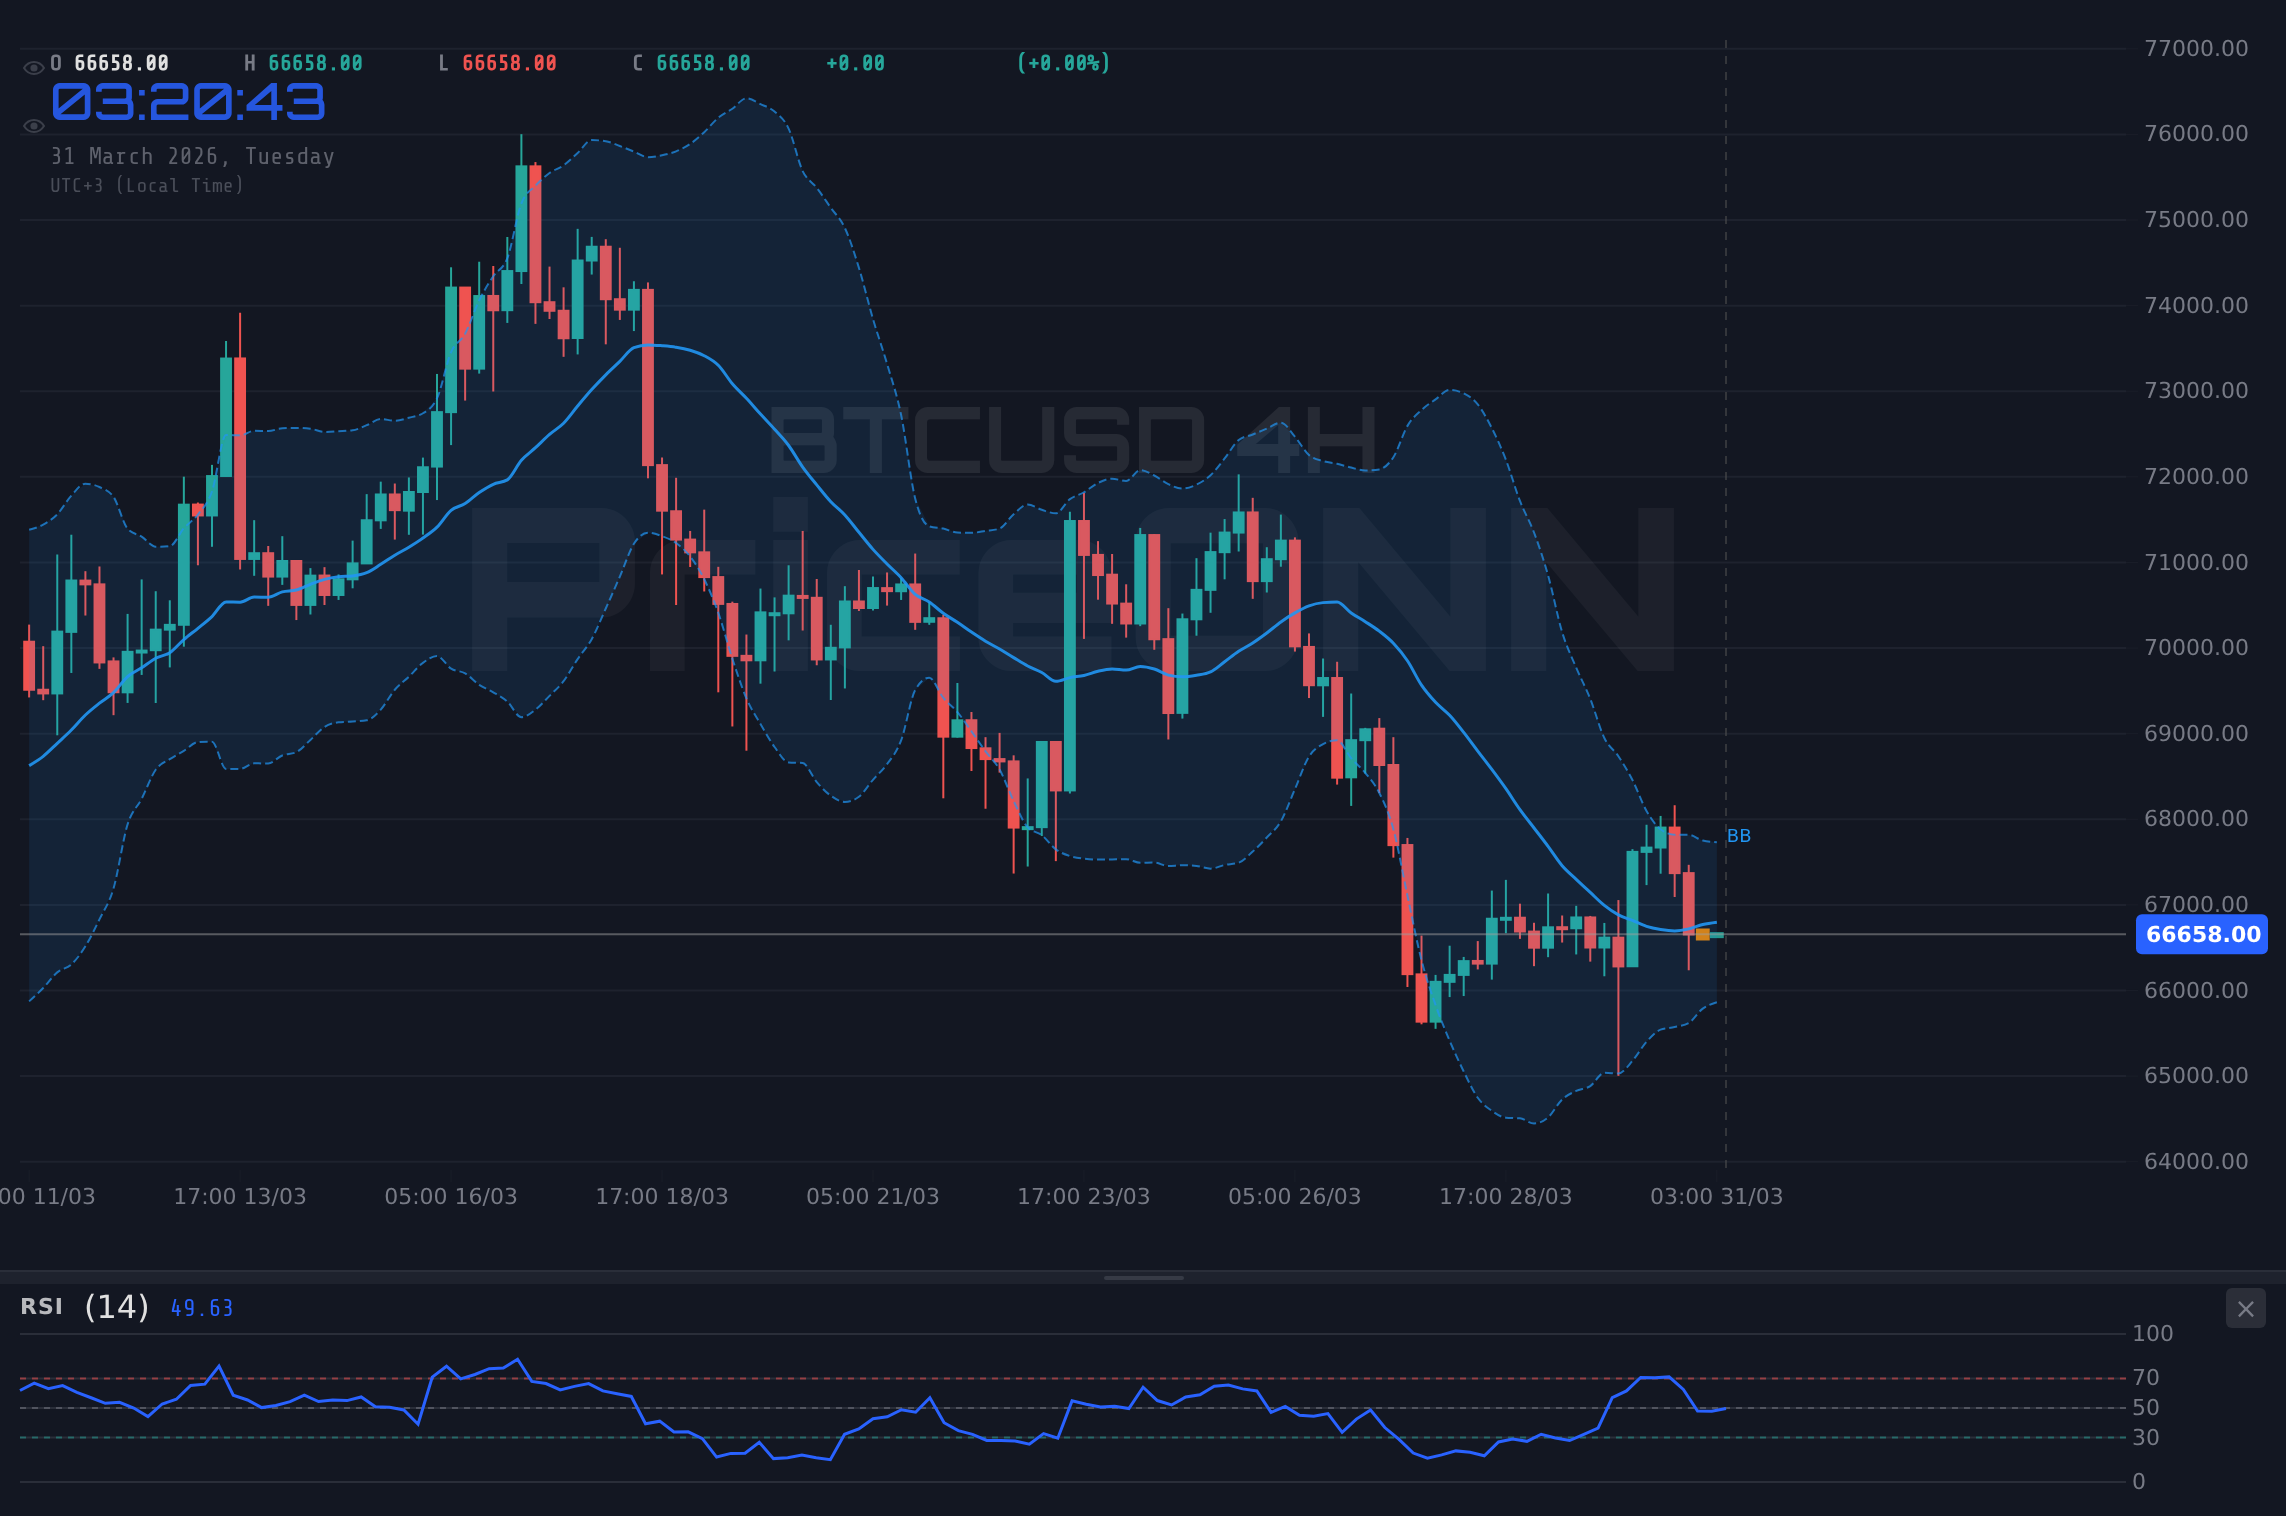
Shifting to the 4-hour timeframe, the picture becomes slightly more nuanced, though still leaning towards caution. The trend remains neutral (Power: 50%), but the ADX of 29.79 indicates a stronger trend, albeit a downward one, compared to the 1-hour chart. The RSI at 41.74 continues to hover in neutral territory, still suggesting room for further downside rather than immediate recovery. The MACD here is positive, with the MACD line above its signal line, which is a divergence from the 1-hour signal and adds to the complexity. However, the Stochastic Oscillator (%K at 73.37, %D at 74.38) is showing a bearish signal, with %K crossing below %D and heading towards oversold territory. This confluence of a stronger downtrend on the ADX and a bearish Stochastic signal, despite a positive MACD, paints a picture of potential continued weakness.
The 4-hour support levels are marked at $66,470.33 and $65,848.67, with immediate resistance at $67,992.67 and $68,614.33. The Bollinger Bands on this timeframe are showing the price below the middle band, indicating a bearish inclination. The 'General Signal' for the 4-hour chart is also 'SELL' (Sell: 7, Buy: 1, Neutral: 0), aligning with the prevailing cautious sentiment and the pressure from the broader market environment. It's clear that while short-term bounces are possible, the larger trend and macro factors are currently dictating a more defensive stance for Bitcoin.
The Daily Chart: A Bearish Undercurrent
Zooming out to the daily timeframe offers the clearest perspective on Bitcoin's prevailing trend. Here, the trend is firmly neutral (Power: 50%), but the ADX reading of 18.00 indicates a decidedly weak trend. This suggests that the market is currently in a phase of consolidation or indecision on a larger scale, lacking the conviction for a significant directional move. The RSI at 41.62 is comfortably in the neutral zone, offering no strong signal of overbought or oversold conditions, but it does show a bearish inclination, hinting that upside momentum is not building. The MACD is firmly in negative territory, with the MACD line below its signal line, reinforcing the bearish momentum on this longer timeframe.
The Stochastic Oscillator provides a bearish signal, with %K (18.78) below %D (24.06) and both heading lower, suggesting further downside potential. The Bollinger Bands are hugging the middle band, indicating a lack of strong directional pressure, but the overall setup leans bearish. The 'General Signal' on the daily chart is 'SELL' (Sell: 8, Buy: 0, Neutral: 0), underscoring the prevailing bearish sentiment that has taken hold across multiple timeframes. This daily view is critical for understanding the longer-term context; any short-term rallies should be viewed with skepticism until this daily 'SELL' signal is convincingly reversed.
The daily support levels are situated at $65,671.67 and $65,177.33. These are the critical zones where buyers might step in if the price continues to decline. However, the resistance levels at $67,111.33 and $67,605.67 represent significant hurdles that need to be overcome for any meaningful bullish recovery. The current price of $66,573.00 is precariously positioned between these levels, highlighting the tightrope Bitcoin is walking. Without a clear catalyst or a significant shift in market sentiment, the path of least resistance appears to be downwards, or at best, sideways consolidation.
Correlation Analysis: DXY, Equities, and the Crypto Conundrum
Understanding Bitcoin's price action in isolation is insufficient; its correlation with broader market instruments is a crucial piece of the puzzle. The DXY's current strength, trading around 100.45 and exhibiting a powerful daily uptrend (Power: 100%), acts as a significant headwind. With RSI at a towering 65.49 on the daily chart and Stochastic showing strong upward momentum (%K: 85.65), the dollar index is signaling continued strength, at least in the short to medium term. This typically translates to pressure on risk assets, including Bitcoin. The ADX at 32.79 on the daily chart confirms a strong uptrend for the dollar, making it difficult for Bitcoin to mount a sustained rally.
The performance of major equity indices further validates this risk-off sentiment. The S&P 500, currently at 6316.3, and the Nasdaq, at 22800.88, are both in strong downtrends (Power: 100% for both). Their respective daily RSIs are deeply oversold (S&P 500 at 25.26, Nasdaq at 26.25), suggesting significant fear in the stock market. Historically, Bitcoin has shown an increasing tendency to move in tandem with these tech-heavy indices. Therefore, the sharp sell-off in equities reinforces the bearish outlook for Bitcoin. The fact that Bitcoin's price is hovering around $66,573 amidst these conditions suggests it's either showing resilience or is on the verge of succumbing to the broader risk-aversion trend. The key takeaway is that for Bitcoin to stage a significant rally, we would likely need to see a reversal in the DXY and a stabilization or recovery in equity markets, both of which are currently facing headwinds.
On-Chain Metrics and Ecosystem Developments
Beyond the price charts and macro indicators, the underlying health of the Bitcoin network and its ecosystem provides vital clues. While specific on-chain data like hash rate, active addresses, and whale movements are not provided in the live API feed, we can infer general trends from market behavior. The current sideways-to-downward price action around $66,573, despite a generally positive long-term outlook for Bitcoin adoption, suggests a potential cooling of speculative interest or a consolidation phase after recent rallies. A sustained drop in active addresses or a significant increase in whale selling could exacerbate downward pressure, while a surge in new addresses or accumulation by large holders would signal underlying strength.
Developments in the broader crypto space, such as ETF flows and institutional adoption, also play a crucial role. News regarding significant inflows into Bitcoin ETFs would typically act as a bullish catalyst, indicating renewed institutional confidence. Conversely, outflows or negative sentiment surrounding these products could weigh on prices. The recent news about 'Strategy' halting its Bitcoin buys after 13 weeks, as reported on March 30th, is a noteworthy development. While it represents a single entity's decision, it could be indicative of a broader pause in institutional accumulation, especially if more such reports emerge. This news, coupled with the current technical picture, adds another layer of caution to the market.
The Shadow of Powell: What to Expect
Jerome Powell's upcoming speech is the most significant near-term catalyst for Bitcoin and the broader market. Investors will be scrutinizing his remarks for any indication of the Federal Reserve's stance on inflation and future monetary policy. If Powell signals a more hawkish tone, emphasizing the need for sustained tight monetary policy to combat stubborn inflation, it could trigger a sell-off in risk assets, pushing Bitcoin towards its lower support levels. This would likely be accompanied by further strength in the DXY and a continued decline in equity markets. The RSI readings across timeframes, particularly the oversold conditions in equities and the neutral-to-bearish leanings in Bitcoin's shorter timeframes, suggest that the market is vulnerable to hawkish rhetoric.
Conversely, if Powell strikes a more dovish tone, perhaps acknowledging progress on inflation or hinting at potential rate cuts later in the year, it could provide a significant boost to risk assets. This would likely lead to a weakening of the DXY, a potential stabilization or recovery in equities, and a much-needed rally for Bitcoin. The oversold Stochastic signals on shorter Bitcoin timeframes might then find confirmation, leading to a price surge towards the resistance levels around $67,000 and beyond. The market's reaction will depend heavily on the nuance of Powell's language – any ambiguity could lead to increased volatility as traders attempt to price in different scenarios.
Trade Scenarios: Navigating the Uncertainty
Bearish Scenario: Pressure Mounts Below $66,349
65% ProbabilityConsolidation Scenario: Caught Between Levels
25% ProbabilityBullish Scenario: Powell Sparks a Rally Above $67,111
10% ProbabilityFrequently Asked Questions: BTCUSD Analysis
What happens if BTCUSD breaks below the $66,349 support level?
A break below $66,349.33 on a daily basis would invalidate bullish hopes and could trigger a move towards the next support at $65,671.67. This scenario is currently assigned a 65% probability.
Should I consider buying BTCUSD around the current $66,573 level given the mixed signals?
Caution is advised. While some oversold indicators exist on shorter timeframes, the daily trend and macro headwinds suggest further downside risk. A confirmed daily close above $67,111.33 would be needed for a more confident bullish entry, currently with a low 10% probability.
Is the RSI at 41.49 on the 1-hour chart a sell signal for BTCUSD?
An RSI of 41.49 is in the neutral zone but shows a slight downward inclination, leaning bearish. It's not an oversold buy signal yet, but it indicates a lack of bullish momentum, aligning with the overall cautious outlook.
How will Jerome Powell's speech potentially affect BTCUSD this week?
A hawkish tone from Powell could strengthen the DXY and pressure risk assets like BTCUSD towards support levels. Conversely, a dovish tone might weaken the dollar, boost risk appetite, and potentially trigger a rally towards resistance levels around $67,000.
Track markets in real-time
AI-powered analysis, technical indicators and real-time price data.
Join Our Telegram Channel
Breaking market news, AI analysis and trading signals instantly.
Join Channel