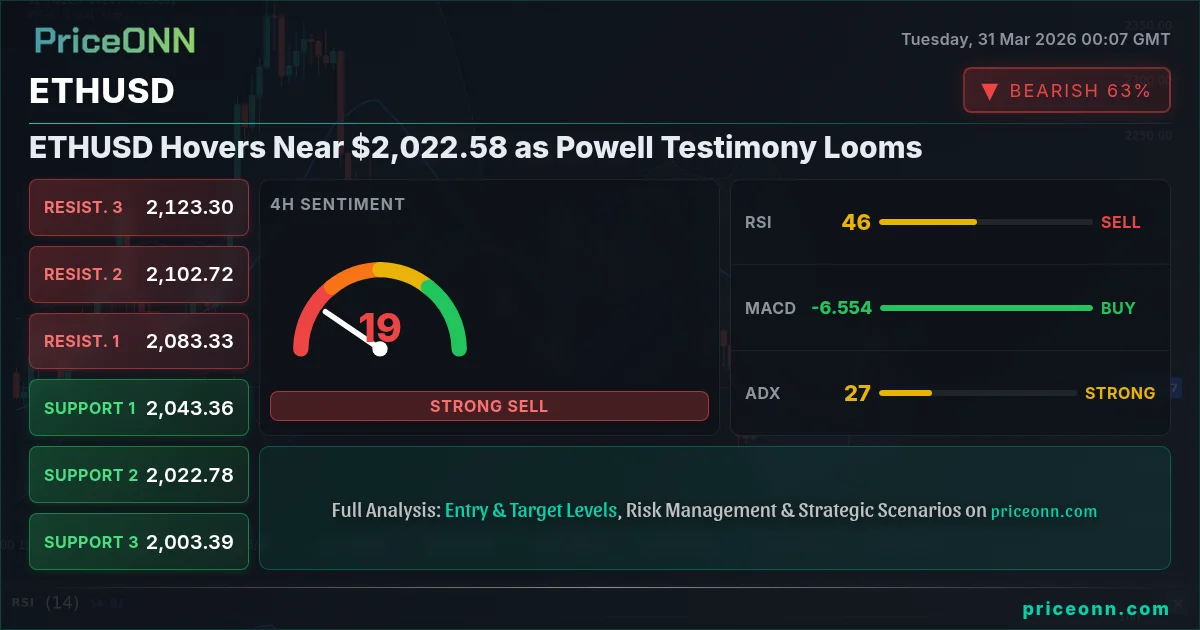
ETHUSD Hovers Near $2,022.58 as Powell Testimony Looms
ETHUSD trades at $2,022.58, with RSI at 44.24 on the 1H chart. Traders eye Powell's testimony amid mixed signals and potential volatility.
The cryptocurrency market is on edge as Ethereum (ETHUSD) hovers precariously near the $2,022.58 mark, awaiting crucial signals from Federal Reserve Chair Jerome Powell's upcoming testimony. This pivotal moment arrives with a complex technical picture and a backdrop of shifting macroeconomic sentiment, making ETHUSD analysis today a critical exercise for traders seeking to navigate potential volatility.
- ETHUSD is currently trading at $2,022.58, with the 1H RSI at 44.24 indicating a neutral but slightly bearish leaning in the short term.
- Critical support for ETHUSD is identified at $2,009.62, while resistance looms around $2,054.56, forming a tight trading range.
- The MACD histogram on the 1H chart shows negative momentum, suggesting downward pressure, yet the Stochastic %K > %D signals a potential short-term bounce.
- Federal Reserve Chair Powell's testimony is the key macro event, with market participants closely watching for any hints on future monetary policy, which could significantly impact ETHUSD's correlation with the DXY.
The current price action for ETHUSD at $2,022.58 presents a fascinating dichotomy. On the 1-hour chart, the Relative Strength Index (RSI) stands at 44.24, hovering in neutral territory but leaning towards bearish momentum, suggesting that the recent upward push might be losing steam. This indicator, while not yet screaming 'oversold,' implies that the bulls are not firmly in control. Compounding this, the MACD histogram on the same timeframe is showing negative momentum, with the MACD line below its signal line. This technical setup paints a cautious picture for short-term ETHUSD traders, hinting that further downside could be on the table if key support levels fail.
Navigating the Short-Term Technicals
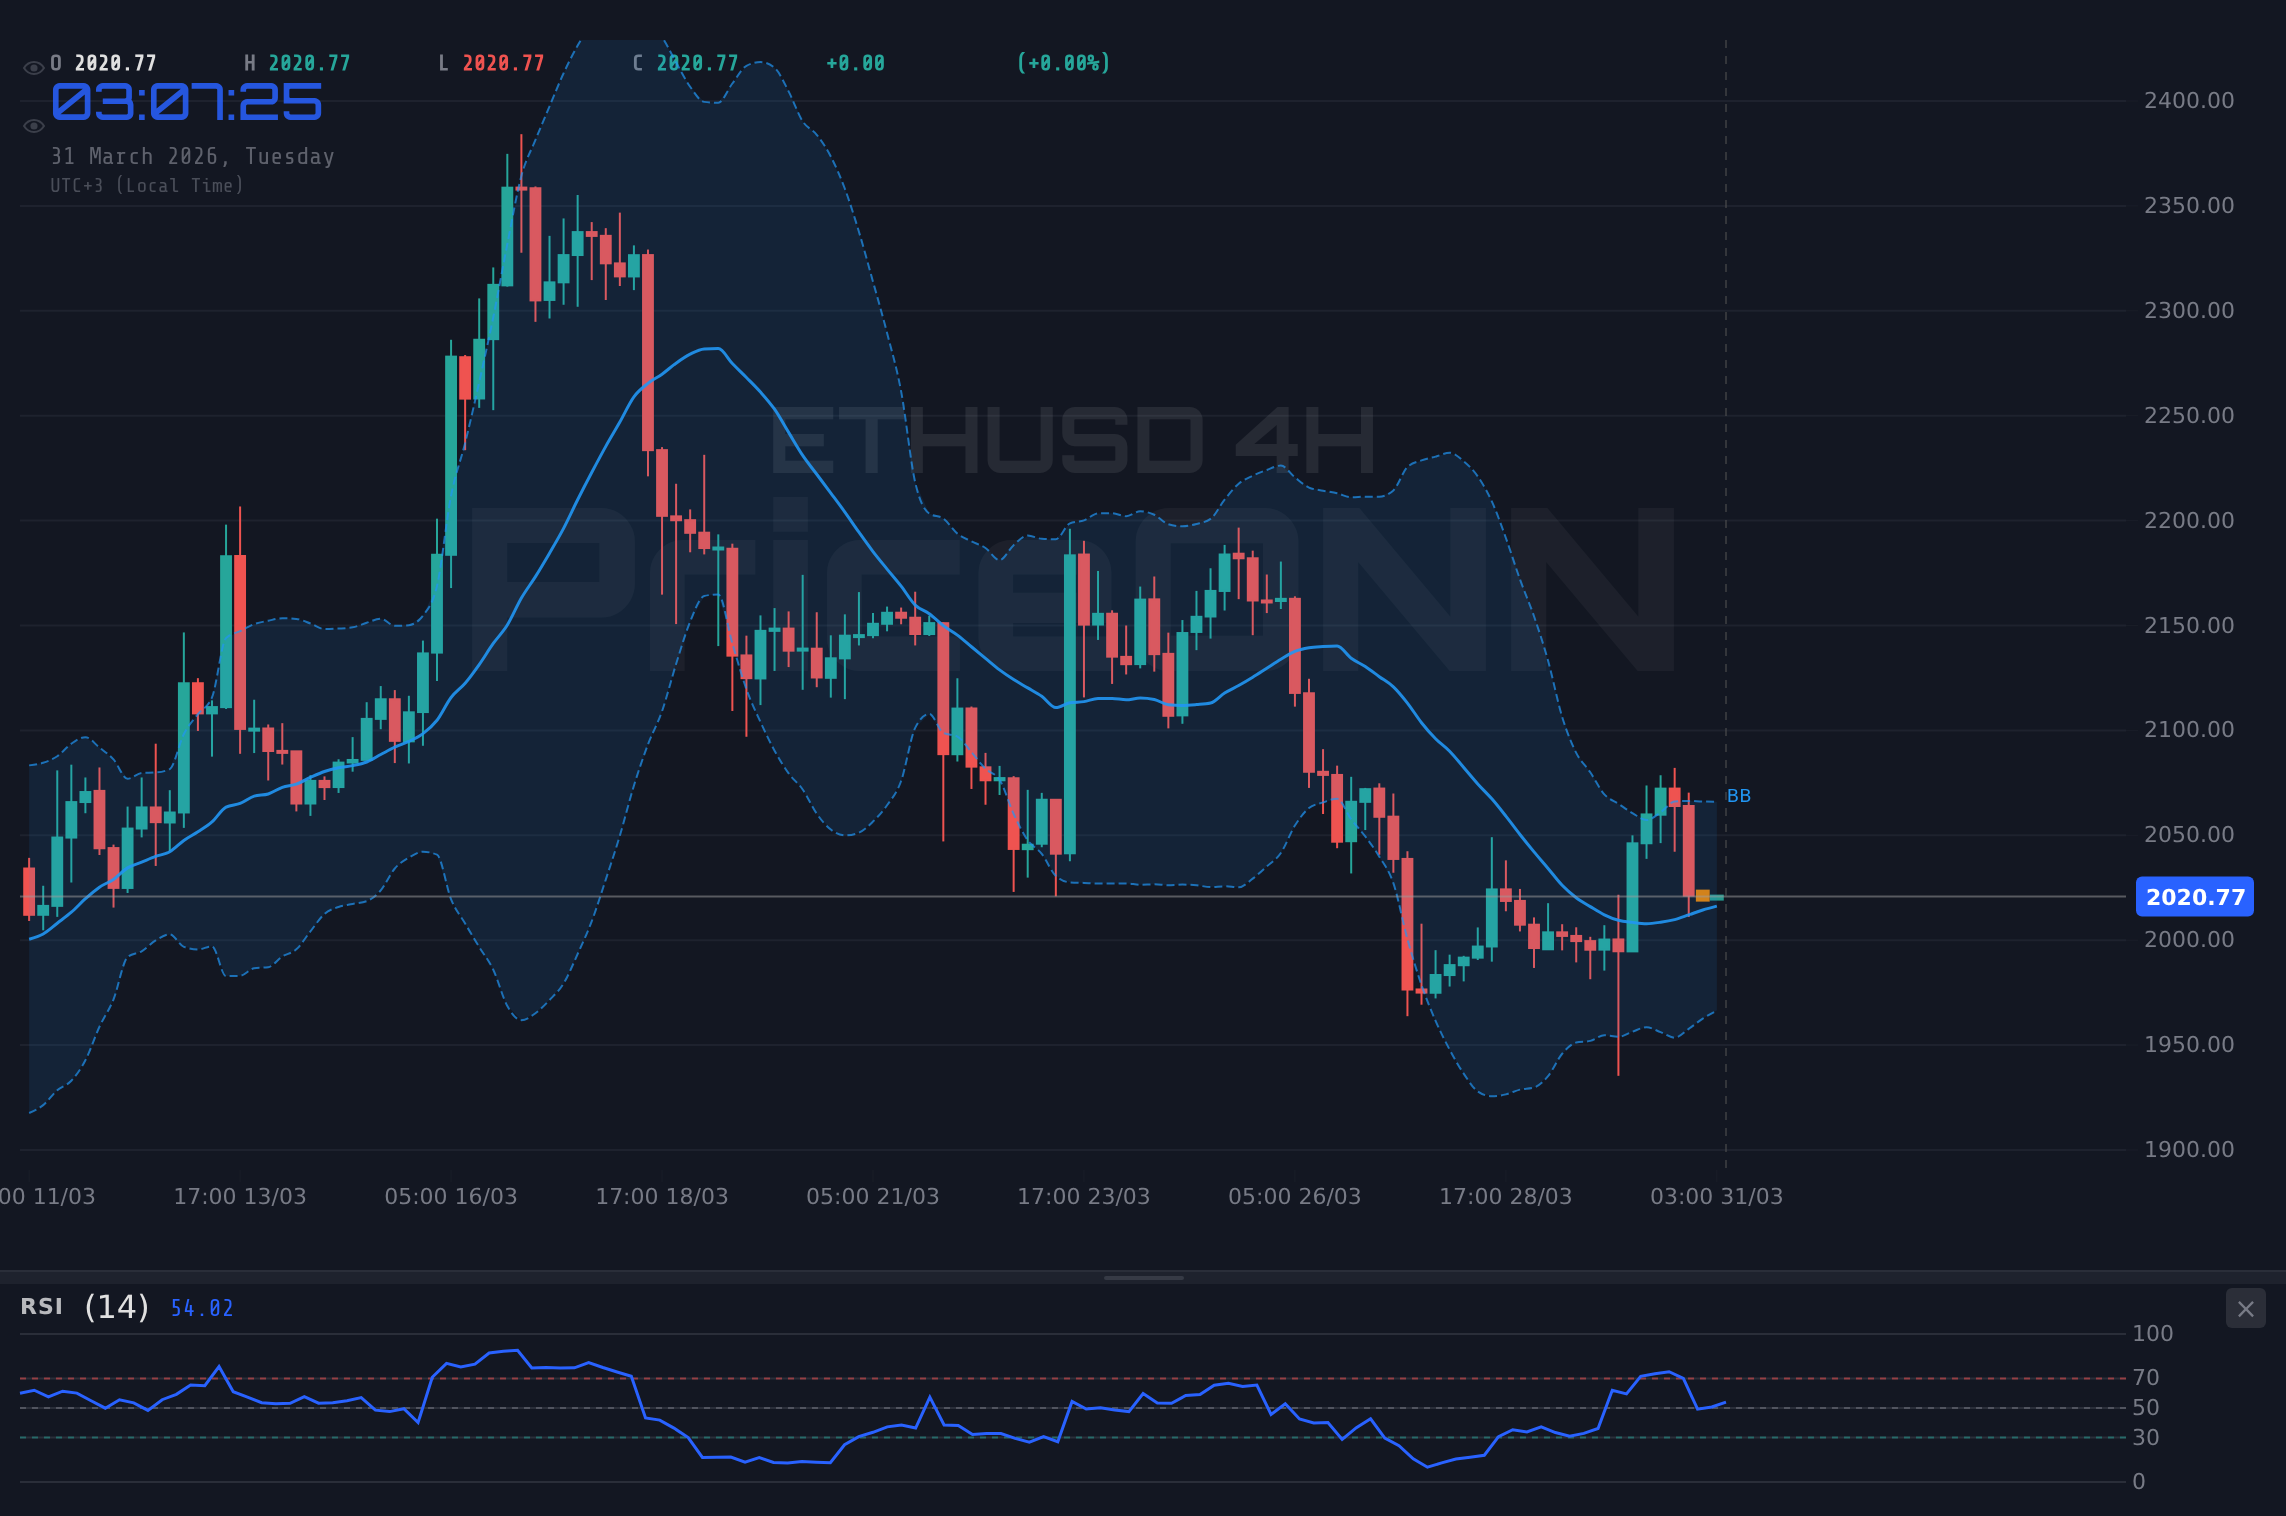
Digging deeper into the 1-hour timeframe reveals a nuanced battleground. While the MACD and RSI suggest potential headwinds, the Stochastic Oscillator offers a glimmer of short-term optimism. With its %K line at 26.36 and %D line at 20.86, the Stochastic is showing a bullish crossover (%K > %D), potentially indicating a brief upward move or a relief rally from current levels. However, this signal often plays out in choppy markets, especially when the ADX reading is as low as 16.47. This weak trend strength suggests that any move might lack conviction and could be prone to reversal. The Bollinger Bands on the 1H chart are also trading below the middle band, reinforcing the bearish short-term sentiment. This interplay of indicators underscores the indecision in the market, making $2,022.58 a critical pivot point.
The 4-Hour Perspective: A Different Story?
Shifting to the 4-hour chart, the narrative for ETHUSD begins to subtly change. Here, the RSI sits at 46.07, still in neutral territory but showing less immediate bearish pressure than its 1-hour counterpart. More significantly, the MACD is exhibiting positive momentum, with the MACD line positioned above its signal line. This divergence from the 1-hour view is noteworthy. Furthermore, the Stochastic Oscillator on the 4-hour chart is robustly bullish, with %K at 80.86 and %D at 73.97, indicating strong upward momentum and potentially entering overbought territory. The Bollinger Bands on this timeframe are trading above the middle band, aligning with a more bullish inclination. This suggests that while the immediate 1-hour outlook might be cautious, the medium-term trend on the 4-hour chart is showing signs of underlying strength, creating a potential conflict in signals that traders must decipher.
Daily Timeframe: The Long-Term Picture
The daily chart for ETHUSD paints a picture of consolidation rather than clear direction, with the trend strength at a neutral 50%. The RSI is at 45.24, comfortably in neutral ground and showing no immediate signs of overbought or oversold conditions. This suggests that the long-term trend is not yet definitively established, and the cryptocurrency is in a phase of price discovery. The MACD, however, is showing negative momentum, with the MACD line below its signal line, echoing the caution seen on the 1-hour chart. Yet, the Stochastic Oscillator is in a neutral state, with %K at 22.6 and %D at 22.6, offering no clear directional bias. The Bollinger Bands are hugging the middle band, further emphasizing the range-bound nature of ETHUSD on the daily timeframe. This lack of a strong daily trend means that short-term fluctuations could dominate price action until a significant catalyst emerges.
The Shadow of Powell and Macroeconomic Currents
The immediate catalyst that could break this technical deadlock is the testimony from Federal Reserve Chair Jerome Powell. In an environment where the US Dollar Index (DXY) is showing significant strength, currently at 100.4 and exhibiting a powerful uptrend across multiple timeframes, any hawkish remarks from Powell could further boost the dollar. A stronger dollar typically exerts downward pressure on risk assets like cryptocurrencies, including ETHUSD. The DXY's RSI at 80.29 on the 1-hour chart already signals extreme overbought conditions, suggesting a potential pullback, but a hawkish Fed could override this. Conversely, any dovish hints could lead to a dollar pullback and provide a much-needed tailwind for ETHUSD. Traders are keenly watching Fed Funds Futures for any shifts in rate cut expectations; currently, market pricing reflects a delicate balance, but Powell's words carry immense weight to tip the scales.
Correlations: DXY, Equities, and the Crypto Nexus
The correlation between ETHUSD and broader market indices, particularly the DXY and equity benchmarks like the S&P 500 (SP500), is paramount. The S&P 500 itself is showing a bearish trend on its 1D chart with RSI at 25.81, indicating significant selling pressure. A sustained decline in equities often spills over into the crypto market, as risk appetite wanes. If Powell's testimony fuels further risk-off sentiment, we could see ETHUSD struggle to hold its ground, especially with the DXY showing strong upward momentum. The current price of $2,022.58 for ETHUSD is thus caught between the potential for a dollar rally and the possibility of a broader market sell-off. The interplay of these factors creates a complex trading environment where risk management is key.
On-Chain Metrics: A Deeper Dive into ETHUSD Health
Beyond price action, on-chain metrics offer a more granular view of Ethereum's ecosystem health. While specific real-time on-chain data isn't provided, general trends in active addresses, transaction volumes, and whale movements are crucial. A sustained increase in active addresses and transaction counts, even with sideways price action, can signal growing network utility and potential accumulation. Conversely, a sharp drop in these metrics alongside price declines could indicate waning interest. Whale movements, defined as large holders moving significant amounts of ETH, can be potent short-term price drivers. If whales begin accumulating ETH around current levels like $2,022.58, it could be a bullish signal, whereas large outflows to exchanges might precede selling pressure. The health of the DeFi and NFT ecosystems, measured by Total Value Locked (TVL) and trading volumes respectively, also directly impacts ETH demand and, consequently, ETHUSD's price.
Regulatory Landscape and Institutional Adoption
The regulatory environment remains a constant factor influencing cryptocurrency markets. Any news regarding potential ETF approvals, new regulations in major economies, or enforcement actions can cause significant price swings. For ETHUSD, clarity on its status as a security versus a commodity is always a background concern. Recent news about Bitcoin potentially pausing buys after 13 weeks, as reported, highlights how institutional sentiment can shift rapidly. While this specific news is about BTC, it reflects a broader cautiousness that could impact ETHUSD. Institutional adoption trends, such as increased inflows into crypto ETFs or major companies increasing their digital asset holdings, can provide a strong bullish narrative. However, without clear positive developments on this front, ETHUSD may remain sensitive to macroeconomic headwinds.
Considering the Key Levels: Support at $2,009.62, Resistance at $2,054.56
From a technical standpoint, the levels to watch are clear. On the 1-hour chart, support is pegged at $4,500.77, $4,490.75, and $4,479.33 for XAUUSD, but for ETHUSD, the immediate support is at $2,009.62, followed by $1,963.53 and $1,945.66 on the daily chart. Resistance, on the other hand, is forming around $2,039.58 and $2,048.26 on the 1-hour chart, with the daily resistance identified at $2,054.56. A decisive break above $2,054.56 could signal a bullish continuation, potentially targeting higher levels. Conversely, a failure to hold support at $2,009.62 might trigger a cascade towards the lower daily support levels. The current price of $2,022.58 sits squarely within this short-term trading range, making the upcoming Powell testimony crucial for dictating the next directional move.
Trade Scenarios: Balancing Risk and Reward
Given the current technical indecision and macroeconomic uncertainty, several scenarios are plausible for ETHUSD. A bearish scenario might play out if Powell delivers hawkish remarks, strengthening the DXY and causing a sell-off in risk assets. In this case, ETHUSD could break below the $2,009.62 support, potentially targeting $1,963.53. The invalidation for this scenario would be a strong close above the $2,054.56 resistance. Conversely, a bullish scenario could emerge if Powell's comments are perceived as dovish, or if risk sentiment improves. This would likely involve ETHUSD breaking convincingly above the $2,054.56 resistance, with targets extending towards $2,083.33 and potentially higher. A neutral scenario, characterized by range-bound trading around $2,022.58, is also possible if Powell's testimony offers no clear direction, leading to continued consolidation until new fundamental catalysts emerge.
Bearish Outlook: Powell's Hawkish Turn
60% ProbabilityBullish Scenario: Dovish Powell & Risk-On
30% ProbabilityConsolidation: Powell's Ambiguous Stance
10% ProbabilityThe Path Forward: Managing Risk in Uncertainty
As traders position themselves around ETHUSD's current $2,022.58 level, the overarching theme is one of caution and strategic patience. The upcoming testimony from Chair Powell represents a significant inflection point. A hawkish tone could reinforce the dollar's strength and pressure risk assets, potentially pushing ETHUSD towards its lower support levels. Conversely, any dovish signals or reassurances about the economic outlook could spark a rally, especially if supported by improving equity markets and waning DXY strength. The technical indicators present a mixed bag, with short-term bearish signals on the 1H chart countered by more bullish undertones on the 4-hour timeframe and a neutral daily trend. This ambiguity underscores the importance of risk management. Traders should look for clear confirmations – a decisive break above resistance or a solid hold and bounce from support – before committing to large positions. Small position sizes, tight stop-losses, and a clear understanding of invalidation levels are paramount in navigating this uncertain period. The market is cyclical; every downturn plants seeds for the next rally, and disciplined traders will be rewarded.
Frequently Asked Questions: ETHUSD Analysis
What happens if ETHUSD breaks below the $2,009.62 support level amidst Powell's testimony?
If ETHUSD breaks decisively below the $2,009.62 support, particularly on hawkish news from Powell, expect a rapid move towards the next daily support at $1,963.53. This would invalidate any short-term bullish signals and confirm a bearish continuation, especially if the DXY strengthens concurrently.
Should I consider buying ETHUSD near $2,022.58 if Powell's stance is neutral?
A neutral stance from Powell might lead to range-bound trading for ETHUSD around $2,022.58. Buying near this level would be a range-trading strategy, requiring tight stops below $2,009.62 and targeting resistance near $2,054.56. Confirmation from a bullish Stochastic crossover on the 4H chart would add conviction, but this setup carries higher risk.
Is the RSI at 44.24 a sell signal for ETHUSD right now?
An RSI of 44.24 on the 1H chart is in neutral territory, leaning bearish. While not an immediate sell signal on its own, it suggests that upward momentum is not strong. It implies caution is warranted, and traders should wait for confirmation, such as a break below key support or a sustained bearish MACD signal, before considering a short position.
How will Powell's testimony potentially affect ETHUSD's correlation with the DXY?
Hawkish testimony from Powell would likely strengthen the DXY (currently at 100.4), increasing the inverse correlation between the dollar and ETHUSD. This could pressure ETHUSD lower. Conversely, dovish remarks might weaken the DXY, potentially allowing ETHUSD to decouple slightly and move higher, especially if risk sentiment improves.
Track markets in real-time
AI-powered analysis, technical indicators and real-time price data.
Join Our Telegram Channel
Breaking market news, AI analysis and trading signals instantly.
Join Channel