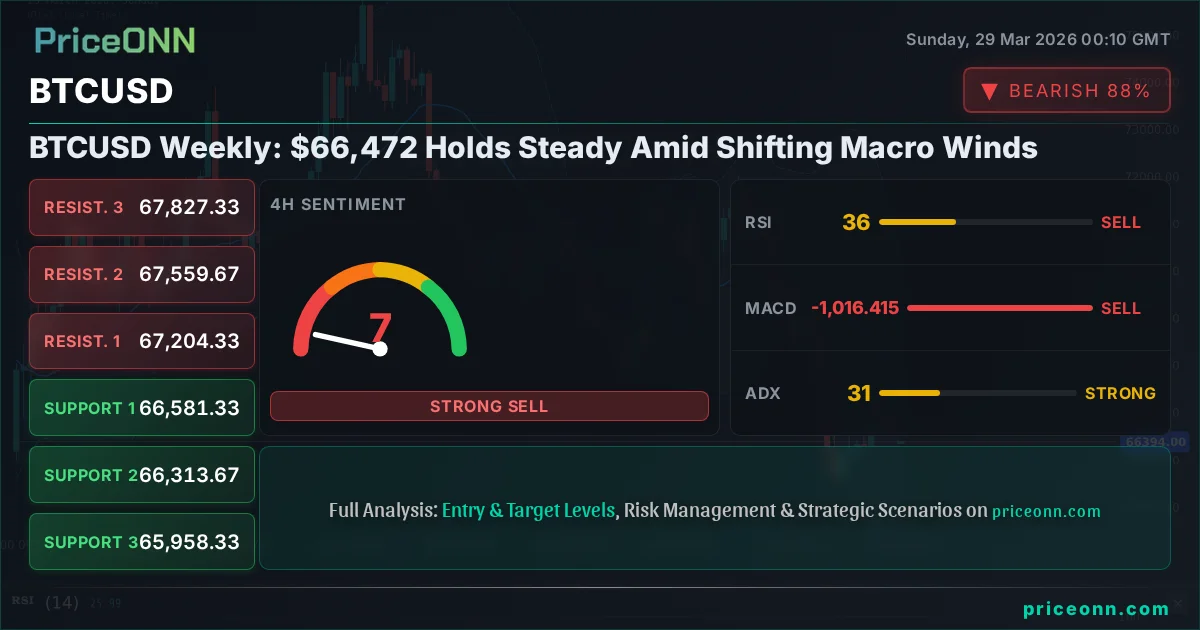
BTCUSD Weekly: $66,472 Holds Steady Amid Shifting Macro Winds
BTCUSD hovers around $66,472 as DXY strength and equity jitters create a mixed signal. Key levels to watch for a decisive move.
The cryptocurrency market, particularly Bitcoin, is navigating a complex macro environment this week, leaving BTCUSD consolidating around the critical $66,472 mark. Last Friday's close saw Bitcoin trading at this pivotal level, a position that reflects a market grappling with conflicting signals from traditional finance. On one hand, the relentless strength of the US Dollar Index (DXY), which has been climbing steadily, exerts downward pressure on risk assets like Bitcoin. The DXY's current reading, around 99.79, signifies a robust dollar that makes dollar-denominated assets more expensive for holders of other currencies, potentially dampening demand. This dollar strength often correlates with a risk-off sentiment, which can also be seen in the broader equity markets. The S&P 500 and Nasdaq experienced significant pullbacks last week, with the S&P 500 closing down 2.03% at 6355.66 and the Nasdaq down 2.3% at 23076.09. This broad market weakness typically leads investors to seek safer havens, moving capital away from more volatile assets such as cryptocurrencies. However, Bitcoin is not entirely succumbing to these pressures, hinting at underlying resilience or specific crypto-market drivers at play. The ability of BTCUSD to hold the $66,472 level, despite these headwinds, suggests that either market participants are anticipating a shift in macro trends, or that crypto-specific factors are providing a floor. Understanding the interplay between these traditional market forces and the unique dynamics of the digital asset space is crucial for deciphering Bitcoin's next move.
- BTCUSD is consolidating around $66,472, reflecting mixed market signals.
- The DXY at 99.79 is strengthening, increasing pressure on risk assets like Bitcoin.
- Major indices like the S&P 500 (6355.66) and Nasdaq (23076.09) saw significant declines, indicating risk aversion.
- Despite macro headwinds, BTCUSD holding $66,472 suggests potential crypto-specific support or resilience.
Navigating the Dollar's Ascent and Equity Sell-off
The Dollar's Grip: DXY's Influence on Risk Assets
The strengthening US Dollar Index (DXY) is a significant narrative influencing global markets, and its current level around 99.79 underscores this trend. Historically, a rising DXY often signals a global preference for dollar-denominated assets, driven by factors such as higher US interest rates, perceived economic stability, or a general 'risk-off' sentiment. When the dollar strengthens, it becomes more expensive for investors holding other currencies to purchase dollar-denominated assets, including Bitcoin, which is priced in USD. This dynamic can lead to reduced demand for Bitcoin, putting downward pressure on its price. The correlation is not always perfect, as Bitcoin has shown increasing signs of decoupling from traditional assets at times, but the dollar's influence remains a critical factor. For traders and investors, monitoring the DXY is as important as watching Bitcoin's price action itself. A sustained move above key DXY resistance levels, such as 100.00, could amplify the pressure on Bitcoin, potentially pushing it towards lower support levels. Conversely, any signs of weakness in the dollar, such as a break below its current short-term support around 99.73, might offer a reprieve for risk assets and could coincide with a recovery in BTCUSD.
Equity Market Tremors: A Risk-Off Environment?
Last week witnessed a notable downturn in major equity indices, adding another layer of complexity to Bitcoin's market assessment. The S&P 500's fall to 6355.66 and the Nasdaq's drop to 23076.09 are significant, indicating a broad-based deleveraging across the stock market. This sell-off can be attributed to a confluence of factors, including persistent inflation concerns, shifting expectations around central bank policies, and growing geopolitical anxieties. When the stock market experiences such sharp declines, it typically signifies a decrease in investor risk appetite. In such an environment, capital tends to flow out of speculative or higher-risk assets and into perceived safe havens like US Treasuries, gold, or even the US dollar itself. Bitcoin, often viewed as a risk-on asset, can be particularly vulnerable during these periods of market stress. The sell-off in equities suggests that speculative capital might be retreating, which could translate into reduced buying pressure for Bitcoin. The fact that BTCUSD managed to hold the $66,472 level despite this equity market turbulence is, therefore, noteworthy. It might imply that either the selling pressure in equities is about to abate, or that there's a growing conviction among some investors in Bitcoin's long-term value proposition, irrespective of short-term stock market fluctuations. The correlation between Bitcoin and the Nasdaq, often observed historically, appears to be tested here, with Bitcoin showing a degree of resilience that deviates from its typical correlation during sharp equity downturns.
Bitcoin's Resilience: Technical Indicators and On-Chain Insights
The 1-Hour Chart: Short-Term Signals and Volatility
Examining the shorter timeframes provides a granular view of the immediate forces acting upon BTCUSD. On the 1-hour chart, the trend is currently neutral, with a power rating of 50%. This suggests a lack of clear direction in the very short term, characterized by choppy price action. The RSI(14) stands at 42.99, indicating that while not oversold, it is in the lower half of its neutral range and shows a bearish inclination. This means that selling momentum is present, but there isn't an overwhelming bearish bias just yet. The MACD is showing positive momentum, with the MACD line above its signal line, which is a short-term bullish signal, though this often gets overshadowed by the broader trend. However, the Stochastic Oscillator, with K=24.55 and D=52.37, presents a bearish signal as %K is below %D, suggesting a potential for further downside in the immediate hours. The ADX at 23.24 indicates a moderately strong downtrend, reinforcing the bearish inclination on this timeframe. The general signal aggregation leans heavily towards 'SELL' (1 Sell, 7 Neutral, 0 Buy), reflecting the immediate bearish pressures. This neutral-to-bearish short-term outlook suggests that while Bitcoin isn't collapsing, the immediate path of least resistance might be downwards, especially if macro conditions worsen. Scalpers and very short-term traders will be watching the immediate support at $66,639 and resistance at $66,835 very closely.
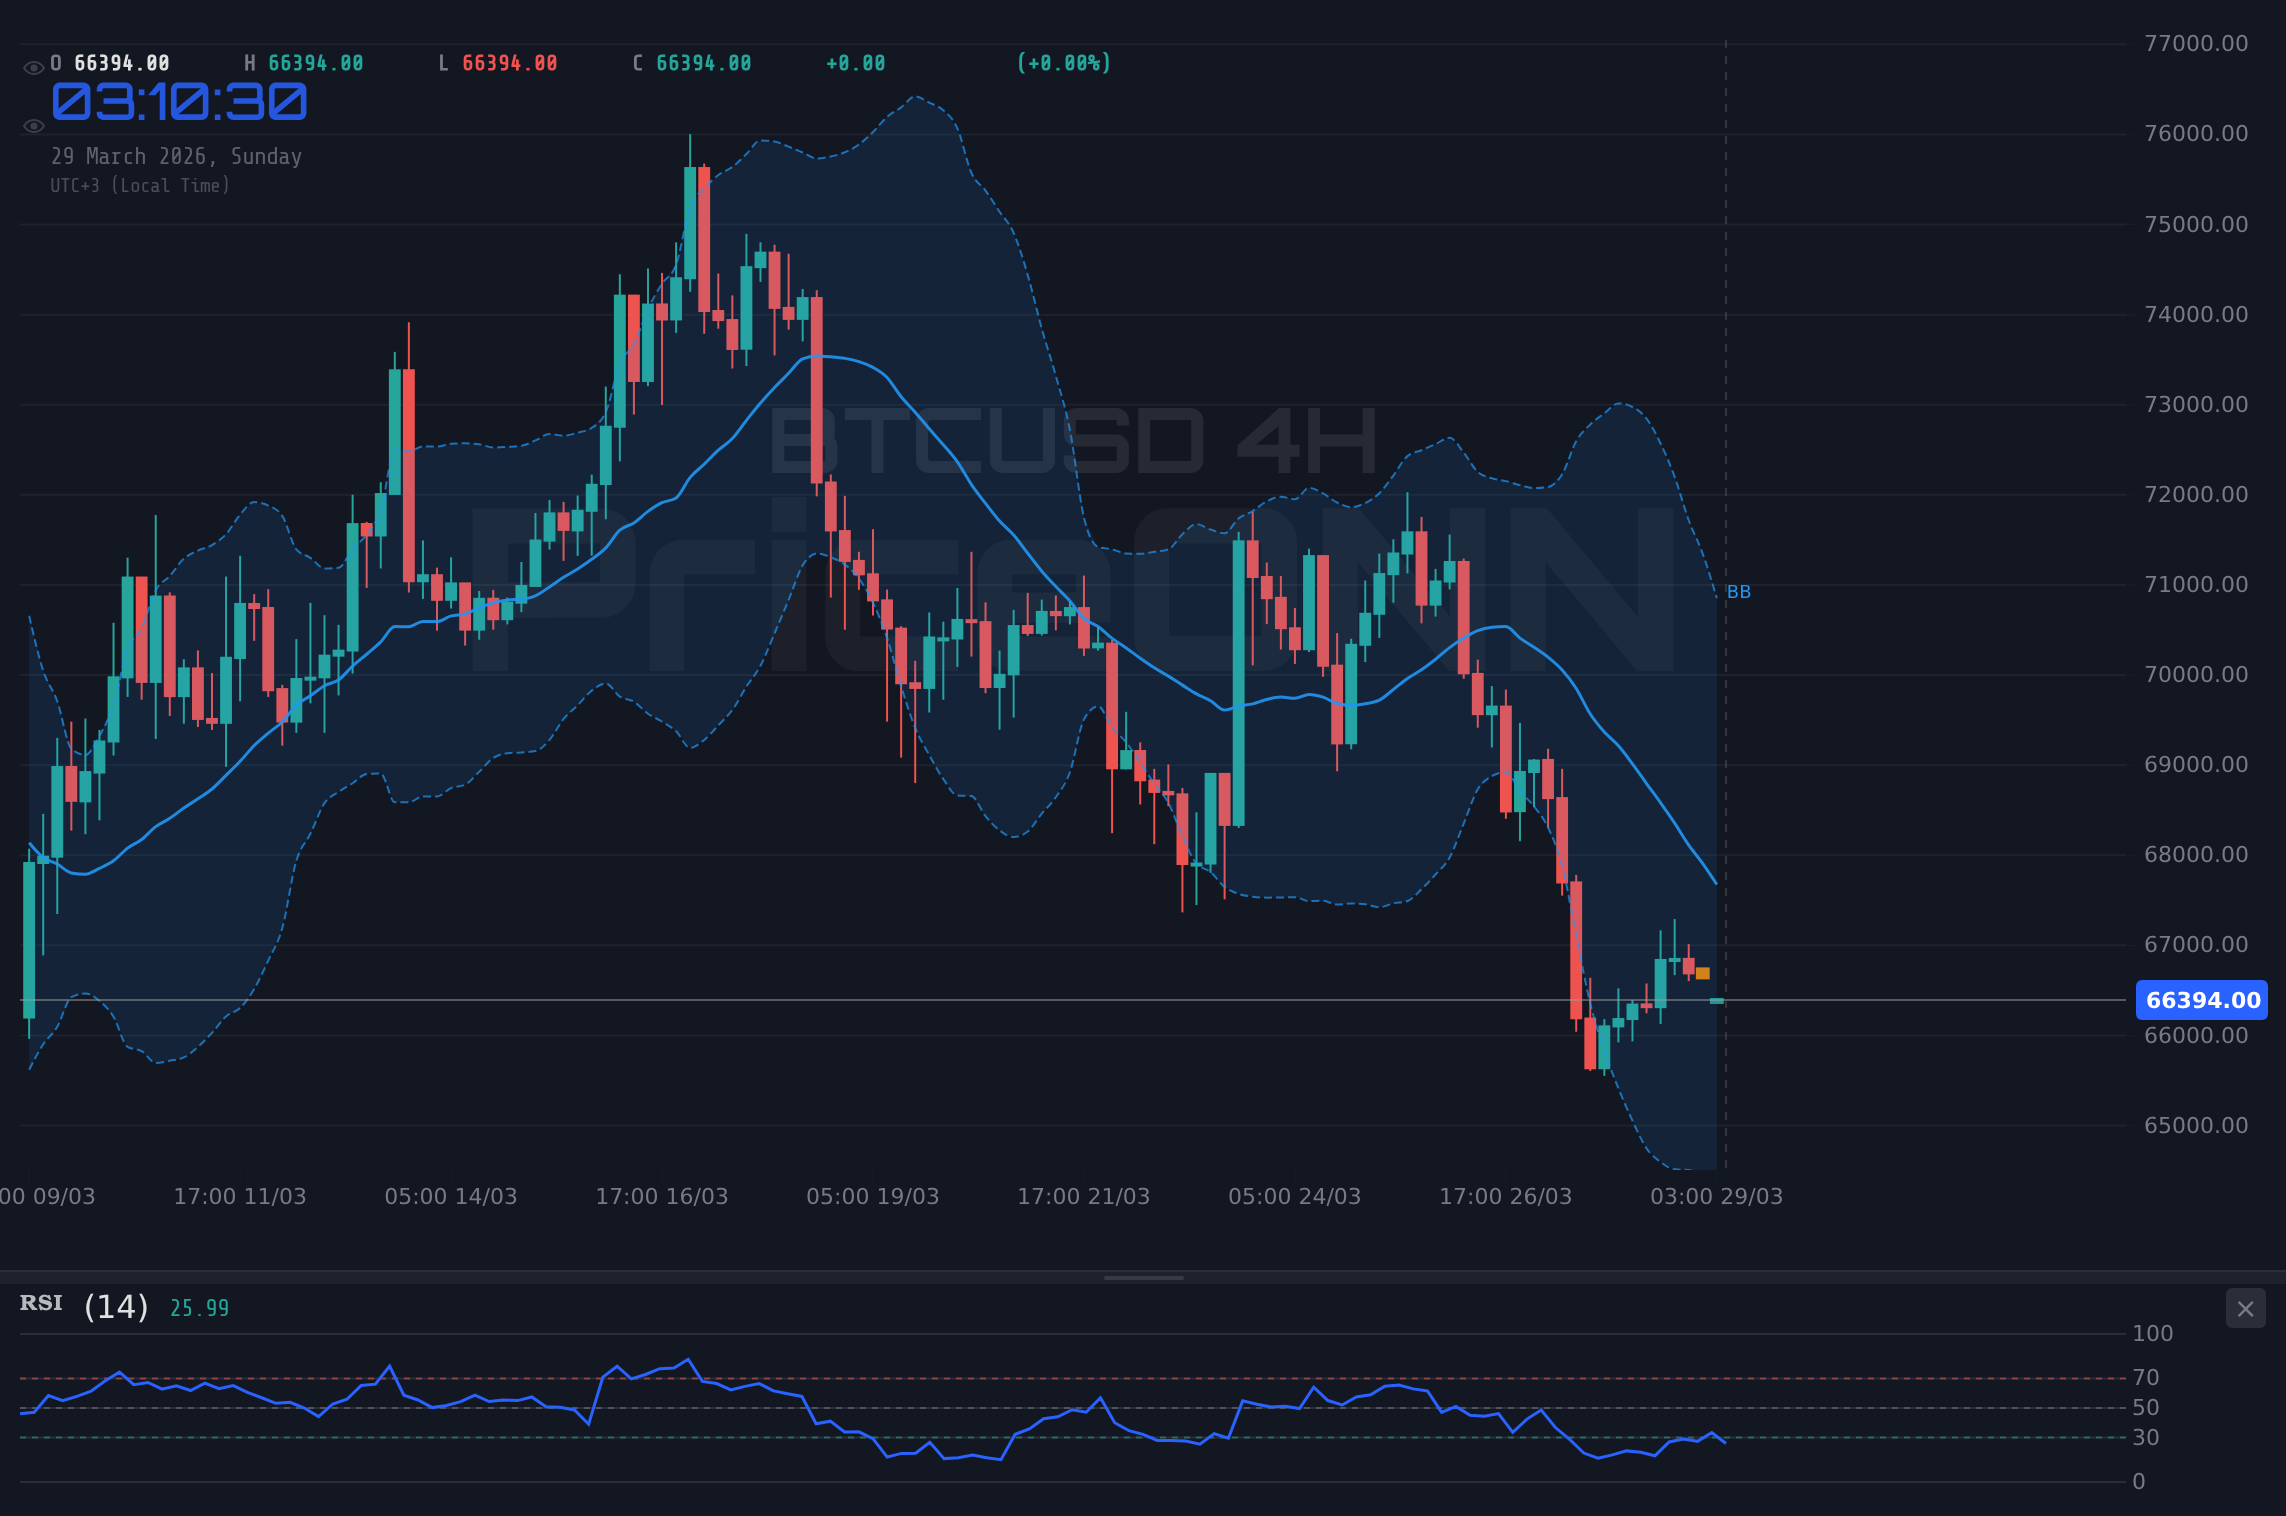
The 4-Hour Chart: A Developing Downtrend
Shifting to the 4-hour timeframe, the technical picture for BTCUSD becomes more decidedly bearish, with a trend strength of 91%. This indicates a more established downward pressure that warrants attention. The RSI(14) is at 36.29, firmly in the neutral territory but trending downwards, suggesting that sellers are gaining a slight upper hand. The MACD is showing negative momentum, with the MACD line below its signal line, which is a classic bearish signal indicating that downward momentum is building. The Stochastic Oscillator, with K=38.25 and D=23.19, presents a bullish divergence signal (%K > %D), which can sometimes precede a reversal or a pause in the downtrend. However, this bullish signal on the Stochastic is currently contradicted by the broader bearish signals from other indicators. The ADX reading of 31.33 confirms a strong downtrend, indicating that the market is moving decisively in one direction. The overall signal aggregation here is also strongly 'SELL' (1 Buy, 7 Sell, 0 Neutral), reinforcing the bearish bias on this intermediate timeframe. For swing traders, the key levels to watch are the support at $66,581.33 and the resistance at $67,204.33. A break below the 4-hour support could signal a deeper decline, while a sustained move above the 4-hour resistance might indicate a short-term correction.
The Daily Chart: Long-Term Bearish Bias Remains
On the daily chart, BTCUSD reveals a predominantly neutral trend with a power rating of 50%, but this masks a significant underlying bearish bias, particularly when considering the strength of the downtrend indicators. The current price of $66,472 sits within a range where longer-term consolidation has occurred, but the daily indicators are painting a cautious picture. The RSI(14) is at 41.26, indicating a bearish trend, as it sits below the 50-level and is trending downwards. This suggests that buyers are not yet in control and that selling pressure is more dominant over the longer term. The MACD is also showing negative momentum, with the MACD line below its signal line, which is a bearish indicator on the daily timeframe, suggesting that the longer-term trend might be shifting downwards. The Stochastic Oscillator (K=14.57, D=26.67) is in oversold territory and shows a bearish signal (%K < %D), indicating potential for further downside or a bounce from current levels, but the overall trend context needs to be considered. The ADX at 17.3 confirms a weak trend, which can sometimes precede a more significant move in either direction, but coupled with the other bearish indicators, it suggests that the market is indecisive but leaning towards bearishness. The overall signal aggregation is heavily 'SELL' (0 Buy, 8 Sell, 0 Neutral), highlighting the prevailing bearish sentiment on the daily timeframe. This daily outlook is critical for long-term investors, who will be closely watching the daily support at $64,708 and the significant daily resistance at $68,338. A close below $64,708 on the daily chart could be a strong bearish signal, while a sustained break and hold above $68,338 would be needed to invalidate the bearish outlook and signal a potential trend reversal.
On-Chain Metrics and Crypto Ecosystem Developments
Active Addresses and Transaction Volume: A Sign of Engagement?
While technical indicators provide a snapshot of price action, on-chain metrics offer a deeper look into the underlying health and activity of the Bitcoin network. A key metric to watch is the number of active addresses. A rising number of active addresses typically indicates increasing network usage and user engagement, which is generally a bullish sign for Bitcoin's long-term prospects. Conversely, a declining number of active addresses, especially during periods of price consolidation or decline, can suggest waning interest or reduced participation, which could be a precursor to further price weakness. Transaction volume, the total amount of Bitcoin transacted over a given period, also provides valuable insight. High transaction volumes, particularly when accompanied by rising active addresses, can signal strong conviction among market participants, whether buying or selling. However, low transaction volumes during price movements might indicate a lack of conviction or a market dominated by fewer, larger players (whales). Currently, without real-time on-chain data feeds integrated into this analysis, it's challenging to provide specific numbers. However, market participants should be closely monitoring these metrics. If active addresses and transaction volumes remain robust despite the current price consolidation around $66,472, it would suggest underlying network health that could support a future rally. If these metrics begin to falter, it would reinforce the bearish technical signals and suggest that the current price stability might be fragile.
Whale Movements and Exchange Flows: Tracking the Big Players
The behavior of 'whale' addresses - those holding large amounts of Bitcoin - and the flow of BTC between exchanges and private wallets are critical indicators of sentiment among major players. Significant inflows of Bitcoin onto exchanges can be interpreted as a sign that large holders are preparing to sell, potentially increasing selling pressure. Conversely, large outflows from exchanges to private wallets often suggest that whales are accumulating Bitcoin for long-term holding, which is typically a bullish signal. These movements are not always straightforward; sometimes, large movements are simply transfers between different cold storage wallets or to new exchange accounts for trading. Therefore, it's essential to analyze these flows in conjunction with price action and other on-chain metrics. For instance, if whales are seen accumulating Bitcoin (outflows from exchanges) while the price is consolidating around $66,472, it could be a strong signal of underlying bullish conviction. However, if large inflows onto exchanges coincide with rising DXY and falling equity markets, it would strongly suggest that whales are de-risking, potentially exacerbating any downward price movement. Keeping an eye on whale accumulation or distribution patterns is vital for understanding potential shifts in market power and anticipating significant price swings.
DeFi and NFT Ecosystem Health: Broader Crypto Market Sentiment
While Bitcoin often leads the crypto market, the health of the broader decentralized finance (DeFi) and non-fungible token (NFT) ecosystems can offer valuable context for Bitcoin's performance. The total value locked (TVL) in DeFi protocols, the volume of NFT trading, and the total number of unique DeFi users are key indicators of overall crypto market engagement and innovation. A growing TVL, increasing NFT sales volumes, and a rising user base generally reflect a healthy and expanding crypto economy, which can provide a positive backdrop for Bitcoin. Conversely, declining TVL, stagnant or falling NFT markets, and a decrease in DeFi users might signal a cooling of interest in the crypto space, which could indirectly impact Bitcoin's price by reducing overall speculative demand. Currently, the broader crypto ecosystem is experiencing a period of consolidation, mirroring Bitcoin's own price action. If the DeFi and NFT sectors show signs of renewed growth, with increasing TVL and trading volumes, it would suggest that investor interest is broadening beyond just Bitcoin, potentially fueling a wider crypto market rally that could lift BTCUSD. Conversely, if these sectors continue to stagnate or decline, it would indicate that the current weakness in Bitcoin might be part of a larger trend of reduced interest in digital assets.
Correlation Analysis: DXY, Equities, and Oil's Influence
The Interplay Between DXY, Bonds, and Equities
Understanding how BTCUSD moves in relation to traditional financial instruments is crucial for a comprehensive market view. The DXY, currently around 99.79 and showing upward momentum, often exhibits an inverse correlation with risk assets like Bitcoin and equities. When the dollar strengthens, it typically implies tighter financial conditions or a flight to safety, both of which tend to pressure Bitcoin. Last week's equity market performance, with the S&P 500 at 6355.66 and Nasdaq at 23076.09, reflects this risk-off sentiment. A falling stock market often coincides with falling Bitcoin prices, as investors liquidate riskier positions across the board. However, this correlation can break down, especially if Bitcoin is driven by its own unique catalysts, such as significant institutional inflows into Bitcoin ETFs or major on-chain developments. Bond yields also play a critical role. Rising yields can make holding non-yielding assets like Bitcoin less attractive compared to income-generating assets like bonds. Conversely, falling yields might signal economic concerns that could also dampen risk appetite, creating a complex relationship. For Bitcoin traders, observing these correlations provides context: if the DXY and bond yields are rising while equities are falling, it paints a bearish picture for BTCUSD, suggesting that any support around $66,472 might be tested. A break below key support levels in equities or a sustained rise in yields could signal further downside for Bitcoin.
Oil Prices: An Inflationary Signal and Geopolitical Barometer
The surge in oil prices, with Brent crude futures and WTI both showing significant daily gains (Brent at $110.33, WTI at $100.94), is a critical macroeconomic signal that cannot be ignored. Rising oil prices directly contribute to inflation, as energy is a fundamental input cost for almost all goods and services. This increased inflationary pressure can have a dual effect on Bitcoin. On one hand, Bitcoin is often touted as an inflation hedge, similar to gold. In theory, rising inflation should increase demand for Bitcoin as a store of value. However, the current market dynamics suggest this narrative is not playing out straightforwardly. Persistent inflation often leads central banks, like the Federal Reserve, to maintain or increase interest rates to cool the economy. Higher interest rates increase the cost of capital and can dampen speculative investment, which is negative for Bitcoin. Furthermore, the geopolitical tensions driving oil prices higher - particularly in the Middle East - also contribute to overall market uncertainty and risk aversion, which, as discussed, tends to pressure Bitcoin. Therefore, while the rising oil price might seem bullish for an inflation hedge asset, the underlying inflationary and geopolitical drivers are creating a net bearish impact by potentially leading to tighter monetary policy and increased market fear. The correlation here is nuanced: rising oil prices due to supply shocks (geopolitics) are generally negative for risk assets like BTCUSD, even if inflation is theoretically a bullish factor for it.
Trade Scenarios and Strategy for Different Timeframes
Bearish Scenario: Testing Lower Supports
Bearish Scenario: Downside Breakout
60% ProbabilityBullish Scenario: Holding the Line
Bullish Scenario: Consolidation Continues
25% ProbabilityNeutral Scenario: Range-Bound Drift
Neutral Scenario: Sideways Action
15% ProbabilityStrategic Outlook for Different Trader Types
Scalpers and Day Traders: Watching the 1-Hour Momentum
For scalpers and day traders operating on the shortest timeframes, the current neutral-to-bearish sentiment on the 1-hour chart around $66,472 presents a challenging but potentially opportunistic environment. The key is to watch for immediate confirmations of direction. A break below the 1-hour support at $66,639, especially with increasing volume and a bearish MACD cross on the 1-hour chart, could offer a short-term selling opportunity targeting the next support at $66,519. Conversely, if Bitcoin manages to reclaim the 1-hour resistance at $66,835 with conviction, scalpers might look for a quick bounce opportunity targeting $66,911. The Stochastic Oscillator's current bearish signal (%K < %D) on the 1-hour chart suggests that immediate downside might be favored, but the positive MACD momentum cannot be ignored. Scalpers must be extremely agile, using tight stop-losses and aiming for small, frequent gains, as the lack of a clear trend on this timeframe means rapid reversals are possible. The ADX at 23.24 indicates a trend is developing, but its moderate strength means that scalpers should wait for clear price action confirmation rather than anticipating moves.
Swing Traders: Monitoring the 4-Hour Trend
Swing traders, who typically hold positions for days to weeks, will find the developing bearish trend on the 4-hour chart more relevant. The 4-hour trend strength of 91% indicates that the current direction is likely to persist in the short to medium term. The key level to watch is the 4-hour support at $65,958.33. A decisive break and hold below this level, confirmed by a daily close below it, would likely signal a continuation of the downtrend, potentially targeting the next significant support at $64,708.00. The bearish MACD and RSI readings on this timeframe support this outlook. However, swing traders should also be aware of the bullish Stochastic divergence, which could signal a potential short-term bounce or correction. If BTCUSD finds support around $65,958.33 and shows signs of a reversal (e.g., a bullish MACD cross or a bounce off the daily support), swing traders might consider a counter-trend long position, but only with strict risk management and targets set at the nearest 4-hour resistance at $67,204.33. The ADX at 31.33 confirms a strong trend is in place, meaning that attempting to trade against it carries higher risk.
Long-Term Investors: Assessing Daily Structure and Macro Factors
For long-term investors, the daily chart and the broader macroeconomic picture are paramount. The neutral trend with a bearish bias on the daily chart, coupled with the strengthening dollar (DXY at 99.79) and falling equity markets (S&P 500 at 6355.66, Nasdaq at 23076.09), suggests a period of caution is warranted. The daily support at $64,708 and resistance at $68,338 are the critical zones. A long-term investor might view a sustained break below $64,708 as a signal to reduce exposure or wait for a more significant re-evaluation of Bitcoin's fundamental value proposition. Conversely, a strong daily close above $68,338, especially if accompanied by positive shifts in macro indicators (e.g., easing inflation, Fed policy pivot, or a recovery in risk appetite), could be interpreted as a long-term accumulation opportunity. The current price action around $66,472 suggests that the market is waiting for clearer direction. Investors should also consider the broader crypto ecosystem: if DeFi TVL and NFT volumes show signs of recovery, it could indicate renewed interest in digital assets, providing a bullish underpinning for Bitcoin's long-term trajectory. The key for long-term investors is patience and a focus on fundamental value, rather than short-term price fluctuations.
Frequently Asked Questions: BTCUSD Analysis
What happens if BTCUSD breaks below the $66,472 support level this week?
A break below $66,472, especially a daily close below it, would likely trigger further selling pressure, targeting the 4-hour support at $65,958.33. This would invalidate the current consolidation and confirm the bearish bias seen on the 4-hour and daily charts, potentially leading to a move towards the $64,708 daily support level.
Should I buy BTCUSD at current levels of $66,472 given the mixed technical signals?
Buying at $66,472 requires caution due to the bearish signals on lower timeframes and macro headwinds like DXY strength. A more prudent approach would be to wait for confirmation, such as holding the $65,958.33 support with signs of accumulation, or a clear break above the $67,204.33 resistance, indicating a shift in momentum.
Is the RSI at 41.26 on the daily chart a sell signal for BTCUSD right now?
An RSI of 41.26 on the daily chart indicates a bearish trend, sitting below the 50 level. While not an immediate oversold sell signal, it confirms that sellers are more dominant than buyers over the longer term. It suggests that upside potential might be limited until the RSI moves decisively back above 50, signaling a shift in momentum.
How will the rising oil prices and DXY strength affect BTCUSD next week?
Rising oil prices contribute to inflation fears, potentially leading to tighter monetary policy, while DXY strength directly pressures risk assets. Both factors create a net bearish outlook for BTCUSD in the short term, suggesting that current support levels like $66,472 may be tested further, unless specific crypto-driven catalysts emerge.
| Indicator | Value | Signal | Interpretation |
|---|---|---|---|
| RSI (14) | 41.26 | Bearish | Below 50, indicating bearish trend on Daily. |
| MACD | - | Bearish | Negative momentum on Daily chart. |
| Stochastic | 14.57 / 26.67 | Bearish | Oversold on Daily, but %K < %D confirms downside. |
| ADX | 17.3 | Neutral | Weak trend, lacks conviction for strong moves. |
| Bollinger Bands | Price below Middle Band | Bearish | Suggests bearish pressure on Daily timeframe. |
Track markets in real-time
AI-powered analysis, technical indicators and real-time price data.
Join Our Telegram Channel
Breaking market news, AI analysis and trading signals instantly.
Join Channel