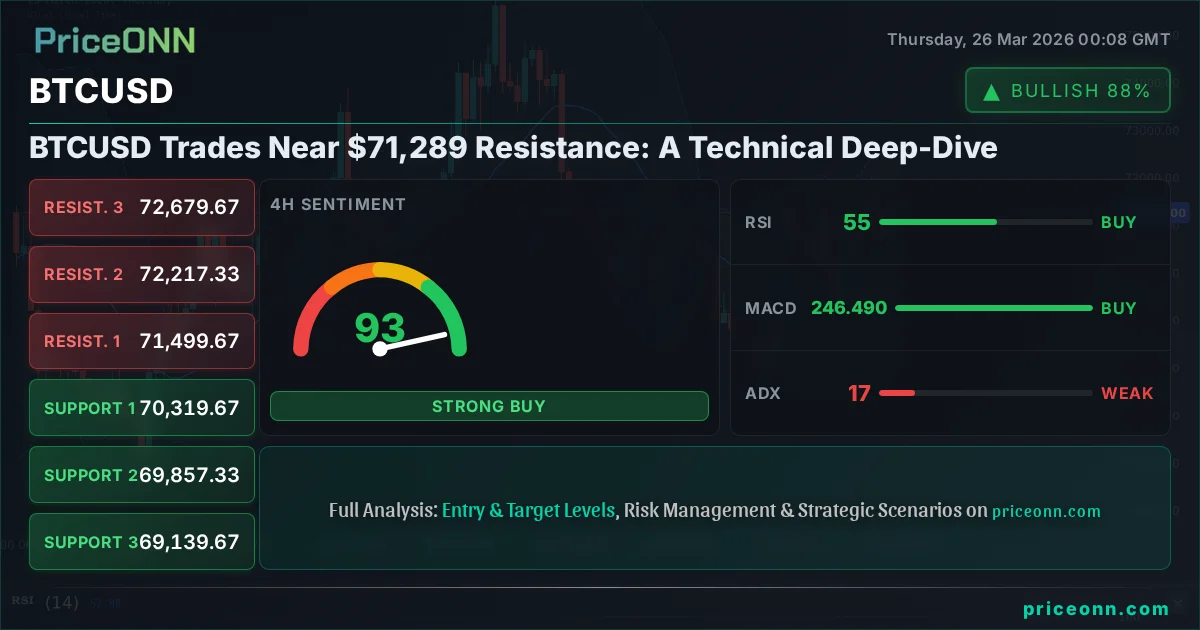
BTCUSD Trades Near $71,289 Resistance: A Technical Deep-Dive
BTCUSD hovers near $71,289 resistance. Analysis of RSI, MACD, and key levels suggests a critical juncture for Bitcoin's next move. Watch for potential breakouts or consolidations.
Bitcoin, or BTCUSD as it's known in the trading world, is currently consolidating its gains, hovering precariously near the $71,289 mark. This price point isn't just another number on the chart; it represents a significant resistance level that has been tested and re-tested, creating a crucial battleground for bulls and bears alike. The question on every trader's mind is whether this current price action is a prelude to a decisive breakout above $71,289, or if it's simply the calm before a pullback towards more supportive ground. Understanding the interplay between current technical indicators, broader market sentiment, and the ever-evolving crypto landscape is paramount for navigating this pivotal moment. This analysis delves into the intricate details, aiming to provide clarity on the path forward for BTCUSD.
- Bitcoin's RSI at 55.72 on the 1H chart signals neutral momentum, with a slight upward lean, indicating neither extreme overbought nor oversold conditions.
- The critical resistance level to watch for BTCUSD is $72,246.33, a breach of which could trigger further upside.
- The MACD histogram on the 1H chart shows negative momentum, suggesting that while the price is holding, underlying selling pressure is present.
- Correlation analysis shows BTCUSD is currently exhibiting a neutral trend on the 4H chart, with ADX at 16.58, indicating a lack of strong directional conviction.
- A daily close above $71,515.33, the 1D resistance, would be a significant bullish signal, potentially targeting higher levels.
Navigating the $71,289 Crossroads: What the Charts Are Saying
The Immediate Picture: A Tightening Range
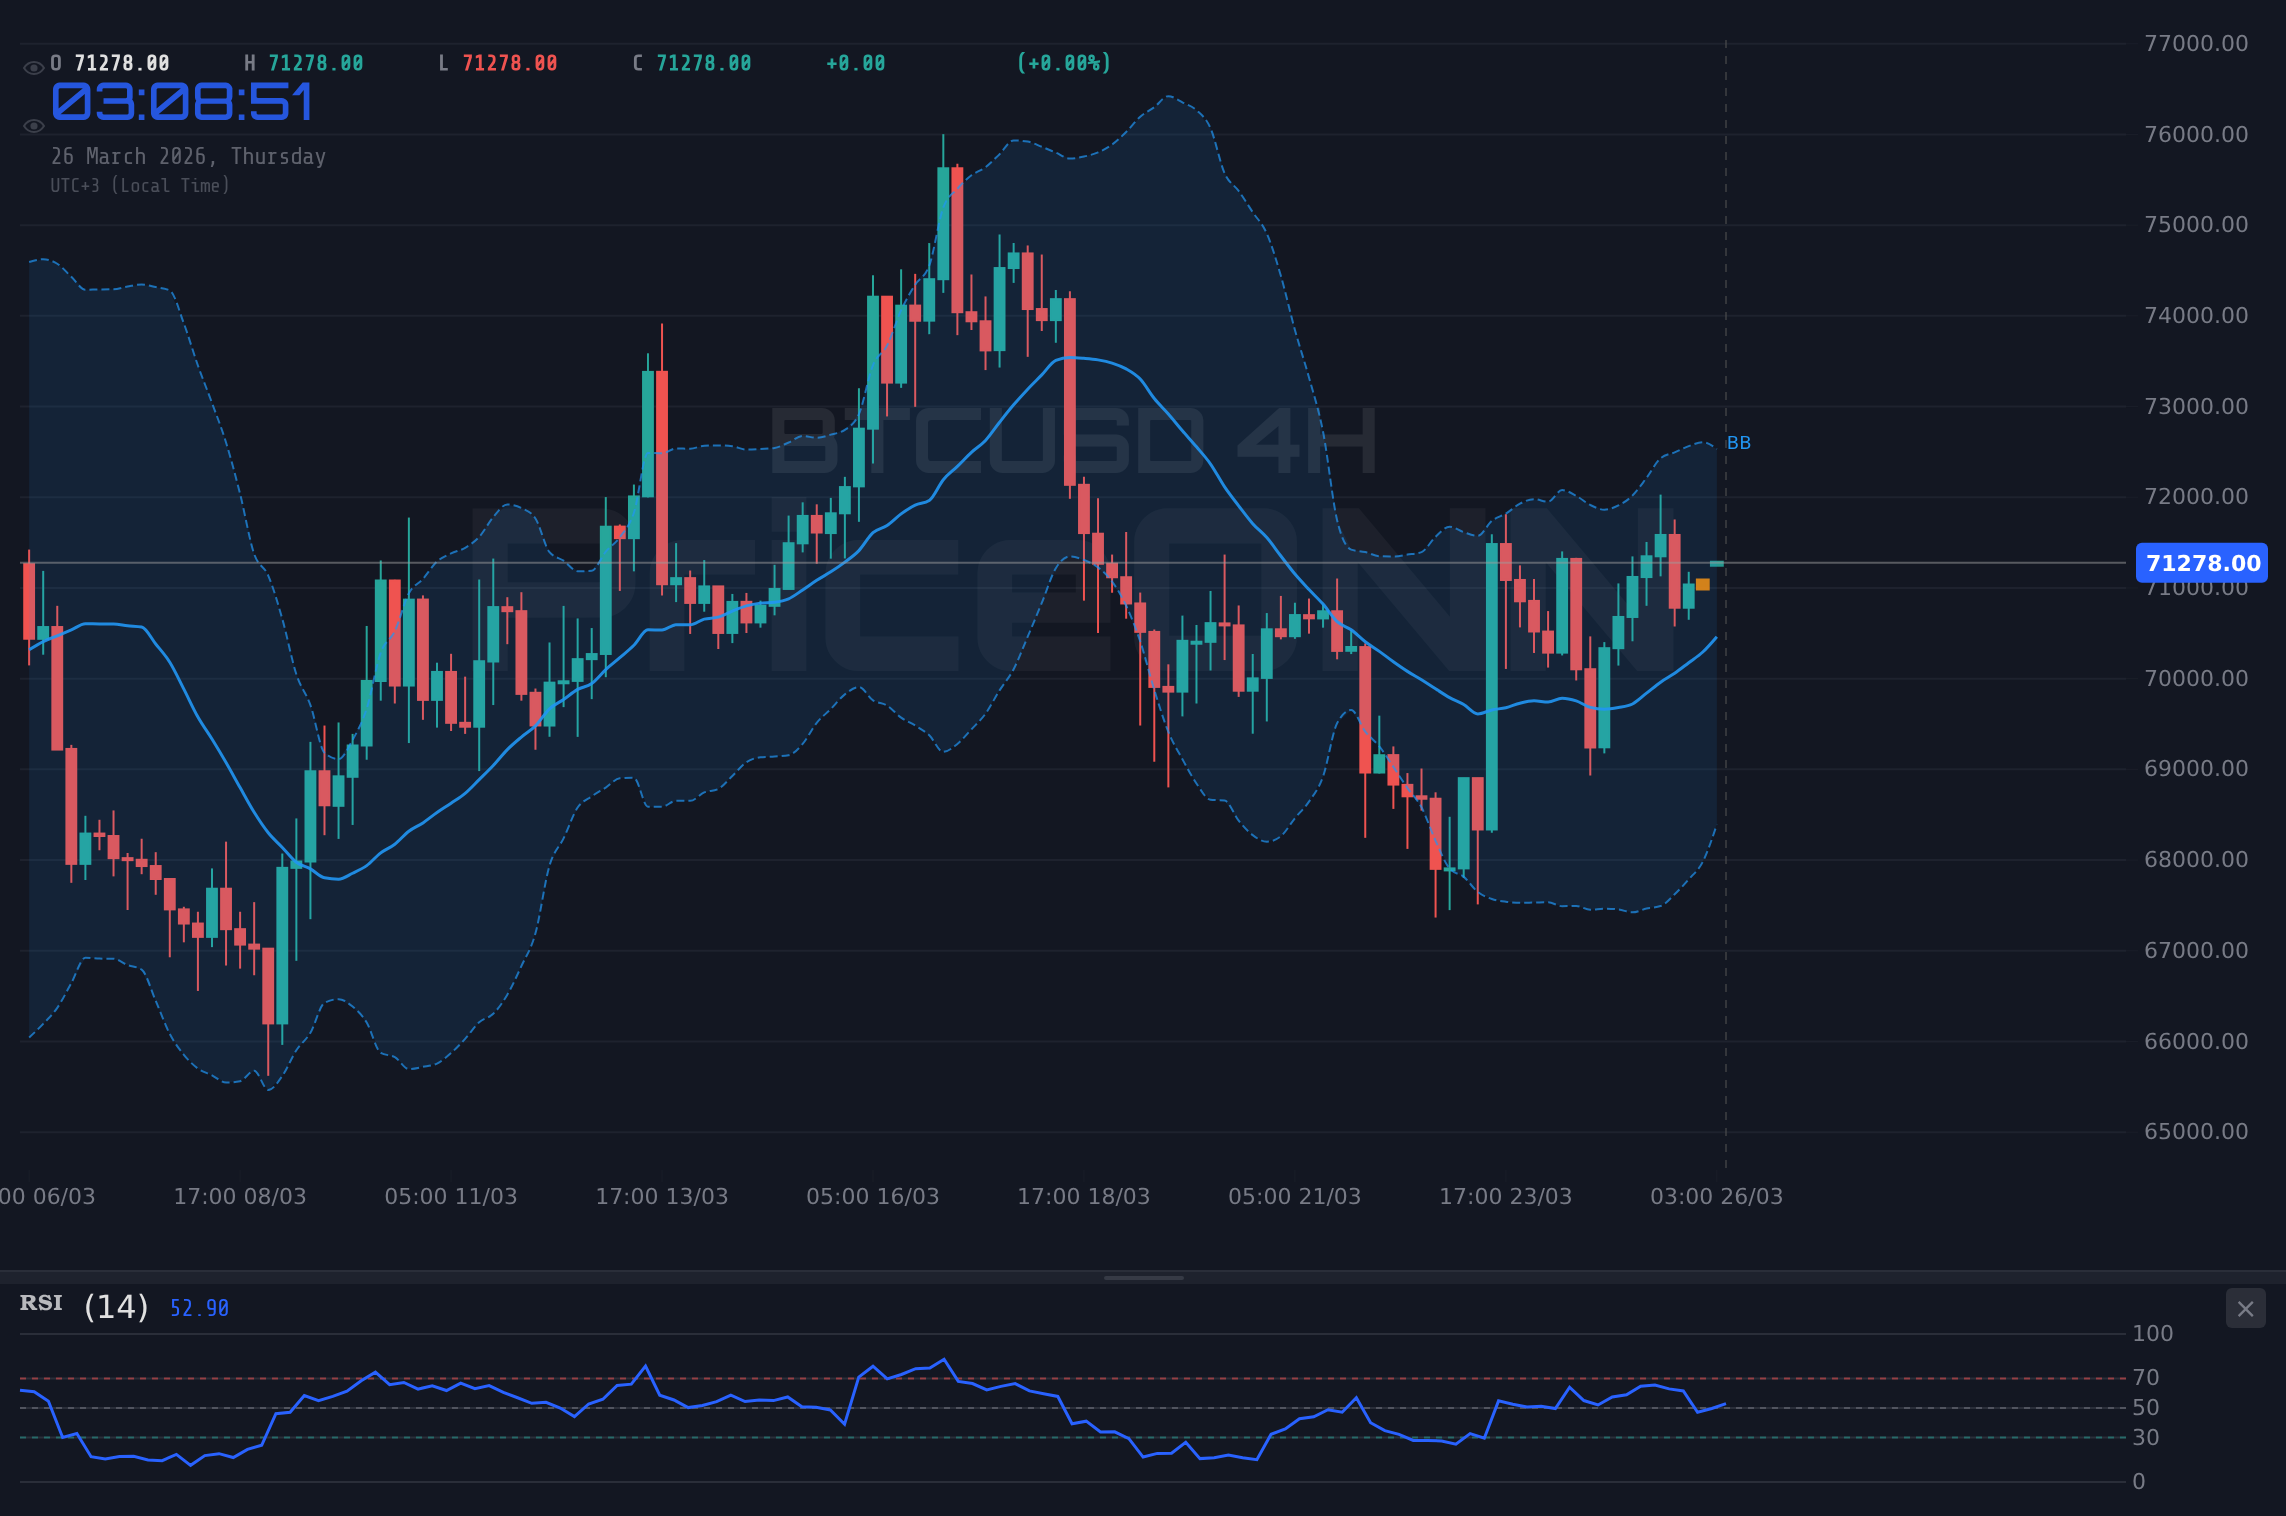
The current price of BTCUSD at $71,289 presents a fascinating technical tableau. After a recent surge, the cryptocurrency is now consolidating, indicating a pause in momentum. On the 1-hour chart, the Relative Strength Index (RSI) sits at a neutral 55.72. This reading suggests that while buyers have been active, the market is not yet in extreme overbought territory, leaving room for potential upside. However, the MACD histogram on the same timeframe is displaying negative momentum, hovering below the signal line. This divergence is key; it suggests that the upward price action might be losing its underlying strength, even as the price itself holds steady or creeps higher. It's a classic sign of indecision, where the market is digesting recent moves and awaiting fresh catalysts. The Stochastic Oscillator on the 1H chart, with K at 53.81 and D at 32.44, shows a bullish crossover, leaning towards upward movement, but it's the interplay with the MACD's current weakness that warrants close attention. This immediate 1H snapshot paints a picture of a market at a critical juncture, balanced precariously near a significant resistance.
The Bollinger Bands on the 1-hour chart further support this narrative of consolidation. The price is trading above the middle band, which typically acts as a dynamic support or resistance level, suggesting a slight bullish inclination in the very short term. However, the bands themselves are not expanding aggressively, implying a lack of strong volatility. The Average Directional Index (ADX) at 13.25 on this timeframe is particularly telling. An ADX value this low indicates a very weak trend. This means that the current price action is largely range-bound, and any move above or below the immediate consolidation zone might not be immediately sustained without further development. For scalpers and short-term traders, this environment demands caution, as false breakouts are common in low-ADX conditions. The overall signal on the 1H timeframe leans towards 'BUY' (7 Buy, 1 Sell, 0 Neutral), but this is heavily influenced by the immediate price action rather than conviction in a sustained trend.
The 4-Hour Perspective: Building Blocks for a Move
Shifting to the 4-hour timeframe provides a slightly broader context. Here, the BTCUSD is also showing a neutral trend, reinforced by an ADX of 16.58. This is still indicative of a market that hasn't committed to a strong direction, but it's slightly higher than the 1-hour reading, suggesting a nascent trend might be attempting to form. The RSI is at 55.15, maintaining that neutral-to-slightly-bullish stance observed on the shorter timeframe. The MACD, however, presents a more optimistic picture on the 4H chart. It's showing positive momentum, with the MACD line above its signal line. This suggests that the underlying strength supporting the price might be more robust over this timeframe compared to the 1-hour. The Stochastic Oscillator, with K at 73.82 and D at 74.33, is showing a slight bearish crossover, which could imply a near-term pullback, but it's still hovering in overbought territory, indicating that selling pressure hasn't fully materialized yet.
The Bollinger Bands on the 4-hour chart are also trading above the middle band, aligning with the MACD's positive momentum and suggesting an upward bias. However, the Stochastic's slight dip from its peak is a subtle warning sign that the upward push might be encountering friction. The overall signal on the 4-hour timeframe is also 'BUY' (7 Buy, 1 Sell, 0 Neutral), but the conflicting signals between the Stochastic and MACD, coupled with the low ADX, highlight the indecisiveness. This period of consolidation near resistance is crucial. It's where the market is essentially building energy. A successful breach of the immediate resistance levels could see a significant move higher, fueled by sidelined capital entering the market. Conversely, failure to break through could lead to a sharp reversal as the underlying negative momentum suggested by the 1H MACD begins to assert itself more strongly. The neutral trend strength here means that confirmation from longer timeframes or fundamental catalysts will be vital.
The current BTCUSD consolidation near $71,289 is a classic 'energy build-up' phase. The low ADX across multiple timeframes means trend followers should wait for a clear breakout with increasing volume. Short-term traders might look for scalps within the range, but risk management is paramount given the potential for sharp reversals.
The Daily View: Is the Uptrend Fading?
Daily Indicators: Mixed Signals Amidst Trend Weakness
Looking at the daily chart for BTCUSD reveals a more complex picture, one that tempers the short-term bullish leanings. The overall trend is classified as 'Neutral' with a 50% strength, a significant shift from the more directional signals on shorter timeframes. This neutrality is a critical observation. It suggests that while the price has moved up, the broader market sentiment and underlying trend dynamics are not yet decisively bullish. The RSI on the daily chart stands at 51.98, firmly in neutral territory. It's neither signaling overbought conditions nor oversold, which is consistent with a market that is digesting recent gains and awaiting further direction. The MACD is showing positive momentum, with the MACD line above its signal line, which is a bullish signal on this longer timeframe. This is a key point of conflict with the shorter timeframes, where negative MACD momentum was observed.
However, the Stochastic Oscillator on the daily chart presents a more cautious outlook. With K at 40.06 and D at 26.32, it shows a bullish crossover, but these values are still relatively low, indicating that even with the crossover, there's significant room before reaching overbought levels. The ADX on the daily chart is at 17.71, which is classified as a weak trend. This reinforces the idea that the current market environment, despite recent price action, lacks strong directional conviction on a longer-term basis. The Bollinger Bands are trading above the middle band, consistent with the MACD's bullish signal, but again, the lack of strong trend indicated by the ADX tempers this optimism. The overall signal on the daily timeframe is 'BUY' (7 Buy, 1 Sell, 0 Neutral), but the 'Neutral' trend strength and weak ADX mean this signal should be interpreted with caution. It suggests that while the price is currently supported, the underlying conditions for a sustained rally are not yet fully in place.
Correlation and Macro Context: The Dollar's Shadow
Understanding BTCUSD's price action in isolation is insufficient. Its correlation with broader market indicators, particularly the US Dollar Index (DXY), is a vital piece of the puzzle. The DXY is currently trading at 99.4, showing a significant daily increase of 0.54%. Historically, a strengthening dollar often puts pressure on risk assets like Bitcoin, as it increases the cost of holding non-dollar denominated assets and can signal a risk-off sentiment in global markets. The DXY's upward momentum, especially on the 1-hour chart where it shows a strong upward trend (98% strength) and RSI at 65.82, suggests that the dollar is gaining strength. This macro backdrop is a headwind for BTCUSD. If the dollar continues to climb, it could easily stifle any attempts by Bitcoin to break above its current resistance levels. Conversely, any weakness in the DXY could provide a much-needed tailwind for Bitcoin.
Furthermore, the performance of major equity indices like the S&P 500 and Nasdaq 100 cannot be ignored. Both are showing a 'Düşüş' (Downtrend) on their daily charts, with the S&P 500 at 6582.95 and the Nasdaq 100 at 24122.89. This risk-off sentiment in equities often spills over into the cryptocurrency market, which is increasingly seen as a risk-on asset. The fact that both major US indices are in daily downtrends adds another layer of caution to the bullish signals seen in Bitcoin's shorter timeframes. While Bitcoin has sometimes shown signs of decoupling from traditional markets, a sustained sell-off in equities, coupled with a strengthening dollar, typically creates a challenging environment for riskier assets. The current price action of BTCUSD near resistance, against a backdrop of a strengthening dollar and falling stocks, suggests that the path of least resistance might be downwards unless a significant catalyst emerges to shift this macro narrative.
The strengthening DXY (currently at 99.4) and the downtrend in major indices like the S&P 500 (at 6582.95) create a challenging macro environment for BTCUSD. Traders should be aware that risk-off sentiment in traditional markets can easily spill over into cryptocurrencies, potentially capping upside near current resistance levels.
The $71,289 Level: A Line in the Sand
Defining the Immediate Battleground
The price level of $71,289 is more than just a number; it's a psychological and technical barrier. For BTCUSD, breaking decisively above this point would signal a continuation of the bullish momentum that has characterized much of the recent market. On the 1-hour chart, the immediate resistance is pegged at $72,246.33. A sustained move above this level, ideally accompanied by increasing volume and confirmation from other indicators, would be a strong signal for further upside potential, possibly targeting the next resistance at $74,289. The market data shows resistance levels at $71,515.33, $72,246.33, and $73,986.33 on the daily chart, providing clear upside objectives if the bulls regain control. However, the journey to these levels is not guaranteed. The market needs to overcome the immediate psychological hurdle around $71,289 first.
Conversely, failure to break through $71,289 could lead to a retest of the support levels. On the 1-hour chart, immediate support is found at $70,419.33, followed by $69,857.33 on the 4-hour chart. The daily support levels are significantly lower, starting at $69,044.33, $67,752.67, and $66,573.33. These lower levels represent potential targets if the price fails to hold the current consolidation zone and the bearish macro factors begin to dominate. The ADX values across all timeframes (13.25 on 1H, 16.58 on 4H, 17.71 on 1D) suggest that a strong, sustained trend in either direction is not yet established. This implies that the price could remain range-bound or experience sharp, but potentially short-lived, moves until a clearer trend signal emerges. The key takeaway is that $71,289 is the immediate line in the sand; its decisive breach or failure will dictate the near-term direction.
What the Crypto Ecosystem Is Saying
Beyond the charts, the underlying cryptocurrency ecosystem provides crucial context. While the provided data doesn't include on-chain metrics, we can infer potential sentiment. If recent news about USDC's price drop due to stablecoin regulation fears is indicative of broader regulatory scrutiny, this could create headwinds for the entire crypto market, including Bitcoin. Regulatory uncertainty often leads to decreased institutional adoption and can dampen investor confidence, potentially pressuring prices downwards. However, the news about Ripple's RLUSD and Singapore's BLOOM initiative, aiming to leverage tokenized assets, suggests ongoing innovation and integration efforts within the digital asset space. Such developments, if successful, could eventually boost investor confidence and drive adoption, providing a long-term bullish underpinning.
The mention of Ethereum's Layer-2 solutions driving institutional adoption of tokenized assets also highlights the maturation of the blockchain space. As the infrastructure becomes more robust and user-friendly, it can attract more traditional finance players. For Bitcoin, this means potential inflows from institutions looking to gain exposure to digital assets, either directly or indirectly through ETFs. While the immediate price action is dominated by technical levels and macro correlations, these fundamental developments in the broader crypto space are crucial for the long-term outlook. The ongoing innovation suggests a healthy, albeit sometimes volatile, ecosystem. The challenge for traders is to discern whether these fundamental strengths are enough to overcome the current technical resistance and bearish macro correlations in the short to medium term.
For BTCUSD to sustain a move above $71,289, confirmation is key. Look for a daily close above the $71,515.33 resistance, increasing trading volume, and a concurrent weakening of the DXY (currently at 99.4). A break below the $69,044.33 daily support would invalidate this bullish thesis.
Trade Stance: Cautious Observation Above $71,289
The WATCH_ZONE Verdict
Given the current technical confluence of factors - neutral daily trend strength, conflicting signals across timeframes, significant resistance near the current price, and bearish macro correlations with a strengthening dollar and falling equities - the most prudent approach for BTCUSD is a 'WATCH_ZONE' stance. The low ADX values across all analyzed timeframes (1H: 13.25, 4H: 16.58, 1D: 17.71) strongly suggest that the market lacks directional conviction. Attempting to force a trade in such an environment, without clear confirmation, significantly increases risk. The risk/reward ratio is currently unfavorable for a decisive entry without further price action development.
Conditions for a Valid Setup
A valid bullish setup would require a decisive daily close above the immediate resistance at $71,515.33. This would not only break the current consolidation pattern but also signal intent to challenge higher levels. Confirmation would ideally come with a surge in trading volume and a weakening of the US Dollar Index (DXY). If this scenario unfolds, the path towards the next resistance levels at $72,246.33 and subsequently $73,986.33 would open up. On the flip side, a bearish setup would be triggered by a failure to hold the current price range, leading to a break below the 1-hour support at $70,419.33. A confirmed break below the daily support at $69,044.33 would significantly increase the probability of a deeper correction, potentially targeting levels much lower down. Until one of these clear scenarios plays out, patience is the name of the game.
The current environment, characterized by indecision and conflicting signals, means that aggressive positioning is unwarranted. Instead, traders should focus on observing how BTCUSD reacts to the $71,289 level. A clear breakout above resistance, supported by strong volume and favorable macro conditions (weaker DXY, stable or rising equities), would be the prime opportunity for bullish entries. Conversely, a decisive break below support, especially the daily level at $69,044.33, would signal a shift towards bearish sentiment, opening opportunities for short positions. The market is giving us clear levels to watch; the discipline lies in waiting for the price to confirm a direction before committing capital. Remember, managing risk is paramount, and in a range-bound or uncertain market, cutting losses quickly on any failed breakout attempt is crucial.
Scenario Analysis: Mapping Potential Paths for BTCUSD
Bearish Scenario: Resistance Holds, Reversal Looms
55% ProbabilityBullish Scenario: Breakout Above $71,289
35% ProbabilityNeutral Scenario: Range-Bound Consolidation Continues
10% ProbabilityFrequently Asked Questions: BTCUSD Analysis
What happens if BTCUSD fails to break above the $71,515.33 resistance level?
If BTCUSD fails to break above the $71,515.33 resistance, it is likely to consolidate further or potentially reverse downwards. A close below the $70,419.33 support would strengthen the bearish case, targeting lower levels around $69,044.33.
Is the current RSI level of 55.72 a buy signal for BTCUSD at $71,289?
An RSI of 55.72 on the 1-hour chart suggests neutral momentum with a slight upward bias, not a direct buy signal. While it doesn't indicate overbought conditions, confirmation from other indicators and price action is needed. A break above $71,515.33 would be a more convincing bullish trigger.
How is the strengthening DXY at 99.4 impacting BTCUSD's potential for an upside breakout?
The strengthening DXY at 99.4 generally acts as a headwind for BTCUSD, as a stronger dollar often correlates with risk-off sentiment. This macro factor increases the probability of BTCUSD consolidating or reversing downwards near resistance, rather than breaking out, unless other strong bullish catalysts emerge.
What should traders watch for to confirm a bullish breakout above $71,289 for BTCUSD?
Confirmation of a bullish breakout above $71,289 for BTCUSD would involve a decisive daily close above $71,515.33, accompanied by significantly increased trading volume. A concurrent weakening of the DXY (currently at 99.4) would further validate the bullish move, potentially targeting $72,246.33.
Track markets in real-time
AI-powered analysis, technical indicators and real-time price data.
Join Our Telegram Channel
Breaking market news, AI analysis and trading signals instantly.
Join Channel