BTCUSD Trades Near $67,949: Bulls vs. Bears Fight for Control
BTCUSD hovers around $67,949 as technical indicators flash conflicting signals. A crucial battle is unfolding between buyers and sellers, with key support and resistance levels in focus.
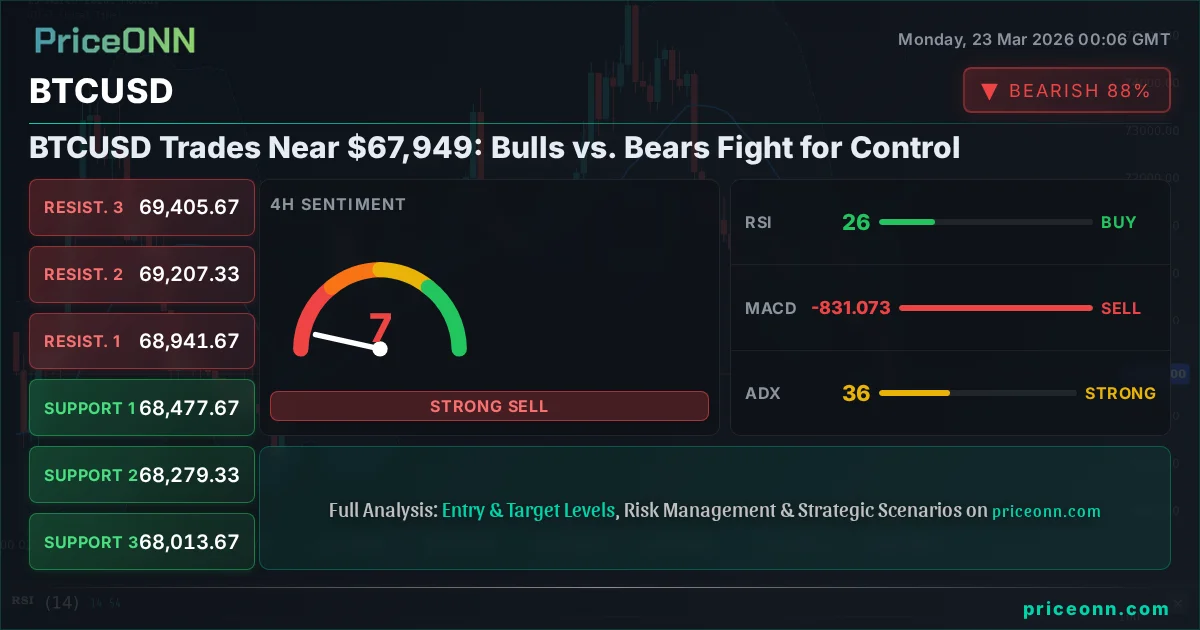
The cryptocurrency market is holding its breath as Bitcoin (BTCUSD) finds itself locked in a fierce tug-of-war near the $67,949 mark. This pivotal price point is becoming a battleground where bulls and bears are clashing, each seeking to dictate the next significant move. With the daily close on the 4-hour chart showing a strong bearish trend (93% strength) and the 1-day chart indicating a neutral stance (50% strength), the immediate direction remains uncertain. This divergence highlights the critical juncture BTCUSD is currently navigating, making it essential for traders to understand the underlying technical and fundamental forces at play. The tension is palpable, and the outcome of this struggle could set the tone for the broader crypto market in the short term.
- BTCUSD is currently trading at $67,949, with the 4H chart showing a strong bearish trend and the 1D chart neutral.
- Critical support sits at $67,366 (1H), while resistance looms at $68,637 (1H).
- RSI at 33 on the 1H chart signals potential buying interest in oversold territory, but ADX at 43.04 indicates a strong downtrend.
- The broader market sentiment, influenced by DXY strength and equity market declines, is a key factor affecting BTCUSD.
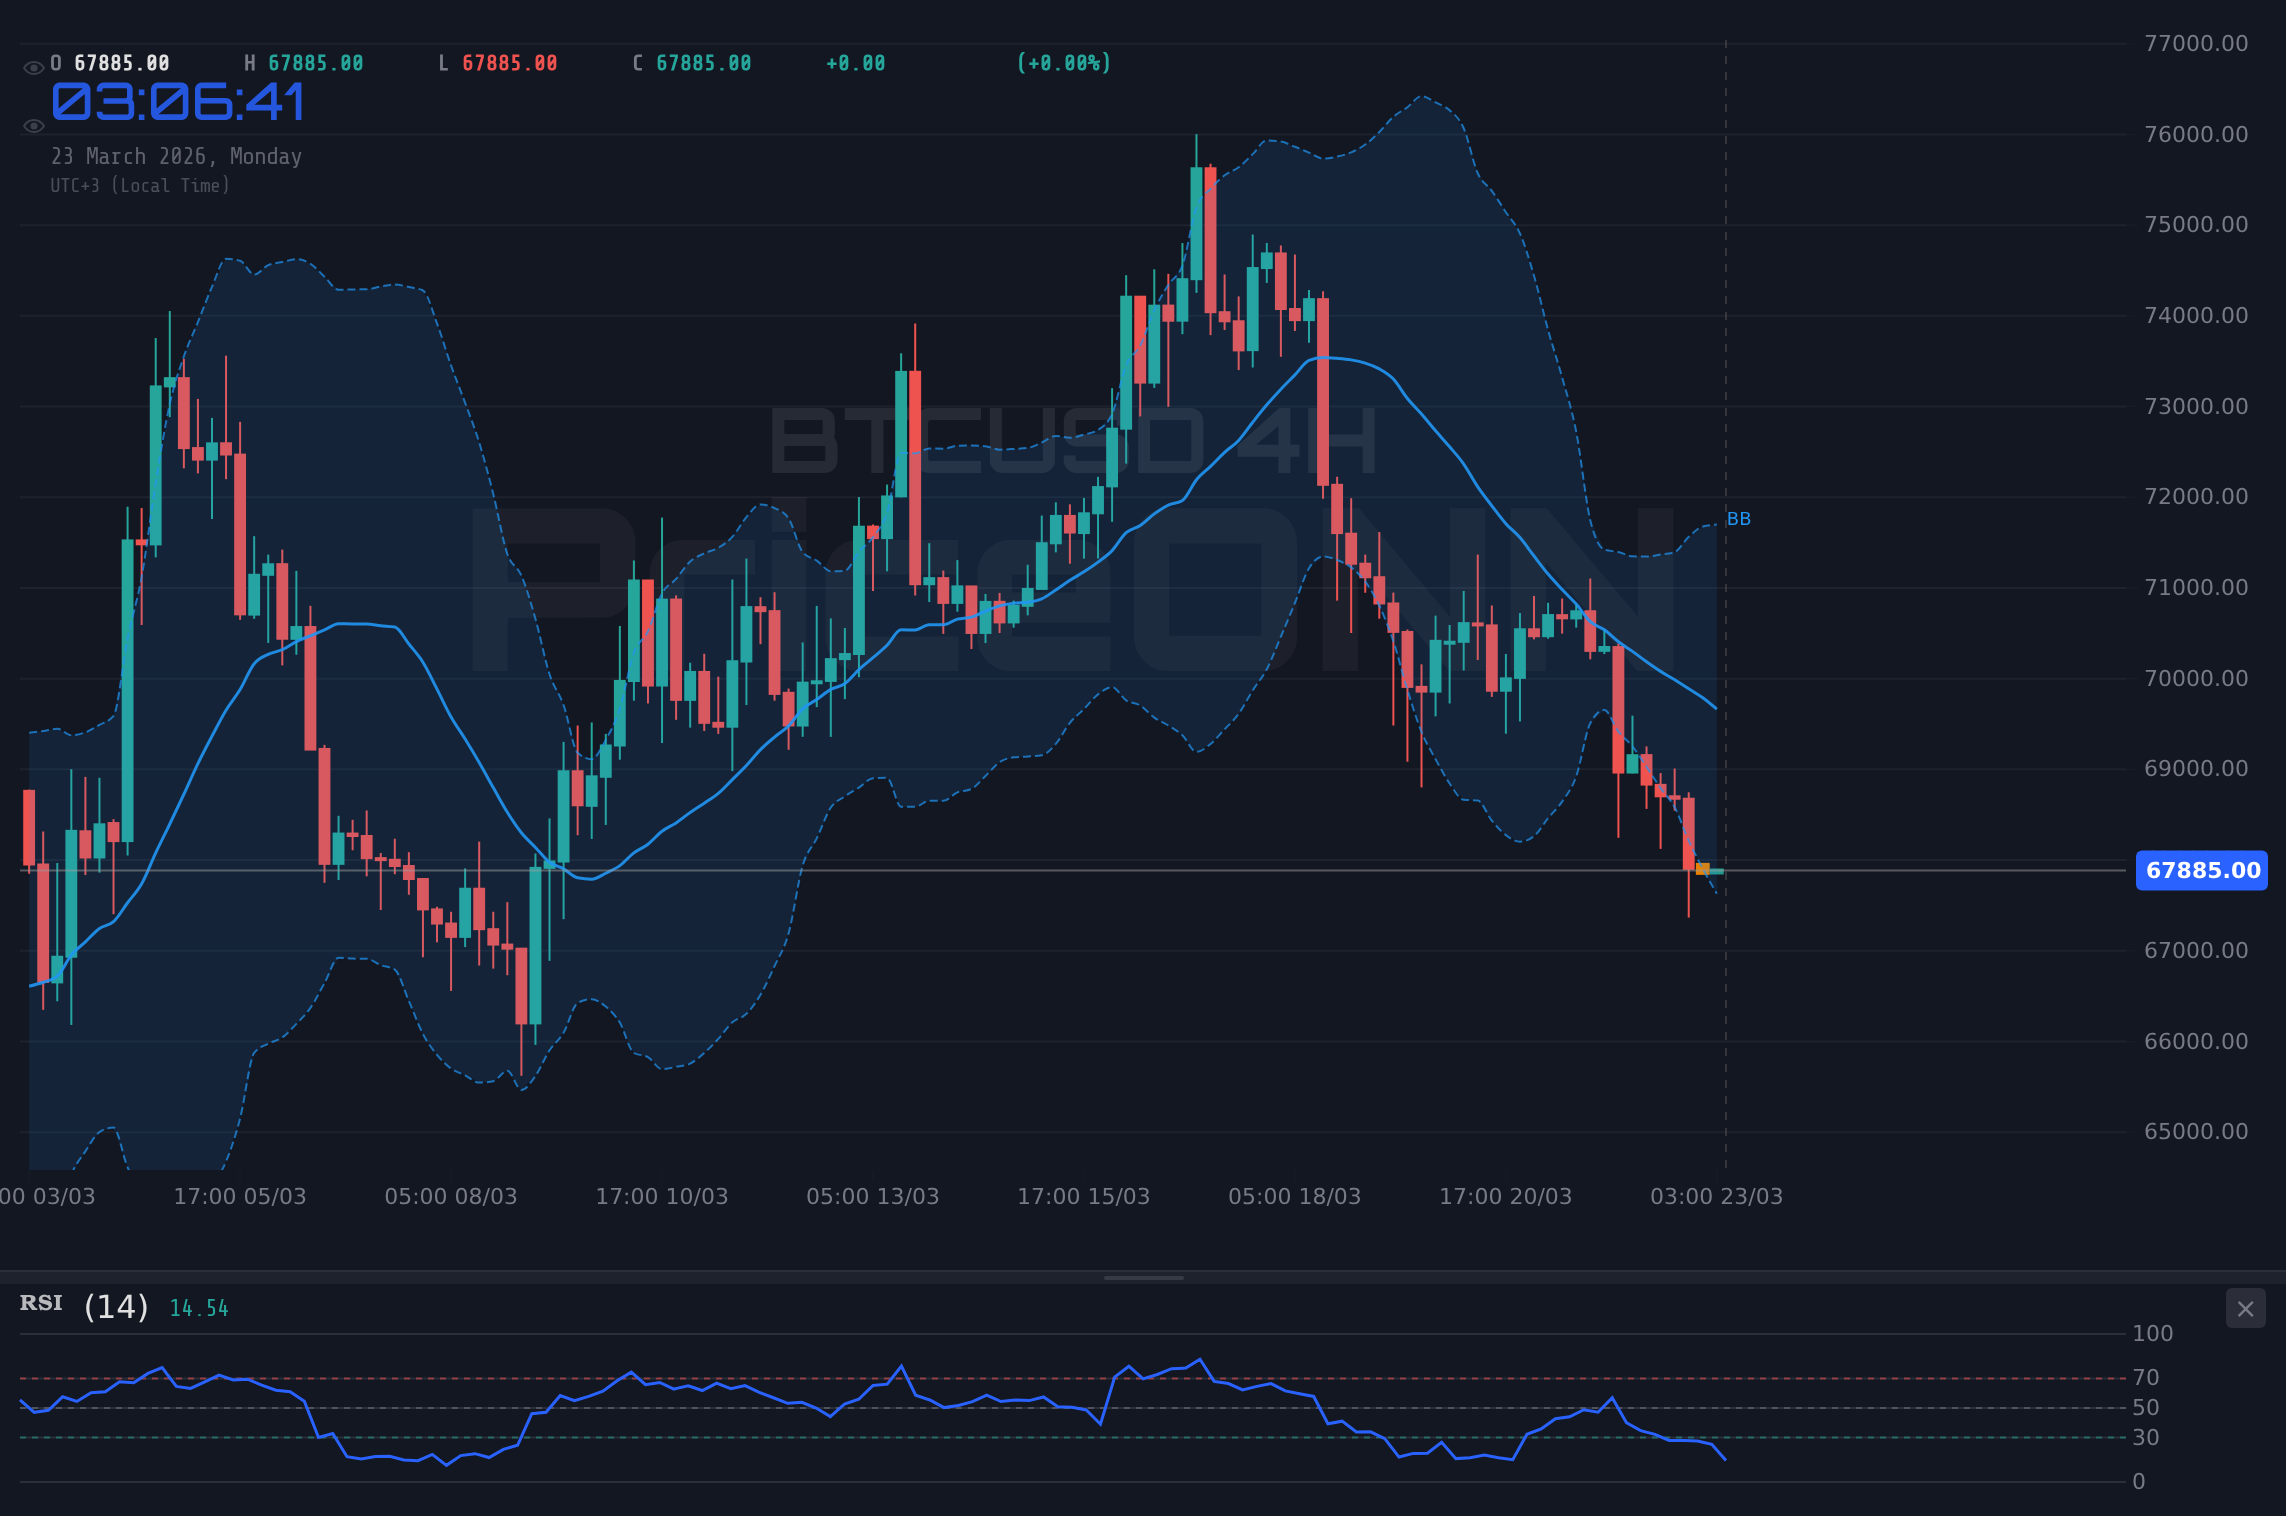
The sheer volatility observed in BTCUSD over the past 24 hours, with a daily change of -3.41% and a range from $67,366 to $70,388, underscores the current market's precarious balance. This is not a market for the faint of heart; it demands a clear understanding of risk management and the ability to interpret conflicting signals. The bulls are trying to defend key psychological levels, hoping to stem the bleeding and initiate a recovery. Conversely, the bears are pressing their advantage, aiming to break through support levels and push prices lower, potentially triggering further liquidations and cascading sell-offs. The market sentiment analysis indicates a cautious approach is warranted, as conflicting signals from technical indicators suggest a period of consolidation or a sharp directional move is imminent.
The Bullish Case: Can $67,949 Hold?
From a bullish perspective, the current price action around $67,949 presents a potential buying opportunity, especially considering the oversold conditions indicated by several technical indicators. On the 1-hour chart, the RSI(14) is hovering at 33, a level historically associated with potential bounces. While not deeply oversold, it suggests that the selling pressure might be exhausting. Similarly, the Stochastic Oscillator (%K: 42.54, %D: 37.83) shows the %K line crossing above the %D line, a bullish signal that often precedes an upward move. The presence of support at $67,366 on the 1H timeframe is crucial. If BTCUSD can hold this level and begin to consolidate, bulls might see this as a springboard for a move back towards the immediate resistance at $68,637.
Furthermore, the broader macroeconomic context, while currently leaning bearish, could shift. Any signs of a weaker US Dollar (DXY) or a stabilization in equity markets (SP500, Nasdaq) could trigger a risk-on sentiment, benefiting Bitcoin. The DXY, currently at 99.36, has shown signs of a downtrend on the 1H chart, which could be a precursor to a broader dollar weakness. If this trend continues, it would alleviate some of the pressure on risk assets like BTCUSD. The recent decline in the SP500 to 6488.35 and Nasdaq to 23790.39, while currently bearish, also creates a scenario where a sharp rebound could pull cryptocurrencies higher. The bulls are looking for a catalyst, perhaps a less hawkish tone from the Federal Reserve or positive inflation data, to reignite their conviction.
On the 1-day timeframe, while the ADX at 19.62 indicates a weak trend, the RSI at 28.3 is deep in oversold territory, suggesting that a significant bounce could be on the cards. This daily oversold condition, combined with the potential for short-term oversold bounces on lower timeframes, forms the core of the bullish argument. A decisive break and hold above the 1-hour resistance at $68,637 would be the first confirmation needed, followed by a push towards $68,931. The ultimate test would be reclaiming the psychologically significant $70,000 level, but that requires sustained buying pressure and a shift in overall market sentiment.
The Bearish Case: Is $67,366 the Next Stop?
The bears, however, have a compelling argument, primarily driven by the strong downtrend signals on multiple timeframes. The 4-hour chart shows a very strong bearish trend with an ADX of 63.47 for XAGUSD and 36.32 for BTCUSD on the 1D chart, indicating that the momentum behind the current downward move is substantial. On the 1-hour timeframe, the MACD is firmly below its signal line, and the histogram is printing negative values, confirming bearish momentum. The Bollinger Bands are also showing price trading below the middle band, reinforcing the bearish sentiment. The ADX at 43.04 on the 1H BTCUSD chart is a significant warning sign, suggesting that the downtrend has strong conviction behind it and is unlikely to reverse without a significant catalyst.
The immediate support level at $67,366 (the daily low) is a critical area. A break below this level on increased volume could trigger a cascade of stop-losses, pushing BTCUSD towards the next significant support at $66,987 on the 1H chart. The daily support levels, while further away at $70,006.67, $69,664.33, and $69,115.67, represent the next major zones of interest if the selling pressure intensifies. The stark daily RSI of 25.56 on the Dow Jones 30 and 27.82 on the SP500, coupled with BTCUSD's own RSI readings, paints a grim picture of risk aversion. This suggests that any upward moves might be short-lived, primarily serving as opportunities for bears to enter or add to their positions.
Furthermore, the strength of the US Dollar Index (DXY) at 99.36, exhibiting a strong uptrend on the 1D chart (ADX 34.64), acts as a significant headwind for risk assets like Bitcoin. When the dollar strengthens, it typically exerts downward pressure on cryptocurrencies and other commodities. The current market narrative seems to favor the dollar, especially if inflation concerns persist or if the Federal Reserve signals a more hawkish stance. The recent surge in oil prices, with Brent at $112.54 and WTI at $99.02, could reignite inflation fears, prompting the Fed to maintain tighter monetary policies, which would be detrimental to Bitcoin's price action. The bears are watching closely for any signs of capitulation, which could lead to a swift move lower.
Technical Confluence: Conflicting Signals Amidst Downtrend
The technical picture for BTCUSD is a complex tapestry of conflicting signals, a common characteristic of markets at critical juntections. On the 1-hour chart, the RSI at 33 and Stochastic's bullish crossover hint at a potential short-term bounce. However, this is directly contradicted by the strong ADX of 43.04, which screams 'downtrend continuation.' This divergence is a classic sign that the market is undecided, and the prevailing trend is still dominant but showing signs of potential exhaustion. The MACD, consistently negative across all analyzed timeframes (1H, 4H, 1D), reinforces the bearish sentiment, indicating that selling momentum is still present, even if short-term indicators suggest a pause.
The 4-hour timeframe presents a more bearish outlook. The ADX at 36.32 confirms a strong downtrend, and the RSI at 26.69 is deep in oversold territory. While oversold conditions can sometimes precede a reversal, in a strong trend, they can also persist, leading to further downside. The Stochastic (%K: 17.87, %D: 25.88) also indicates a bearish signal, with %K below %D. This confluence of bearish indicators on the 4-hour chart suggests that any upward movement might be a pullback within a larger downtrend, rather than a true reversal. The bulls need to see a clear break above the 1H resistance levels and sustained buying volume to invalidate this bearish structure.
On the daily chart, the picture becomes even more nuanced. The ADX at 21.63 suggests a weaker trend compared to the lower timeframes, implying a potential for sideways movement or consolidation. However, the RSI at 43.27 is still below the 50 level, indicating a bearish bias, and the MACD remains negative. The Stochastic oscillator (%K: 17.48, %D: 46.37) provides a bearish signal. The daily support at $70,006.67 and resistance at $70,897.67 frame the immediate trading range. A decisive move outside this range, confirmed by increasing volume and stronger ADX readings, will be key to determining the next significant trend.
The Verdict: Tread Carefully in the $67,949 Zone
Given the current market data, the BTCUSD is in a precarious position. The strong bearish signals on the 4-hour and 1-hour charts, coupled with the persistent strength of the US Dollar and negative equity market sentiment, lean the scales towards the bears in the short term. The immediate support at $67,366 is a critical level to watch. A decisive break below this could open the door for a rapid descent towards $66,987 and potentially lower.
However, the oversold conditions on the 1-day RSI (25.56 on DJIA, 27.82 on SP500, 28.3 on BTCUSD 1D) cannot be ignored. These readings suggest that while the downtrend is strong, the market might be approaching a point where a significant bounce is possible, especially if external factors shift favorably. For a bullish thesis to gain traction, BTCUSD needs to hold the $67,366 support, reclaim the $68,637 resistance, and ideally push towards $70,000. Until then, the risk remains skewed to the downside.
The interplay between the strong downtrend on lower timeframes and the oversold conditions on the daily chart creates a 'WATCH_ZONE' scenario. This means that while a clear setup isn't present for aggressive entry, traders should be vigilant. A daily close above the $68,637 resistance level, confirmed by increasing volume and a turnaround in broader market sentiment, would be the first step in invalidating the immediate bearish pressure and could signal a potential shift. Conversely, a breakdown below $67,366 would confirm the bears' dominance and likely lead to further price depreciation, testing lower support levels.
Patience is paramount here. The market is offering conflicting signals, and forcing a trade could be detrimental. Waiting for confirmation - either a solid bounce from support or a clear breakdown below it - will be key to navigating this volatile period. The $67,949 level represents not just a price point, but a battle for market control. Understanding the conditions required for each scenario to play out is crucial for risk management and identifying potential opportunities as they emerge.
Frequently Asked Questions: BTCUSD Analysis
What happens if BTCUSD breaks below the $67,366 support level?
A breakdown below $67,366, especially with strong volume, would likely trigger further selling pressure. Bears would aim for the next support at $66,987, with the potential to test even lower levels if momentum continues. This would invalidate any short-term bullish hopes.
Should I buy BTCUSD at current levels of $67,949 given the RSI at 33 on the 1H chart?
Buying solely based on the 1H RSI at 33 is risky due to the strong downtrend indicated by the ADX at 43.04. While it suggests oversold conditions, confirmation is needed. A better approach would be to wait for a confirmed bounce from $67,366 or a break above $68,637 before considering a long position.
Is the MACD showing a sell signal for BTCUSD on the 4-hour chart?
Yes, the MACD on the 4-hour chart is consistently negative, with the MACD line below the signal line. This confirms bearish momentum and suggests that selling pressure is dominant on this timeframe, aligning with the overall downtrend.
How will the current DXY strength at 99.36 affect BTCUSD this week?
The strong DXY at 99.36, with a 1D uptrend, generally exerts downward pressure on risk assets like BTCUSD. If the dollar continues to strengthen, it could hinder any potential recovery attempts by Bitcoin and reinforce the bearish sentiment in the market.
Bearish Scenario: Downside Momentum Continues
65% ProbabilityNeutral Scenario: Consolidation Around $67,949
25% ProbabilityBullish Scenario: Short-Term Bounce Potential
10% ProbabilityTrack markets in real-time
AI-powered analysis, technical indicators and real-time price data.
Join Our Telegram Channel
Breaking market news, AI analysis and trading signals instantly.
Join Channel