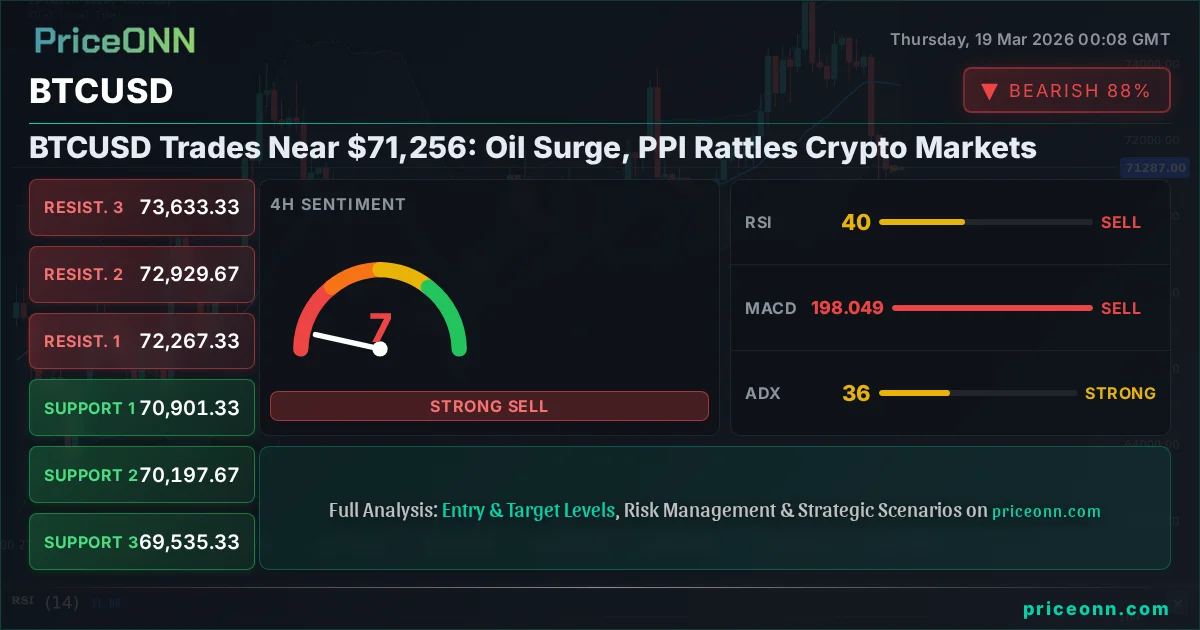
BTCUSD Trades Near $71,256: Oil Surge, PPI Rattles Crypto Markets
Bitcoin hovers around $71,256 as a surge in oil prices and hot US PPI data rattle markets ahead of the Fed decision. Geopolitical tensions and inflation fears dominate.
The cryptocurrency market, particularly Bitcoin, is navigating a complex landscape where escalating geopolitical tensions and surprisingly robust inflation data are casting a long shadow. As traders digest the implications of surging oil prices and a higher-than-expected US Producer Price Index (PPI), the digital asset space finds itself at a critical juncture. With BTCUSD currently trading near the $71,256 mark, the question on everyone's mind is whether these macro headwinds will derail the ongoing crypto rally or simply create a volatile, yet ultimately navigable, environment. This analysis delves into the interplay between these global market forces and their specific impact on Bitcoin's trajectory, examining the technical signals and fundamental underpinnings that will shape its path forward.
- Bitcoin hovers around $71,256, influenced by macro factors like surging oil and hot PPI data.
- The Dollar Index (DXY) at 99.95 shows strength, potentially pressuring risk assets like BTCUSD.
- Brent Crude at $109.87 signals rising inflation expectations, a key concern for central banks.
- Technical indicators on BTCUSD suggest caution, with RSI at 31.63 on 1H and 46.39 on 1H ADX pointing to bearish momentum.
Macroeconomic Storm Clouds Gather
The financial world is currently a chessboard where major events are rapidly shifting the pieces. The latest geopolitical developments, particularly those emanating from the Middle East, have injected a significant dose of uncertainty. Reports of an attack on Iran's South Pars gas field and escalating regional energy fears have sent shockwaves through commodity markets. Brent crude, a key global benchmark, has surged dramatically, trading near $109.87. This isn't just a headline; it's a direct signal of potential supply disruptions and a potent catalyst for renewed inflation concerns. When energy prices, the lifeblood of global commerce, spike like this, the ripple effects are felt across all asset classes. It directly impacts transportation costs, manufacturing expenses, and consumer prices, forcing central banks to recalibrate their strategies. The market's reaction has been swift, with the US Dollar Index (DXY) finding support and climbing towards 99.95, reflecting a typical flight to safety amidst rising global risk. This backdrop is crucial for understanding Bitcoin's current position. While often touted as a digital gold or an inflation hedge, its correlation with risk assets, particularly tech stocks like the Nasdaq, remains a dominant factor. When the broader market sentiment turns cautious, driven by inflation fears and geopolitical instability, even seemingly uncorrelated assets can feel the pressure. The recent sharp decline in SP500, down 1.45% to 6621.1, and Nasdaq100's 1.55% drop to 24415, underscores this risk-off sentiment. This correlation means that as the DXY strengthens and equities falter, Bitcoin faces an uphill battle, even if its long-term inflation-hedging narrative persists. The current price of BTCUSD, hovering around $71,256, is being tested by these powerful macro forces, making the immediate outlook one of heightened vigilance.The Inflationary Signal from PPI
Adding fuel to the fire, the latest US Producer Price Index (PPI) data came in hotter than anticipated. This is not merely a statistic; it's a forward-looking indicator of consumer inflation. When producers are paying more for goods and services, those costs are invariably passed down the supply chain to consumers. The surge in PPI, coinciding with the rise in oil prices, paints a picture of persistent inflationary pressures that central banks, particularly the Federal Reserve, cannot ignore. The market's interpretation of this data is critical. Hotter inflation typically strengthens the case for more hawkish monetary policy – potentially higher interest rates for longer, or a delayed timeline for rate cuts. This is precisely the kind of environment that can put pressure on growth-oriented assets like cryptocurrencies. The Fed's upcoming decision, already a focal point, now carries even greater weight. Any hint of a more aggressive stance to combat inflation could trigger significant shifts in market liquidity and risk appetite, directly impacting Bitcoin's price action around the $71,256 level. The correlation between Bitcoin and interest rate expectations is undeniable. When markets anticipate tighter monetary policy, the cost of capital increases, making speculative assets less attractive. Conversely, expectations of rate cuts or a dovish pivot tend to boost risk assets. The current scenario, with elevated oil prices and a strong PPI, pushes back against the narrative of imminent rate cuts. This creates a challenging technical and fundamental environment for BTCUSD. While Bitcoin has shown resilience in the past, the confluence of geopolitical risk, rising energy costs, and hawkish central bank policy expectations presents a multi-faceted headwind that cannot be easily dismissed. The $71,256 price point is therefore not just a number, but a battleground where these macro forces are clashing with the underlying demand for digital assets.The surge in Brent crude past $108 and the unexpectedly high US PPI figures are creating a challenging macro environment. This combination fuels inflation fears, strengthening the US Dollar (currently at 99.95) and pressuring risk assets like Bitcoin (trading near $71,256). Traders are closely watching the Federal Reserve's response to these inflationary signals.
Bitcoin's Technical Tightrope Walk
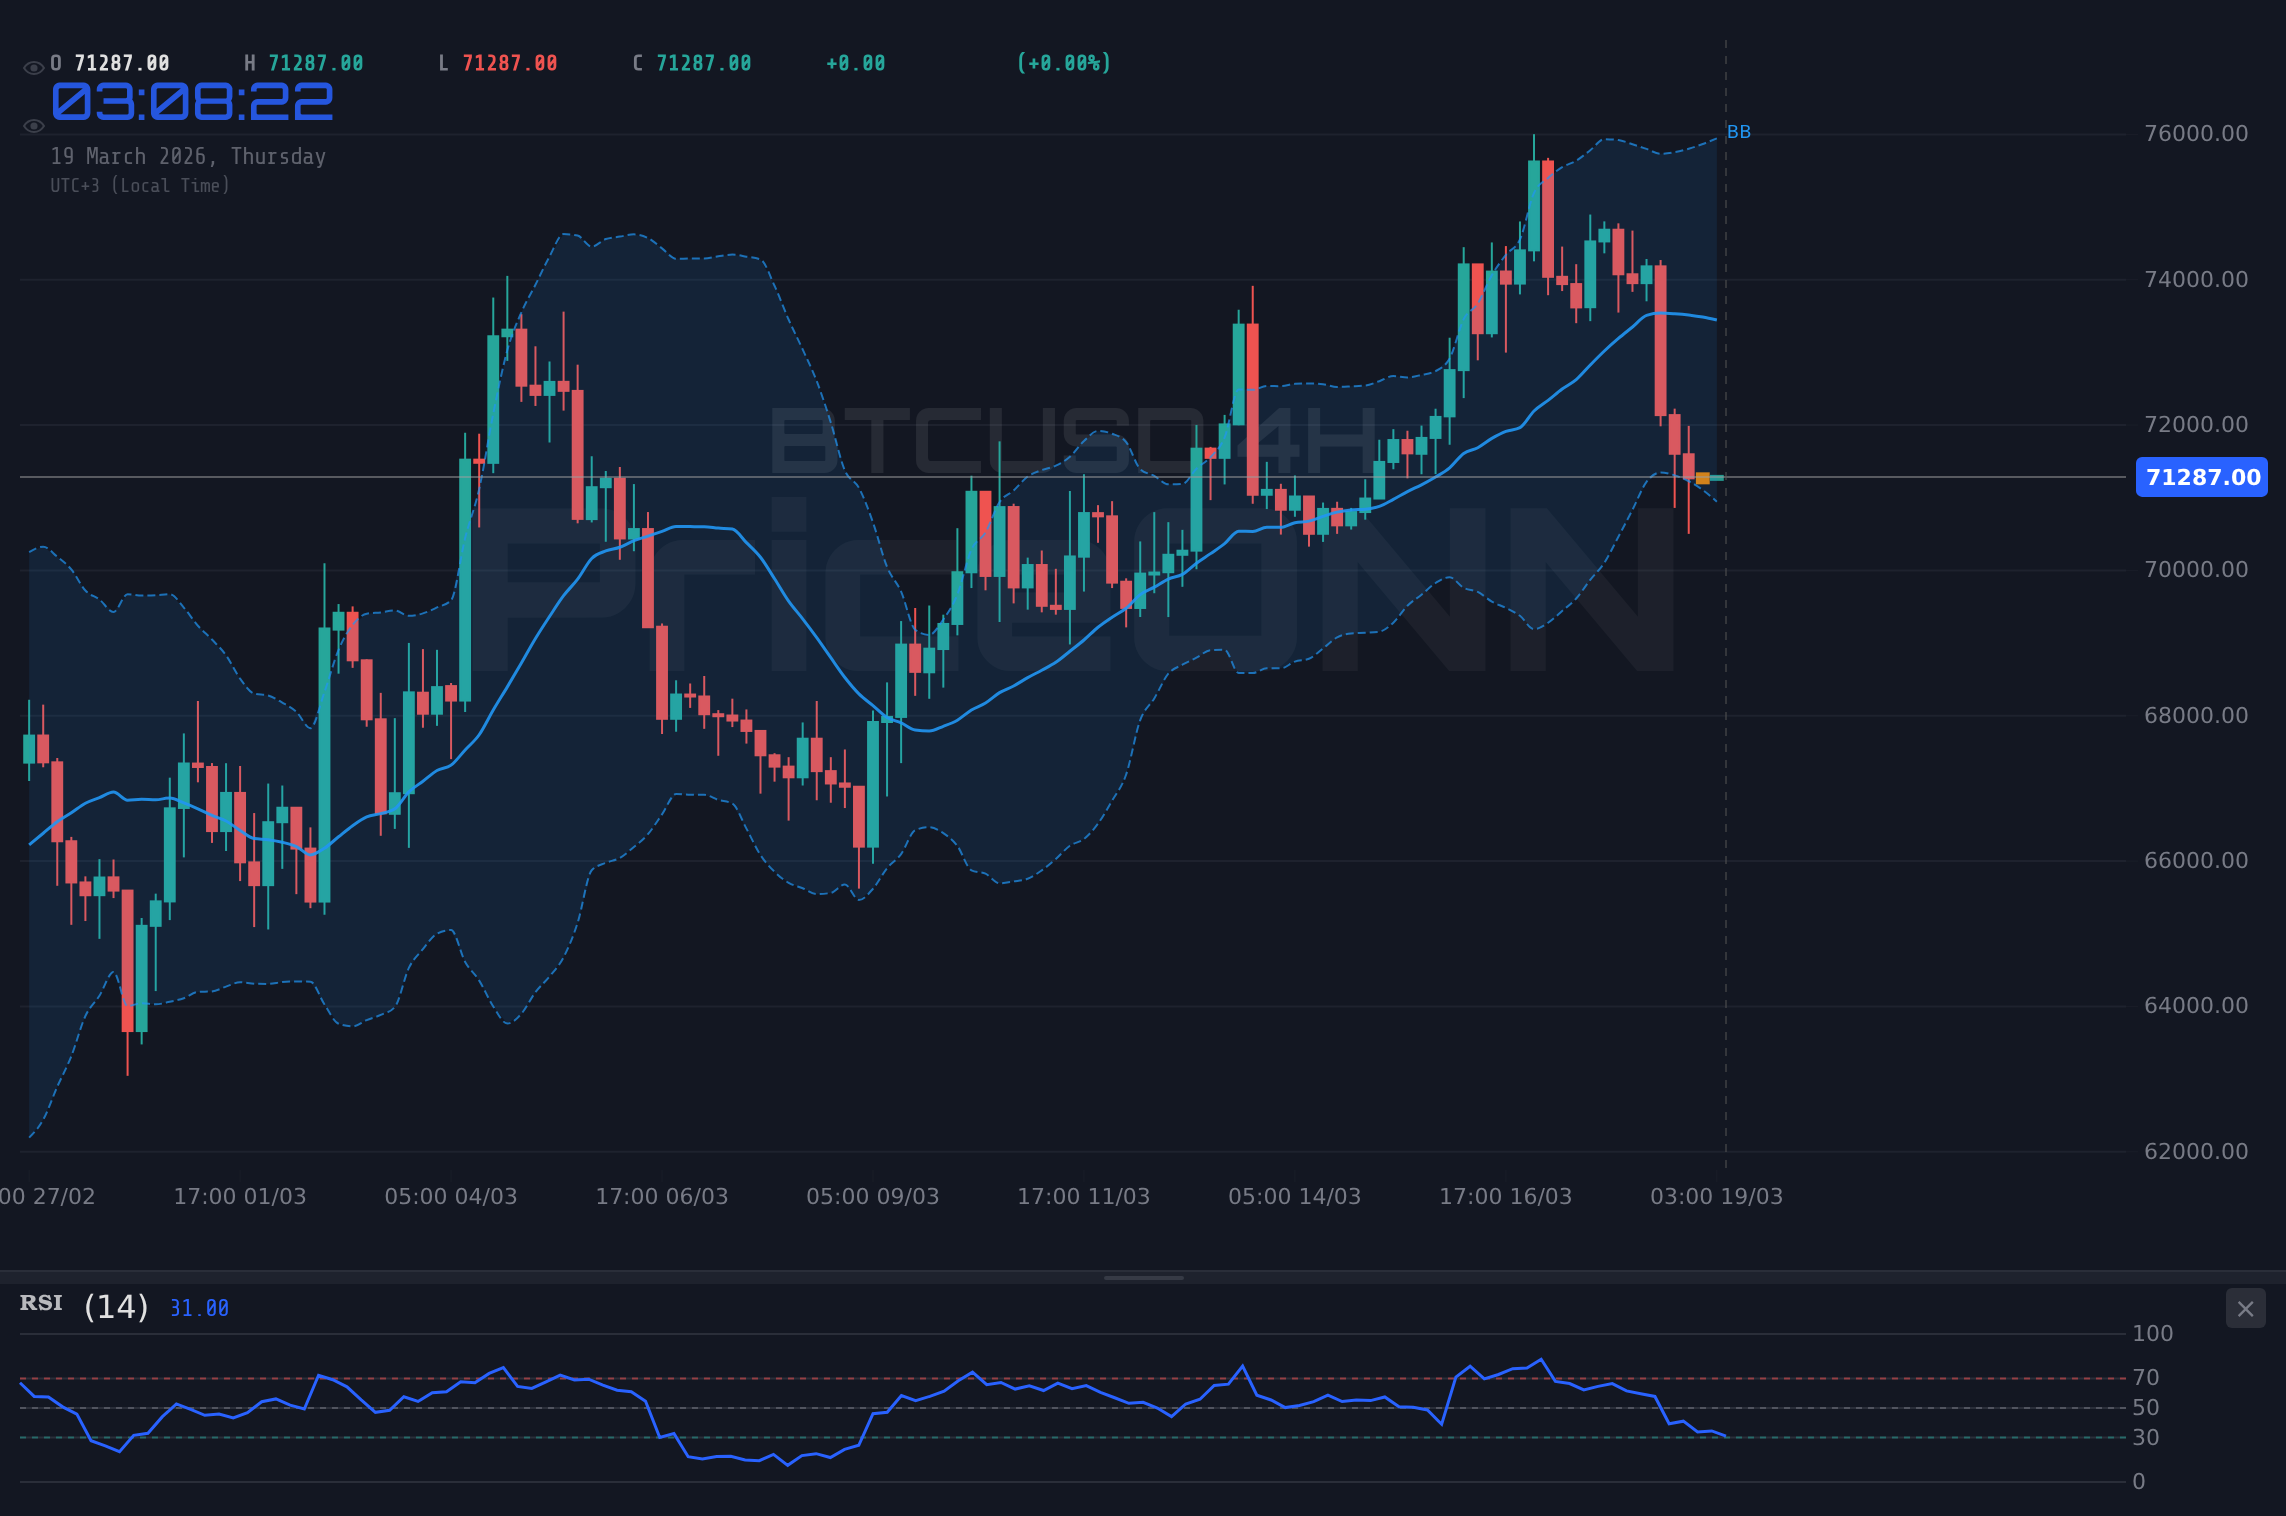
Against this turbulent macroeconomic backdrop, Bitcoin's technical picture offers a mixed, yet predominantly cautious, signal. On the 1-hour timeframe, BTCUSD is showing signs of bearish momentum. The Relative Strength Index (RSI) at 31.63 is in neutral territory but trending downwards, suggesting that while not yet oversold, the upward momentum is waning. The Moving Average Convergence Divergence (MACD) is exhibiting negative momentum, with the MACD line below its signal line, indicating selling pressure. Furthermore, the Average Directional Index (ADX) at 46.39 points to a strong downtrend on this shorter timeframe, underscoring the immediate selling pressure. The Bollinger Bands also show the price trading below the middle band, reinforcing this bearish inclination. While the Stochastic oscillator is attempting a rebound, showing %K above %D, its position in the oversold region and the prevailing downtrend suggest this might be a temporary technical bounce rather than a reversal. Zooming out to the 4-hour chart, the trend remains decidedly bearish, with a strong 100% power rating. The RSI at 24.6 is firmly in oversold territory, a condition that historically can precede a bounce, but in the context of a strong downtrend, it can also signal capitulation before further declines. The MACD continues to show negative momentum, and the ADX at a robust 51.36 confirms a very strong downtrend. The Bollinger Bands are hugging the lower band, indicating extreme selling pressure. The Stochastic indicator here shows %K below %D, reinforcing the bearish signal. The overall 'Sell' signal across multiple shorter-term timeframes suggests that the path of least resistance for Bitcoin, at least in the immediate intraday trading, is downwards. The current price of $71,256 is being tested, and the technical setup on these intraday charts does not inspire immediate confidence for bulls. This suggests that any upward moves may be met with significant selling pressure as traders react to the macro environment and the prevailing technical downtrends. On the daily timeframe, the picture becomes slightly less definitive but still leans cautious. The trend is neutral with 50% power, indicating a potential pause or consolidation before the next major move. The RSI at 40.16 is in neutral territory, inching closer to oversold but not quite there, and showing a downward tendency. The MACD remains in negative momentum territory, below its signal line. The Bollinger Bands are again below the middle band, suggesting downside pressure or consolidation below key resistance. The ADX at 14.48 signifies a weak trend, implying that the larger daily move might be consolidating rather than trending strongly, which can be a precursor to a breakout in either direction. However, the Stochastic indicator is showing a potential bullish crossover (%K above %D) in the oversold region, hinting at a possible short-term relief rally. Despite this potential daily divergence, the overwhelming 'Sell' signals from the 1-hour and 4-hour charts, coupled with the broader macroeconomic concerns, suggest that any upside in BTCUSD near $71,256 might be capped in the short term. The confluence of strong downtrend signals on shorter timeframes and the overarching macro-economic risks creates a strong case for caution.Navigating the Support and Resistance Levels
Understanding the key price levels is paramount for any trader looking to navigate this volatile market. On the 1-hour chart, immediate support is found at $4813.03, followed by $4791.74 and $4778.88. Resistance to the upside, however, is more immediately relevant given the current bearish technicals. The first resistance level to watch is $4847.18, followed by $4860.04 and $4881.33. A break above these levels would be required to invalidate the short-term bearish outlook. On the 4-hour chart, which shows a stronger downtrend, support lies at $4865.09, $4839.75, and $4822.93. Resistance levels on this timeframe are at $4907.25, $4924.07, and $4949.41. These levels are critical for assessing the potential downside targets if the selling pressure continues. The daily chart, offering a longer-term perspective, shows support at $4971.11, $4936.83, and $4900.23, with resistance overhead at $5041.99, $5078.59, and $5112.87. For Bitcoin, currently trading around $71,256, these levels are crucial. The immediate focus will be on whether the price can hold above the psychological $71,000 level. A decisive break below the 1-hour support at $4813.03 could signal further downside towards the 4-hour levels, while a move above the 1-hour resistance at $4847.18 would be the first sign of a potential technical pullback. The interplay between these levels and the prevailing macro sentiment will dictate the short-term direction. It's important to note that these are dynamic levels. The strong ADX readings across multiple timeframes, especially the 46.1 on 1H and 51.36 on 4H, indicate that a strong trend is in play, meaning price can move rapidly through these levels if momentum catches hold. The 'Sell' signals across the 1H and 4H timeframes further emphasize the immediate risk to the downside. Therefore, while the daily chart might show some oversold conditions or neutral trend strength, the intraday technicals and the macro environment suggest a bearish bias. Any sustained move above the daily resistance at $5041.99 would be needed to shift the broader outlook, but currently, that seems a distant prospect given the prevailing market conditions. The $71,256 price point is therefore a crucial area to watch, with immediate downside risks seeming more probable than significant upside.Correlation Analysis: DXY, Equities, and Oil's Influence
Understanding how Bitcoin interacts with other major markets is key to deciphering its price action. The DXY, or Dollar Index, currently at 99.95, is a significant influencer. Historically, a strengthening dollar often correlates with a weaker Bitcoin, as it signals global risk aversion and potentially tighter financial conditions. With the DXY showing upward momentum, this creates a headwind for BTCUSD. The recent surge in oil prices, with Brent at $109.87, further complicates this picture. Higher oil prices are often a proxy for rising inflation expectations and geopolitical risk, both factors that can lead investors to seek 'safer' assets like the dollar, thereby strengthening the DXY and pressuring Bitcoin. This creates a negative feedback loop: oil prices rise, inflation fears grow, the dollar strengthens, and risk assets like Bitcoin face selling pressure. Equities markets are also critical to watch. The sharp declines in the SP500 (down 1.45% to 6621.1) and Nasdaq100 (down 1.55% to 24415) clearly indicate a risk-off sentiment. Bitcoin, despite its diversification narrative, has often traded as a high-beta risk asset, meaning it tends to amplify the movements of the broader stock market, especially tech-heavy indices. When major indices fall sharply, it's common to see outflows from speculative assets, including cryptocurrencies. This correlation suggests that the current bearish pressure in equities is likely contributing to the selling seen in BTCUSD around $71,256. The confluence of a strengthening dollar, rising oil prices, and falling stock markets creates a challenging environment where Bitcoin's typical correlations are playing out negatively for its price. On the commodity front, the surge in oil prices isn't just about inflation; it's also about supply and demand dynamics, often exacerbated by geopolitical events. The conflict in the Middle East, as reported by sources like Reuters and Bloomberg, continues to be a major driver of oil price volatility. This instability fuels demand for the US dollar as a safe haven, further reinforcing the negative correlation with Bitcoin. It's a complex web of interconnected factors: geopolitical tensions lead to higher oil prices, which fuels inflation concerns, prompting a stronger dollar and a sell-off in risk assets like equities and, by extension, cryptocurrencies. The technical indicators on BTCUSD, such as the bearish MACD and high ADX readings on shorter timeframes, align with this macro picture, suggesting that the downward pressure is likely to persist until these macro conditions stabilize or shift significantly. The $71,256 price level is therefore being tested under significant adverse conditions. Furthermore, the anticipation of central bank responses adds another layer of complexity. If the Federal Reserve signals a more hawkish stance in response to the sticky inflation data (hot PPI and rising oil), it could further strengthen the dollar and increase borrowing costs, making it even harder for Bitcoin to find upward momentum. The market is essentially pricing in a scenario where rate cuts might be delayed or even off the table in the short term, a narrative that is generally bearish for speculative assets. The technical signals on BTCUSD, such as the RSI nearing oversold territory on the daily chart (40.16) but still showing strong downtrends on intraday charts (31.63 on 1H), reflect this indecision and uncertainty. Traders are caught between the potential for a technical bounce and the overwhelming macro risks.Crypto-Specific Fundamentals Under Pressure
While macro factors are currently dominating the narrative, it's essential to consider how these broader pressures are impacting the cryptocurrency ecosystem itself. On-chain metrics can provide valuable insights, but they are currently overshadowed by the macro storm. For instance, active addresses and transaction volumes, while important indicators of network health, may see reduced activity if broader market sentiment remains risk-averse. Institutional adoption trends, which have been a significant driver of Bitcoin's price appreciation, could also slow down if market volatility remains high and regulatory clarity is lacking. The recent surge in oil prices and the resulting inflation fears could indirectly impact the crypto market by influencing central bank policy, which in turn affects liquidity available for speculative investments. Developments within the DeFi and NFT ecosystems are also relevant, though their immediate impact on BTCUSD's price might be muted in the current environment. A general downturn in risk appetite can lead to reduced investment in newer, more speculative areas of crypto. Furthermore, regulatory news, which has been a constant factor in the crypto space, continues to play a role. Any unfavorable regulatory developments could exacerbate selling pressure, especially when coupled with the existing macro headwinds. Bitcoin's dominance, a measure of its market share relative to other cryptocurrencies, often increases during periods of uncertainty as investors flock to the perceived 'safest' digital asset. However, even Bitcoin dominance can be challenged if the overall crypto market experiences a significant sell-off driven by external factors. The current technical picture for BTCUSD, with its 1H and 4H charts showing strong bearish signals (ADX readings above 40), suggests that these crypto-specific fundamentals might not be enough to counteract the macro pressures in the short term. While the daily chart shows some neutral to bullish signals (RSI at 51.25, Stochastic showing a bullish crossover), the overwhelming intraday weakness and the correlation with falling equities and a strengthening dollar indicate that immediate downside risks remain elevated. The price point of $71,256 is a crucial psychological level, and a break below it could trigger further liquidations. The market is watching closely to see if any positive crypto-native news or developments can emerge to provide a counter-narrative, but for now, the macro environment appears to be the primary driver. The correlation between altcoins and Bitcoin is also worth noting. When BTCUSD faces significant selling pressure, especially due to macro factors, it often pulls the entire altcoin market down with it. This means that even if specific altcoins have positive developments, their price action may be dictated by Bitcoin's broader trend. The current 'Sell' signals across many altcoins like ETHUSD (4H RSI at 45.13, ADX 43.07) and BTCUSD's own intraday technicals reinforce this interconnectedness. The market is collectively vulnerable to the macro storm, and any significant shift in the DXY or equity markets will likely be mirrored in the crypto space. Patience and risk management are therefore paramount for anyone involved in digital assets right now, as the $71,256 level is being tested under extreme external pressure.Trade Scenarios: Navigating the Uncertainty Around $71,256
Given the current confluence of bearish macro factors and mixed technical signals, the path forward for BTCUSD presents several potential scenarios. The prevailing sentiment leans towards caution, with the high probability resting on continued volatility or a downside continuation, especially in the short term. The key price level to watch remains around the current $71,256 mark, with immediate support and resistance levels dictating the short-term direction.Bearish Scenario: Downside Continuation
65% ProbabilityNeutral Scenario: Consolidation Phase
25% ProbabilityBullish Scenario: Technical Bounce Amidst Macro Fears
10% ProbabilityFrequently Asked Questions: BTCUSD Analysis
What happens if BTCUSD breaks below $71,000 support amid current macro pressures?
A break below the $71,000 psychological support level, especially given the strong bearish technicals on shorter timeframes (like the 1H ADX at 46.39), could trigger further downside. This scenario would likely lead to targets around $70,000 and potentially the 4H support at $69,535 as selling pressure accelerates.
Should I consider buying BTCUSD near $71,256 given the oversold RSI on the daily chart?
While the daily RSI at 40.16 is approaching oversold territory, the immediate bearish signals on the 1H and 4H charts (RSI 31.63 and 24.6 respectively) suggest caution. A high-probability setup would require confirmation, such as a sustained break above $72,500 resistance alongside a weakening DXY, before considering a buy-side entry.
Is the current ADX reading of 46.39 on BTCUSD a strong sell signal?
An ADX reading of 46.39 on the 1-hour timeframe indicates a strong existing trend, and in this context, it reinforces the bearish momentum observed. While not a standalone sell signal, it suggests that the current downward move has significant strength and any counter-trend rallies may face strong resistance.
How will rising oil prices ($109.87 Brent) and hot PPI data affect BTCUSD this week?
Rising oil prices and hot PPI data fuel inflation concerns, potentially leading to a 'higher for longer' interest rate narrative from the Fed. This macro environment typically strengthens the US Dollar (currently at 99.95) and pressures risk assets like BTCUSD, making a downside continuation more probable around the $71,256 level this week.
Track markets in real-time
AI-powered analysis, technical indicators and real-time price data.
Join Our Telegram Channel
Breaking market news, AI analysis and trading signals instantly.
Join Channel