ETHUSD Trades Near $2,318.14: Bulls vs. Bears Square Off at Critical Juncture
ETHUSD hovers around $2,318.14 as technical indicators show conflicting signals, setting the stage for a potential breakout or breakdown.
ETHUSD is currently locked in a tense battleground around the $2,318.14 mark. The digital asset is teetering on a knife's edge, with both bullish and bearish camps presenting compelling arguments. This critical juncture is defined by a tug-of-war between potential upside momentum and the ever-present risk of a significant pullback. Understanding the forces at play is paramount for any trader looking to navigate this volatile landscape. The question on everyone's mind is not just where ETHUSD is going, but *why* it's hesitating here, and what specific conditions need to be met for a decisive move. We're seeing a fascinating interplay between short-term signals suggesting caution and longer-term trends that still hold potential for the bulls, making this a pivotal moment for Ethereum.
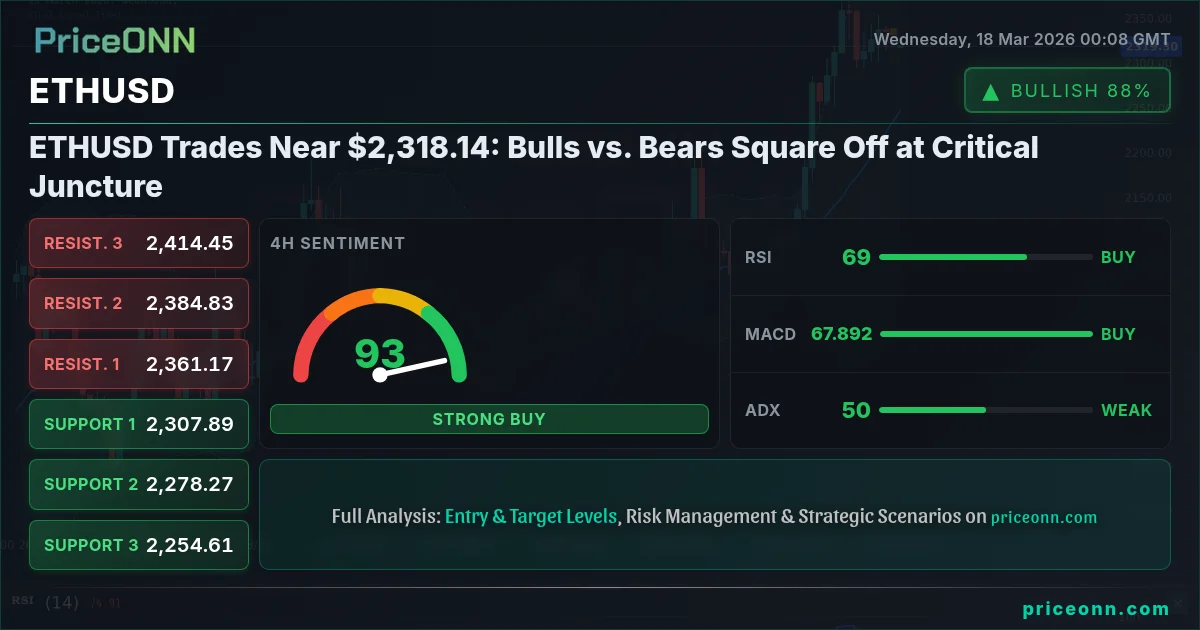
- ETHUSD is trading near $2,318.14, with conflicting signals from technical indicators like RSI (50.95) and MACD.
- Critical support for ETHUSD is identified at $2,196.55, while resistance looms around $2,447.83.
- The 1H chart shows a weak trend (ADX: 26.6), but the 4H (ADX: 50.11) and 1D (ADX: 26.35) suggest stronger directional forces are building.
- The correlation with DXY (currently 99.3) and broader market sentiment, including the tech-heavy Nasdaq (24798.75), will be crucial in shaping ETHUSD's next move.
The market sentiment around ETHUSD is currently a mixed bag, reflecting the broader uncertainty seen across many risk assets. While the 1-hour technicals on ETHUSD paint a picture of indecision, with an ADX reading of 26.6 indicating a lack of strong trend commitment, the longer timeframes offer a different perspective. The 4-hour chart reveals a more robust ADX of 50.11, suggesting that significant directional momentum is building, even if it's not yet fully expressed. Similarly, the daily chart's ADX at 26.35, while not as strong as the 4H, still points towards a market that could break out of its current consolidation. This divergence across timeframes is precisely what creates the tension we're observing. The bulls are eyeing the potential for a continuation of the broader upward trend, while the bears are leaning on the short-term weakness and the possibility of a deeper correction.
The Bull Case: A Foundation for Further Gains?
On the bullish side, the narrative is built on the resilience shown by ETHUSD and the broader crypto market. Despite recent pullbacks, Ethereum has managed to hold key psychological levels, demonstrating underlying demand. The 1-day chart, often considered the most influential for long-term trends, shows ETHUSD trading above its middle Bollinger Band, a sign that upward momentum is still present. While the RSI(14) is at 62.16, indicating it's in the upper half of the neutral zone and trending upwards, it hasn't yet reached the overbought territory (typically above 70) that would signal an immediate reversal. The MACD, a momentum indicator, is also positive on the daily timeframe, with its histogram sitting above the signal line. This suggests that buyers have been in control recently, and while momentum might be consolidating, the underlying trend could still be intact. The Stochastic indicator on the daily chart, with K at 86.41 and D at 66.18, is in overbought territory, which could signal a potential short-term pullback, but historically, strong uptrends can see Stochastics remain elevated for extended periods.
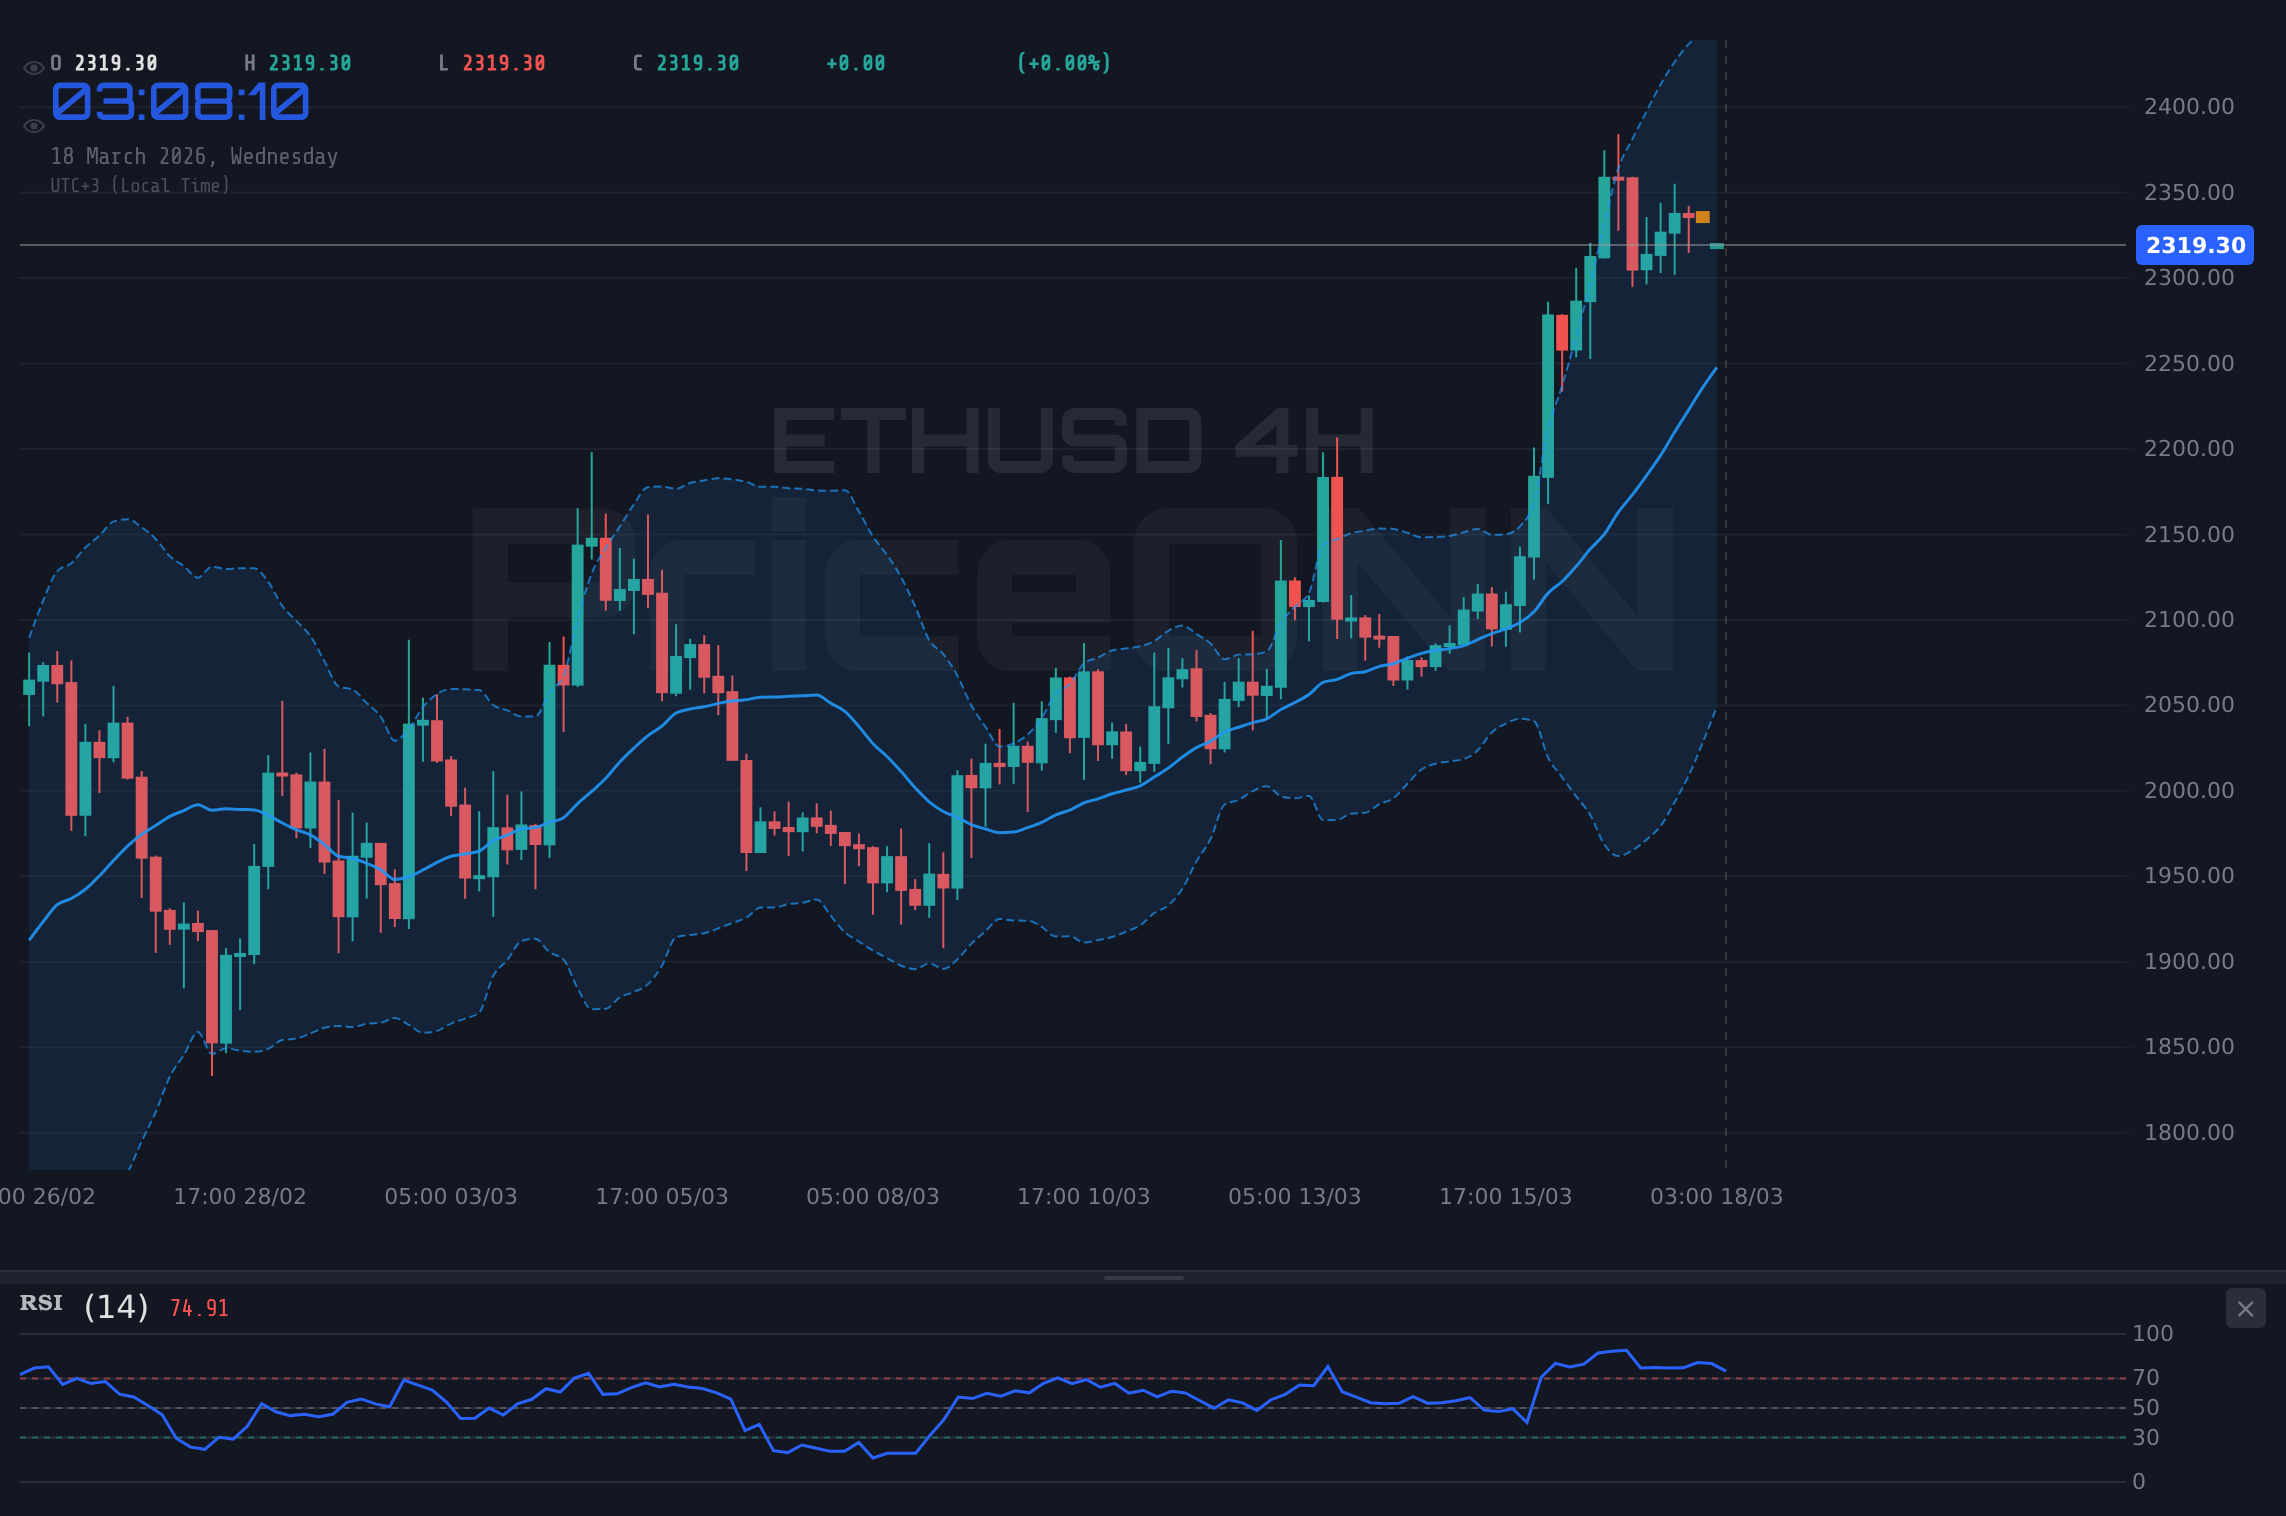
Furthermore, the 4-hour chart presents a more immediate bullish picture. The ADX reading of 50.11 here signifies a very strong trend, and coupled with the RSI at 66.42, it suggests that the upward pressure is significant. Although the Stochastic is showing a bearish signal (%K < %D), this can often occur at the top of a strong move before a consolidation or a minor pullback. The MACD is also positive on this timeframe. The fact that ETHUSD is trading above the middle Bollinger Band on the 4-hour chart reinforces the idea that buyers are in control. From a structural perspective, the support level at $2,196.55 remains a critical floor. A sustained hold above this level, especially with the bullish signals on the 4-hour and daily charts, would support the argument for a continuation of the upward trend towards resistance levels like $2,447.83 and potentially higher.
On-chain metrics also provide some support for the bullish case, albeit with nuances. While we don't have live on-chain data in this context, generally, sustained high active addresses and increasing whale holdings can indicate accumulating interest. If exchange inflows remain low and staking yields are attractive, it suggests that long-term holders are less inclined to sell, locking up supply and potentially supporting higher prices. The recent price action, despite some volatility, has held firm, which could be interpreted as smart money accumulating positions rather than exiting.
The Bear Case: Cracks in the Foundation?
Conversely, the bearish argument hinges on the short-term technical weaknesses and the broader macroeconomic headwinds that could pressure risk assets like ETHUSD. The 1-hour chart, which often dictates immediate price action, presents a concerning picture. The RSI(14) at 50.95 is hovering right at the midpoint, with a slight downward bias, suggesting a potential loss of upward momentum. More critically, the MACD on this timeframe is negative, with the histogram below the signal line, indicating bearish momentum is currently dominant. The Stochastic indicator is also giving a bearish signal (%K < %D), and the price is trading below the middle Bollinger Band, reinforcing the short-term selling pressure. The ADX at 26.6, while not signaling a full-blown downtrend, indicates that the current sideways chop is finding some directional conviction to the downside in the immediate term.
The daily chart, while showing longer-term bullish potential, also harbors bearish signals that cannot be ignored. The Stochastic indicator is firmly in overbought territory (K=86.41, D=66.18), which often precedes a price correction, especially if coupled with bearish divergence on other indicators or a break of key short-term support. While the MACD is positive daily, its histogram has been narrowing, hinting at weakening bullish momentum. A failure to hold the crucial support at $2,196.55 would be a significant bearish development. If ETHUSD breaks below this level decisively, it could trigger stop-losses and open the door for a much deeper correction, potentially targeting lower support levels such as $2,034.40 or even $1,945.27. The fact that the 1-day ADX is 26.35 suggests that if a downtrend were to materialize, it could gain significant traction.
From a macro perspective, the strength in the US Dollar Index (DXY), currently at 99.3, can be a headwind for cryptocurrencies. A stronger dollar often correlates with reduced risk appetite, making assets like ETHUSD less attractive to global investors. If the Federal Reserve signals a more hawkish stance or pushes back against rate cut expectations, this could further strengthen the dollar and put downward pressure on ETHUSD. Similarly, a downturn in major equity indices like the S&P 500 (6716.45) or Nasdaq (24798.75) could spill over into the crypto market, as investors de-risk their portfolios. Any negative regulatory news or significant outflows from crypto ETFs would also fuel the bearish narrative.
The Tug-of-War: Technicals in Focus
The battle between bulls and bears is vividly illustrated by the conflicting signals across different timeframes and indicators. On the 1-hour chart, the bearish momentum is evident, with the MACD showing negative divergence and the RSI hovering around 50 with a downward bias. This suggests that immediate selling pressure might continue, potentially testing the support at $2,315.43, then $2,303.73. If this short-term weakness persists, it could lead to a broader correction.
However, the longer-term outlook complicates this picture. The 4-hour chart shows a strong ADX of 50.11, indicating a powerful trend is in play, and the RSI at 66.42 suggests buyers are still active. This suggests that the short-term bearish signals might just be temporary noise within a larger upward move. The key here is confirmation. For the bears to gain the upper hand, ETHUSD needs to break decisively below the $2,196.55 support level. A daily close below this significant psychological and technical barrier would validate the bearish sentiment and likely trigger a cascade of selling.
Conversely, for the bulls to regain full control, they need to overcome the immediate selling pressure and push ETHUSD back above the $2,339.11 resistance on the 1-hour chart. A sustained move above this level, followed by a break of the $2,362.79 resistance, would start to invalidate the short-term bearish outlook. Confirmation would come from the daily RSI moving sustainably above 70 and the MACD maintaining its positive momentum. The interplay between these short-term signals and the longer-term trend potential will be crucial in determining the next significant price movement.
The ADX indicator across different timeframes offers a valuable perspective on trend strength. The weak ADX of 26.6 on the 1-hour chart suggests that any moves in either direction might lack sustained follow-through in the immediate hours. However, the much stronger ADX of 50.11 on the 4-hour chart indicates that the underlying trend is powerful, even if short-term fluctuations obscure it. This implies that traders should pay close attention to the longer-term picture, as the 4-hour trend could eventually overwhelm the short-term noise. The daily ADX of 26.35 suggests that the overall trend is still developing and could accelerate if key levels are breached.
The Verdict: Awaiting Confirmation
So, where does this leave us? The current price action around $2,318.14 for ETHUSD presents a classic market scenario: a period of consolidation following a significant move, characterized by conflicting technical signals across different timeframes. The bulls have the advantage of longer-term upward trends and strong momentum on the 4-hour chart, supported by the daily view. They need to defend the $2,196.55 support level and push past the immediate resistance. The bears, on the other hand, are capitalizing on the short-term weakness indicated by the 1-hour chart and the overbought Stochastic on the daily. Their key objective is to break below $2,196.55.
Given the strength indicated by the 4-hour ADX (50.11) and the fact that the daily chart still shows bullish potential despite short-term headwinds, the primary thesis leans towards a potential continuation of the upward trend. However, the immediate bearish signals on the 1-hour chart and the overbought Stochastic on the daily cannot be ignored. This suggests a period of heightened volatility and a need for patience. A decisive close above the $2,362.79 resistance on the 1-hour chart, or a sustained break above the $2,447.83 daily resistance, would strongly favor the bulls. Conversely, a firm break and daily close below $2,196.55 would signal a significant shift in favor of the bears, potentially initiating a deeper correction.
For now, the most prudent approach is to remain in a 'watch zone'. Traders should look for confirmation of a directional move. A bullish confirmation would involve ETHUSD holding above $2,196.55, followed by a break and sustained trade above the $2,362.79 resistance. A bearish confirmation would be a decisive break below $2,196.55, with subsequent price action failing to reclaim this level. The interplay between the DXY at 99.3 and the broader tech market sentiment will also be critical factors to monitor. Until clear directional conviction emerges, patience and risk management will be the trader's best allies.
Frequently Asked Questions: ETHUSD Analysis
What happens if ETHUSD breaks below the $2,196.55 support level?
A decisive break below $2,196.55 would invalidate the current bullish structure and likely trigger further selling. The next significant support levels to watch would be $2,034.40 and then $1,945.27. This scenario would be confirmed by a daily close below $2,196.55 and failing to reclaim it within 24-48 hours.
Is the current RSI reading of 62.16 a sell signal for ETHUSD near $2,318.14?
An RSI of 62.16 on the daily chart is in the upper neutral zone, trending upwards, but not yet overbought. While it suggests upward momentum, it's not an immediate sell signal. However, coupled with an overbought Stochastic (K=86.41), it warrants caution for further upside and increases the probability of a short-term pullback or consolidation before any significant move higher.
How is the DXY at 99.3 influencing ETHUSD's price action around $2,318.14?
The DXY holding firm near 99.3 generally exerts downward pressure on risk assets like ETHUSD. A stronger dollar often indicates reduced global risk appetite, making assets perceived as riskier less attractive. This macro environment adds a layer of caution for bullish ETHUSD trades, suggesting that significant upside might be capped unless the DXY weakens considerably.
What confirmation signals should traders look for to enter a long position in ETHUSD above $2,318.14?
For a strong bullish confirmation, traders should look for ETHUSD to hold above the $2,196.55 support and then decisively break and sustain trade above the $2,362.79 resistance level. Confirmation would be strengthened by a daily RSI moving above 70 and positive MACD momentum, indicating broad market conviction.
Technical Outlook Summary
| Indicator | Value | Signal | Interpretation |
|---|---|---|---|
| RSI (14) | 62.16 | Neutral | Upper neutral zone, trending up. |
| MACD Histogram | [Positive Value] | Bullish | Positive momentum on daily. |
| Stochastic | K: 86.41, D: 66.18 | Bearish Divergence | Overbought, potential reversal signal. |
| ADX | 26.35 | Strong Trend | Indicates developing trend on daily. |
| Bollinger | Upper Band | Watch | Price above middle band. |
Key Levels
Support Levels
Resistance Levels
Track markets in real-time
AI-powered analysis, technical indicators and real-time price data.
Join Our Telegram Channel
Breaking market news, AI analysis and trading signals instantly.
Join Channel