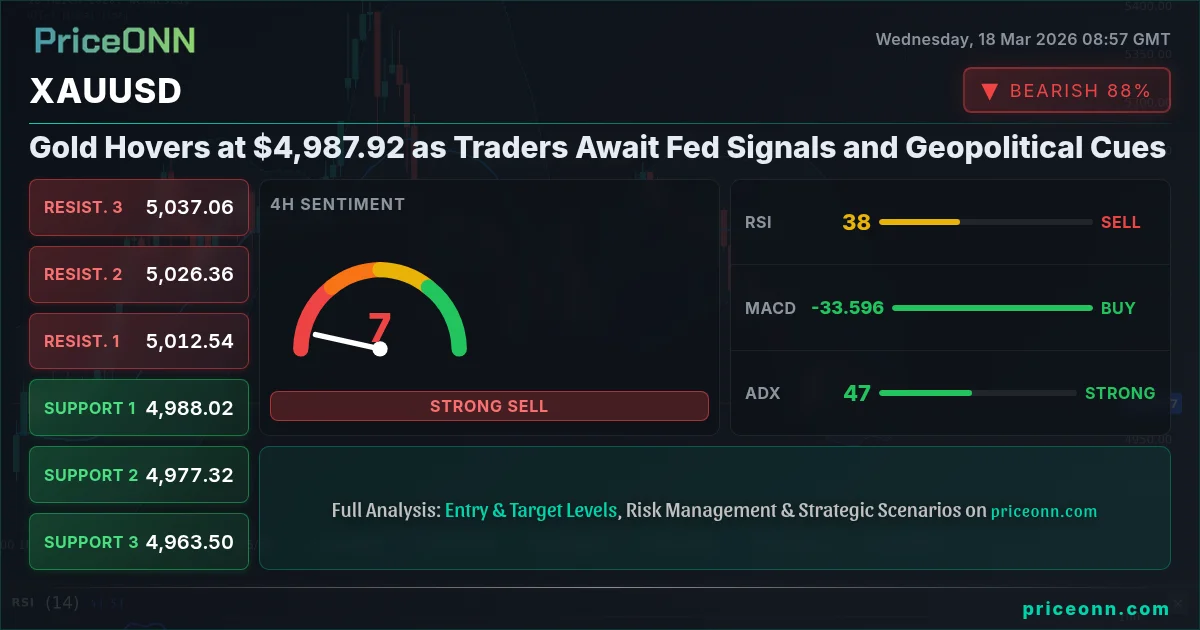
Gold Hovers at $4,987.92 as Traders Await Fed Signals and Geopolitical Cues
XAUUSD holds steady near $4,987.92. Traders are cautious ahead of the Fed meeting, with geopolitical tensions adding a layer of uncertainty to the gold price outlook.
Navigating the Golden Calm: XAUUSD at $4,987.92 Amid Central Bank Scrutiny
Gold prices are currently treading water around the $4,987.92 mark, a period of relative calm that belies the significant crosscurrents shaping the market. As traders and investors brace for crucial central bank communications this week, particularly from the Federal Reserve, the precious metal finds itself at a critical juncture. While the immediate price action shows little conviction, the underlying drivers - from inflation expectations and geopolitical risks to the strength of the US dollar - are creating a complex tapestry that demands careful analysis. The current stalemate, however, is unlikely to persist indefinitely, and the signals emerging from both the macroeconomic landscape and technical charts will be key to deciphering gold's next move.
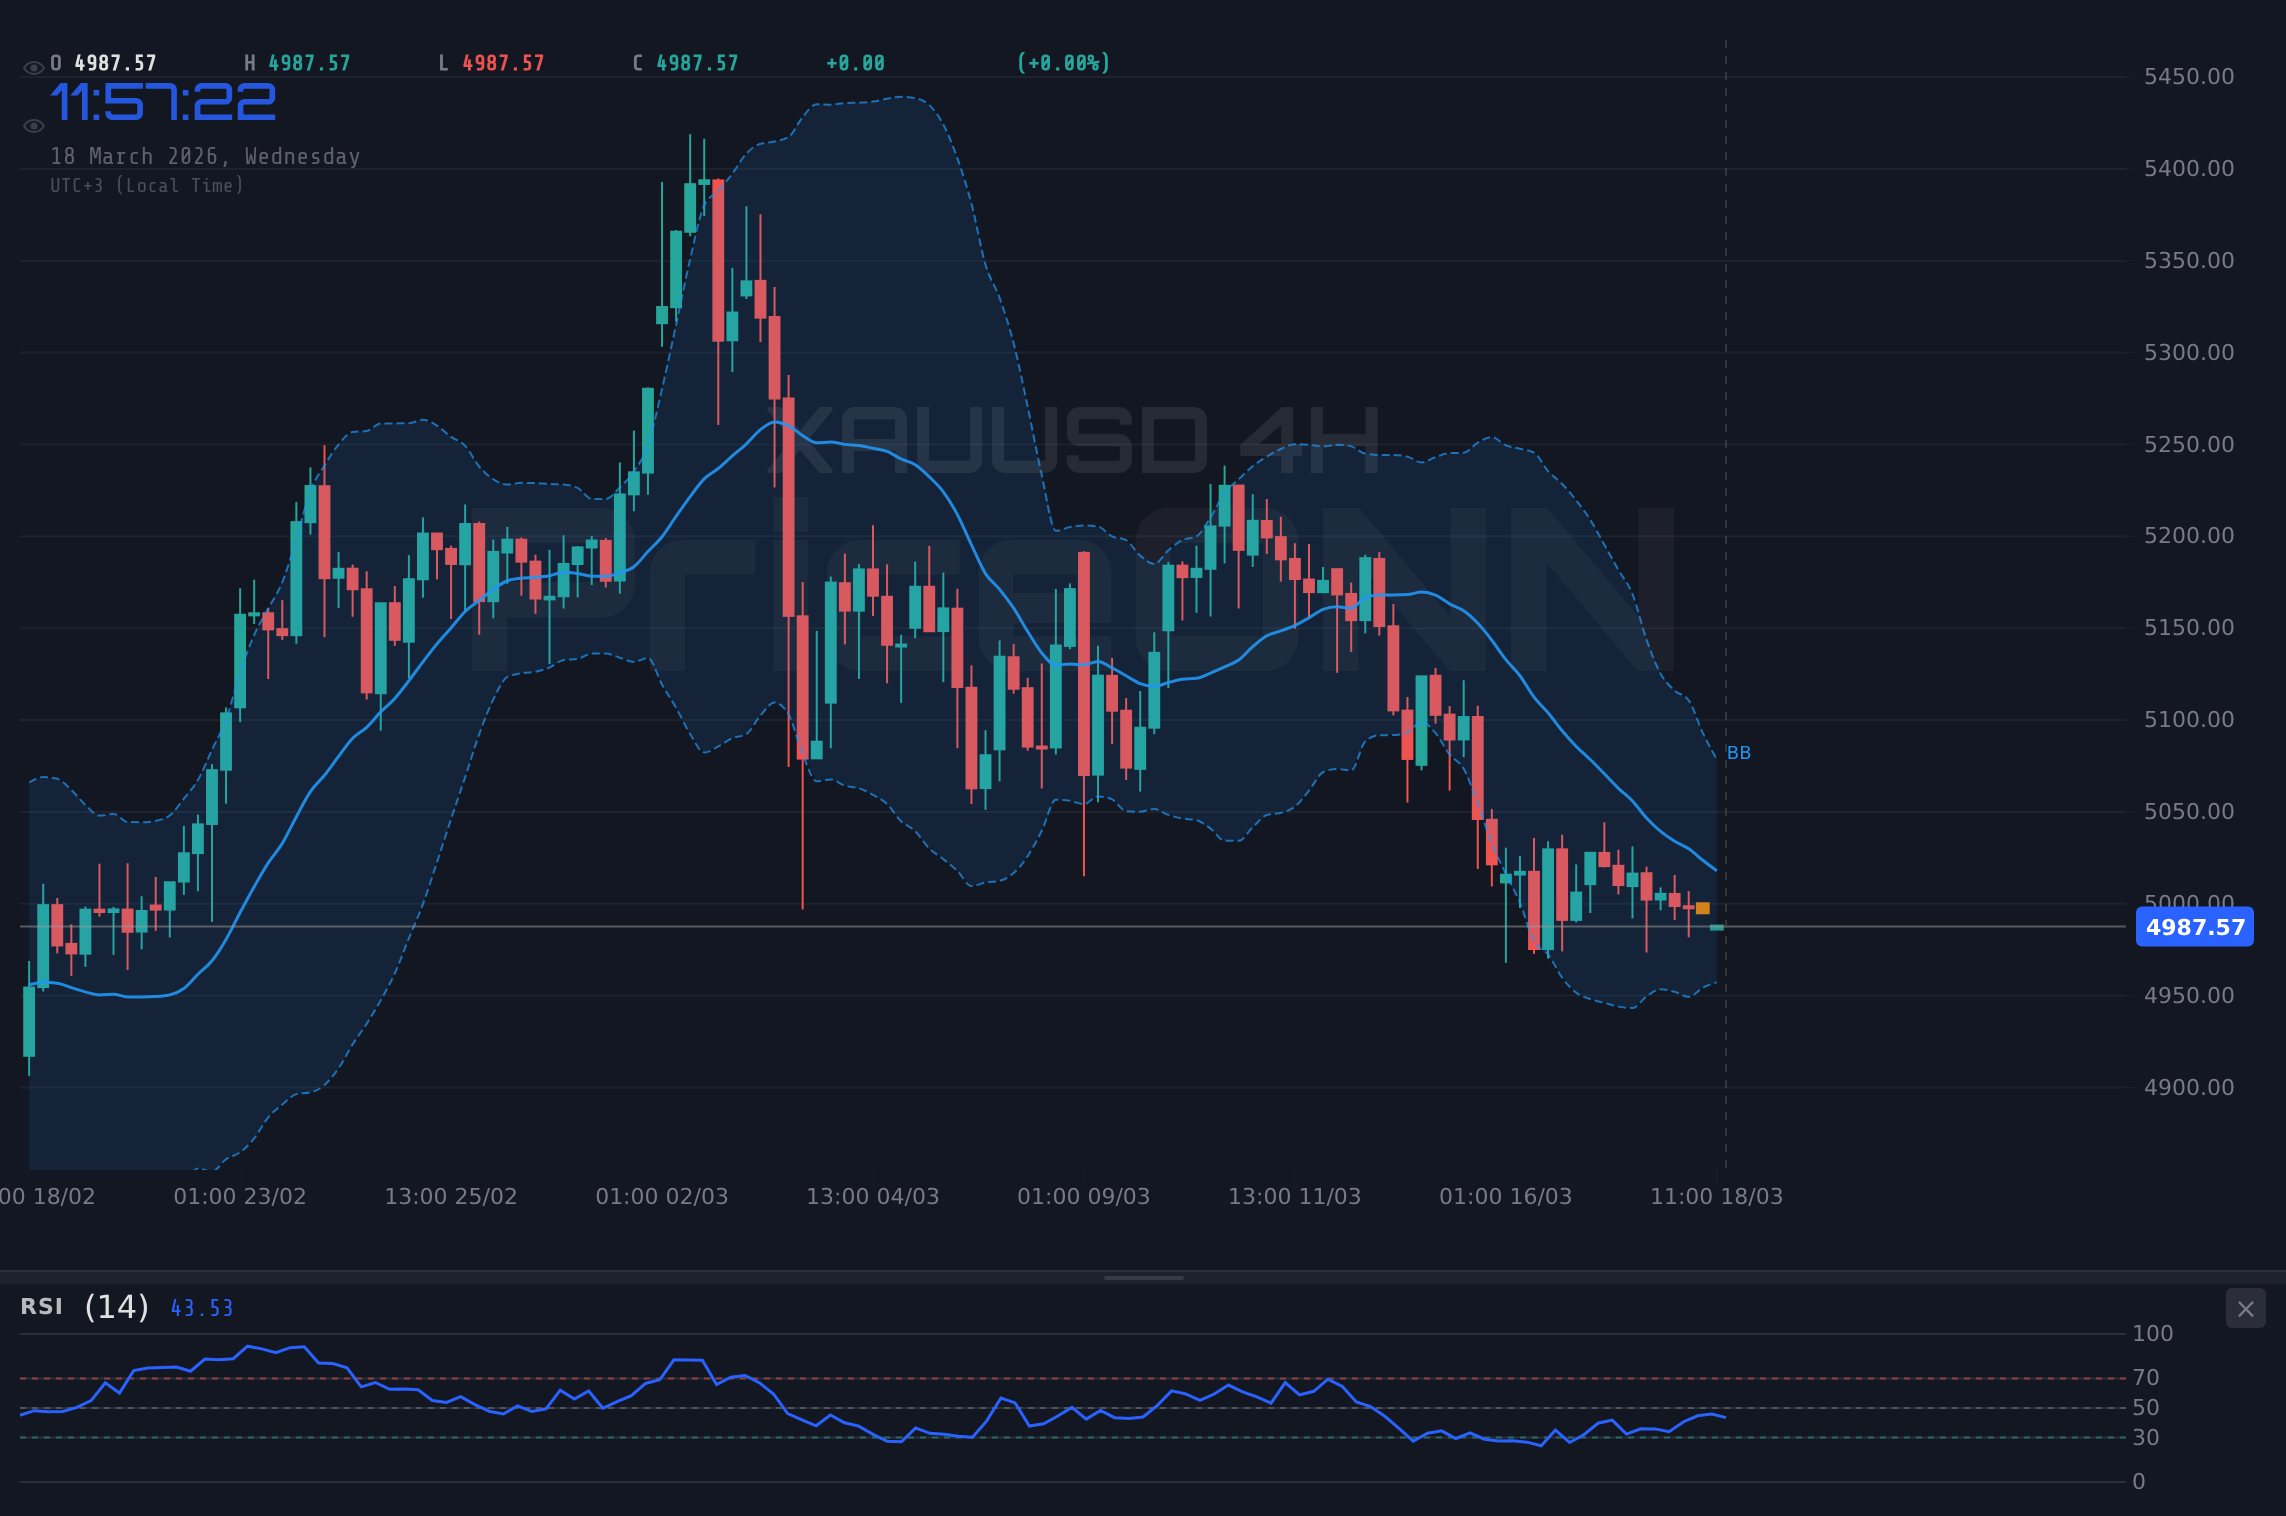
- XAUUSD is trading at $4,987.92, with a daily change of -0.35%, indicating downward pressure.
- The 1-hour RSI at 42.5 suggests a neutral stance with a slight bearish lean, while the 4-hour RSI at 37.6 reinforces this cautious sentiment.
- Key support for XAUUSD is identified at $4,987.11, with resistance looming at $5,018.16 on the 1-hour timeframe.
- The US Dollar Index (DXY) is currently at 99.37, showing strength that typically pressures gold prices.
- Geopolitical tensions and persistent inflation fears continue to underpin gold's safe-haven appeal, creating a floor beneath current levels.
The Fed's Shadow Looms Large
The primary catalyst currently dictating market sentiment, and by extension gold's price action, is the anticipation surrounding the Federal Reserve's upcoming monetary policy decision. In an environment where inflation remains a persistent concern, albeit with some signs of moderation, the Fed's forward guidance on interest rates is paramount. Market participants are keenly dissecting every utterance from Fed officials, searching for clues about the timing and pace of potential rate cuts. The prevailing expectation, according to CME FedWatch data, is that the Fed will maintain its current interest rate stance, but the accompanying statement and economic projections will be scrutinized for any hints of a shift in their 'higher for longer' narrative or a more dovish pivot. Any indication that the Fed is leaning towards earlier or more aggressive rate cuts could weaken the US dollar and, consequently, provide a tailwind for gold. Conversely, a more hawkish tone, emphasizing sticky inflation and a slower path to easing, would likely bolster the dollar and weigh on the precious metal.
Geopolitical Tremors and Their Impact on Gold
Beyond the Fed's policy considerations, the global geopolitical chessboard remains a significant factor influencing gold's safe-haven appeal. Escalating tensions in the Middle East continue to be a primary concern, with the potential for supply disruptions in the energy markets acting as a background driver for inflation and, by extension, for gold. While specific news regarding the Strait of Hormuz or direct conflicts may not be immediately impacting gold prices today, the underlying risk premium associated with these regions is a constant. Similarly, ongoing trade uncertainties, whether between major economic blocs or specific bilateral relationships, can spur demand for assets perceived as safe havens. The market is constantly weighing these geopolitical risks against the immediate economic data. For instance, while WTI crude oil saw a notable surge earlier this week amid geopolitical escalations, its subsequent slide to $94.35, coupled with a build in US oil inventories, suggests that immediate supply fears may be temporarily subsiding, though the risk premium remains embedded. This dynamic creates a complex environment where gold can simultaneously benefit from safe-haven demand and face headwinds from a strengthening dollar or easing inflation concerns.
Dollar Strength as a Headwind for Gold
The interplay between gold and the US Dollar Index (DXY) is a well-established correlation, and currently, the dollar is showing signs of renewed strength, trading at 99.37. A stronger dollar generally makes commodities priced in the greenback, like gold, more expensive for holders of other currencies. This can dampen international demand and put downward pressure on prices. The DXY's upward momentum, reflected in its 1H and 1D timeframes showing a strong trend, suggests that the greenback is finding favor, potentially due to a combination of relative economic outperformance, higher-than-expected US yields, or the aforementioned geopolitical risk aversion driving flows into dollar-denominated assets. The 1-hour chart shows the DXY at 99.37, with resistance at 99.37, indicating it's pushing towards a key level. If the dollar continues to strengthen, it will pose a significant challenge for gold bulls aiming to push prices significantly higher. Conversely, any weakness in the DXY, perhaps triggered by a dovish shift from the Fed or a de-escalation of geopolitical tensions, would likely be a green light for gold.
Technical Picture: A Mixed Signal at $4,987.92
Looking at the technical indicators, XAUUSD presents a somewhat mixed, yet predominantly cautious, picture. On the 1-hour timeframe, the trend is identified as bearish with a strength of 87%, supported by an RSI(14) of 42.5, which sits in neutral territory but leans towards a bearish sentiment. The MACD is showing negative momentum, with the MACD line below its signal line, further reinforcing the short-term downside bias. However, the Stochastic Oscillator offers a counter-signal, with K at 48.1 and D at 31.34, suggesting a potential for upward movement as %K is above %D. This divergence highlights the indecision in the market. On the 4-hour chart, the bearish trend strength jumps to 98%, with RSI at 37.6, indicating more pronounced selling pressure. Here, the Stochastic oscillator (%K=34.56, %D=49.24) clearly signals a downtrend. The daily chart, however, paints a neutral picture with a trend strength of 50%, RSI at 46.24, and a notably weak ADX of 13.43, suggesting a lack of a defined trend and potential for consolidation. This confluence of indicators, particularly the conflicting signals between RSI and Stochastic on the shorter timeframes and the overall neutral daily trend, suggests that price action around the $4,987.92 level is currently range-bound, awaiting a catalyst to break the stalemate.
The Role of Silver and Broader Commodities
While gold commands the spotlight, the performance of other precious metals, particularly silver (XAGUSD), provides valuable context. Silver is currently trading around $79.38, showing a slight daily gain of 0.17%. However, its technical indicators across multiple timeframes (1H, 4H, 1D) are predominantly signalling 'SELL', with a strong bearish trend indicated on the 4H chart (ADX 42.63). This divergence between gold's neutral-to-slightly-bearish stance and silver's more decisively bearish technicals could suggest that industrial demand factors, which often influence silver more directly, are weighing on the white metal. The commodity complex as a whole is also showing mixed signals. Brent crude is at $103.05, showing a downward trend on the 1H chart, while WTI is at $94.35, also indicating a bearish bias on the 1H. These movements in energy markets, often sensitive to geopolitical risks and global demand forecasts, can indirectly influence inflation expectations and, consequently, gold prices. The fact that oil prices have seen some pullback despite geopolitical tensions is noteworthy, potentially easing some immediate inflationary pressures that might have otherwise supported gold.
Correlation Analysis: DXY, Equities, and Gold's Dance
Understanding the correlation between gold and other major market instruments is crucial for a comprehensive outlook. The US Dollar Index (DXY) at 99.37 is currently exhibiting strength, particularly on the daily chart where the ADX is a robust 34.21, indicating a strong upward trend. This inverse relationship means a stronger dollar typically pressures gold prices lower. If the DXY continues its ascent, it presents a significant hurdle for gold. Equity markets, represented by the SP500 and Nasdaq100, are showing strength on the 1-hour and 4-hour charts, but the daily charts reveal a bearish trend. The SP500 is trading at 6753.4, and the Nasdaq100 at 24948.75, both with strong upward trends on shorter timeframes but a bearish outlook on the daily. This conflict between short-term optimism and longer-term caution in equities could signal underlying risk aversion, which historically benefits gold. However, the current strength in the dollar seems to be overriding this dynamic, keeping gold pinned near its current levels. The divergence between the bullish short-term signals in equities and the bearish daily outlook adds another layer of complexity, suggesting that the market is awaiting a clearer macro direction.
What Does the 'WATCH_ZONE' Signal Mean for Traders?
The 'WATCH_ZONE' classification for XAUUSD indicates a market that is currently lacking a clear directional bias or a strong trading setup. It signifies a period of consolidation and indecision, where price action is being influenced by competing forces. For traders, this often translates to a need for patience and a focus on risk management. A daily close above the key resistance level of $5,018.16 would be the first significant sign that bulls are regaining control and could open the door for a test of higher levels. Conversely, a decisive break below the support at $4,987.11, especially on increased volume, would suggest that the bears are asserting dominance and targeting lower price points. In this 'WATCH_ZONE' environment, scalpers might find opportunities in the tight intraday ranges, but swing and position traders would be wise to wait for a clearer signal or a confirmed breakout before committing significant capital. The current market structure suggests that the price is consolidating, and a breakout is likely to be driven by significant news events, such as the upcoming Fed decision or a major geopolitical development.
The Importance of the $4,987.11 Support Level
The support level at $4,987.11 is particularly critical in the current XAUUSD price structure. This level has been tested on the 1-hour chart, and its ability to hold will be a key determinant of short-term price direction. A failure to hold this support could trigger a cascade of stop-loss orders, potentially accelerating a move towards the next support at $4,978.12. On the flip side, if $4,987.11 acts as a springboard, it could signal the beginning of a recovery, aiming to challenge the immediate resistance at $5,018.16. The ADX reading of 23.06 on the 1-hour chart indicates a moderate downtrend strength, suggesting that while the bears have some momentum, it's not yet an overwhelming force. This makes the $4,987.11 level a crucial battleground where short-term sentiment will be tested. Traders should closely monitor volume around this price point; a significant increase in trading activity as the price approaches or tests this level would signal increased conviction from either the buyers or sellers.
Future Outlook: Fed, Geopolitics, and the Path Forward
Looking ahead, the path for gold prices remains contingent on several evolving factors. The Federal Reserve's policy stance will undoubtedly be the most closely watched element in the coming days. Should the Fed signal a more accommodative stance than currently priced in, gold could find significant upward momentum. Simultaneously, any escalation in geopolitical flashpoints would naturally boost gold's safe-haven appeal, potentially overriding dollar strength. Conversely, a persistent 'higher for longer' narrative from the Fed, coupled with a de-escalation of global tensions and strong US economic data, could see gold face renewed downside pressure, testing lower support levels. The current technical setup, characterized by conflicting signals and a lack of clear trend on the daily chart, suggests that significant price movements are more likely to be event-driven rather than purely technical breakouts in the short term. Patience and discipline will be key for traders navigating this environment, waiting for clear confirmation before establishing positions.
Scenario Analysis: Charting Potential Gold Movements
Bearish Scenario: Testing the Waters Below $4,987
65% ProbabilityBullish Scenario: Breaking Above Resistance at $5,018
25% ProbabilityNeutral Scenario: Consolidation Around $4,987.92
10% Probability| Indicator | Value | Signal | Interpretation |
|---|---|---|---|
| RSI (14) | 42.5 | Bearish Lean | Neutral territory, leaning down |
| MACD | Negative Momentum | Bearish | MACD below signal line |
| Stochastic | K:48.1, D:31.34 | Bullish Divergence | %K > %D, potential reversal |
| ADX | 23.06 | Moderate Trend | Weak trend strength on 1H, stronger on 4H |
Frequently Asked Questions: XAUUSD Analysis
What happens if XAUUSD breaks below the critical support at $4,987.11?
A break below $4,987.11 on the 1-hour chart would invalidate the current consolidation pattern and likely trigger further downside towards $4,978.12. This scenario becomes more probable if the DXY continues to strengthen and the Fed maintains a hawkish tone.
Is the current RSI reading of 42.5 a buy signal for XAUUSD at $4,987.92?
No, an RSI of 42.5 is not typically considered a buy signal. It indicates neutral territory with a slight bearish lean, suggesting that while there isn't extreme selling pressure, the momentum is not yet in favor of buyers. Confirmation of a bullish reversal would require RSI to move above 50 and ideally show bullish divergence.
How will the upcoming Federal Reserve decision impact XAUUSD price around $4,987.92?
The Fed's decision is a major catalyst. A more dovish outlook (hinting at rate cuts) could weaken the dollar and push XAUUSD towards resistance at $5,018.16. Conversely, a hawkish stance (keeping rates higher for longer) would likely strengthen the dollar, pressuring gold towards support at $4,987.11.
Should traders consider buying XAUUSD at current levels near $4,987.92 given the mixed signals?
Given the mixed signals and 'WATCH_ZONE' classification, aggressive buying at current levels carries significant risk. A more prudent approach involves waiting for confirmation, such as a daily close above $5,018.16 or a clear break below $4,987.11, to establish a directional trade with defined risk parameters.
Track markets in real-time
AI-powered analysis, technical indicators and real-time price data.
Join Our Telegram Channel
Breaking market news, AI analysis and trading signals instantly.
Join Channel