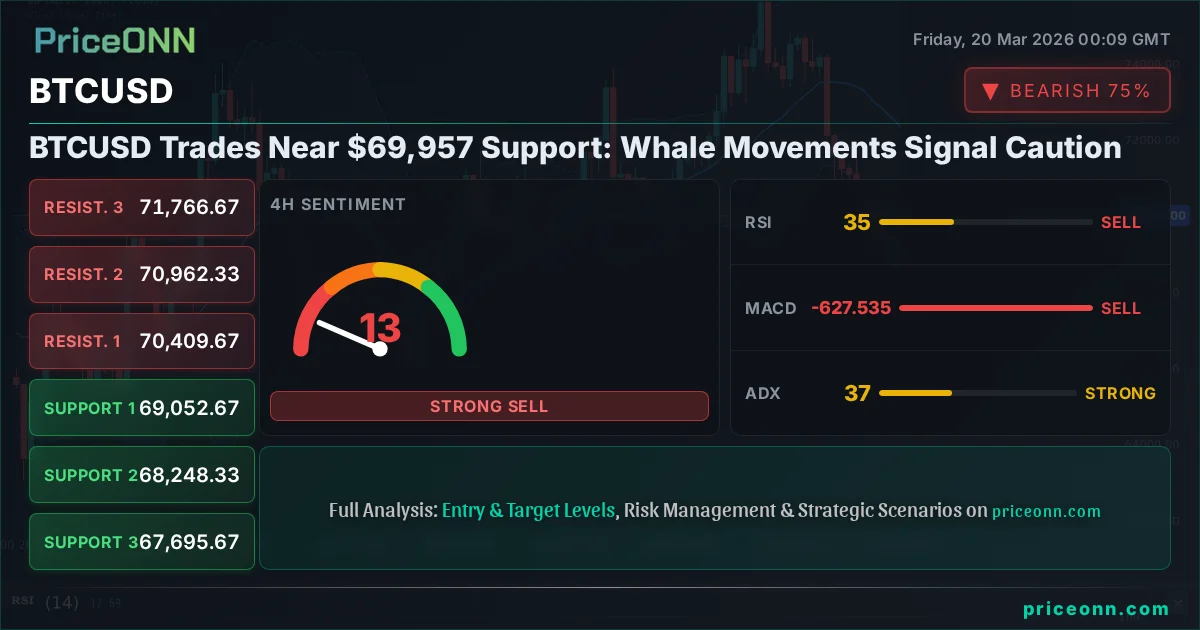
BTCUSD Trades Near $69,957 Support: Whale Movements Signal Caution
Bitcoin hovers around $69,957 as whale activity surges, transferring over $100M amid geopolitical tensions and hawkish Fed signals.
Bitcoin's price is currently hovering precariously close to a critical support level at $69,957.00, a figure that traders are watching with bated breath. This delicate balance comes amidst a backdrop of significant whale movements, with over $100 million in Bitcoin being transferred to exchanges, a clear signal of heightened caution or potential repositioning within the market. The confluence of these on-chain dynamics with escalating geopolitical tensions and a hawkish Federal Reserve stance creates a complex and potentially volatile environment for the flagship cryptocurrency.
- BTCUSD hovers near $69,957 support, with significant whale transfers indicating market shifts.
- RSI at 41.76 on the 1H chart suggests bearish momentum, while the 1D chart shows a neutral trend.
- Key support lies at $69,052.67, with a break below potentially targeting $67,695.67.
- Geopolitical risks and hawkish Fed commentary are creating a risk-off sentiment impacting BTCUSD.
The $69,957.00 mark represents more than just a price point; it's a psychological and technical battleground. Historically, such levels often dictate the short-to-medium term trajectory of an asset. For Bitcoin, a sustained hold above this figure could signal resilience and a potential base for a renewed upward push. Conversely, a decisive breach below it could trigger cascading sell orders as traders and algorithms alike react to the breakdown, potentially leading to a sharper correction. The sheer volume of whale activity - over $100 million moved to exchanges - cannot be ignored. This isn't merely speculative trading; it often signifies either a strategic shift by large holders preparing for a downturn or a deliberate move to liquidate positions. Understanding the intent behind these massive transfers is crucial for deciphering the market's immediate future.
The broader market sentiment is currently being shaped by a potent cocktail of global events. The spike in crude oil prices, driven by escalating Middle East tensions, is a stark reminder of the fragile geopolitical landscape. This, in turn, fuels inflation concerns, a factor that directly influences central bank policy. The Federal Reserve's recent commentary has been decidedly hawkish, dampening expectations for any significant interest rate cuts in 2026. This policy tightening, or at least the prolonged 'higher for longer' narrative, typically strengthens the US Dollar (DXY) and reduces risk appetite across asset classes, including cryptocurrencies. The DXY itself is currently trading at 99.1, and its influence cannot be overstated. A strengthening dollar often correlates with pressure on assets like Bitcoin, especially when coupled with a risk-off environment.
Navigating the Technical Landscape: Indicators Paint a Mixed Picture
The 1-Hour Chart: A Battle for Momentum
On the 1-hour timeframe, BTCUSD is exhibiting a neutral trend with a moderate strength of 50%. The current price of $69,957.00 is teetering near the 1-hour support at $69,927.67. The RSI(14) at 41.76, while in the neutral zone, leans towards a bearish trend, suggesting that upward momentum is not yet robust. However, the MACD is showing positive momentum, with the MACD line above its signal line, indicating a potential for short-term buying pressure. Conversely, the Bollinger Bands are positioned below the middle band, hinting at a bearish inclination in the immediate term. The Stochastic Oscillator, with K at 73.18 and D at 72.91, provides a mixed signal, showing a slight bullish inclination as %K is above %D, but both are in the upper range, suggesting potential overbought conditions are forming. The ADX at 38.68 signifies a strong downtrend on this timeframe, which contradicts the MACD's positive momentum, creating a divergence that traders must carefully observe. The overall signal on the 1-hour chart leans towards selling, with 2 buy, 6 sell, and 0 neutral signals.
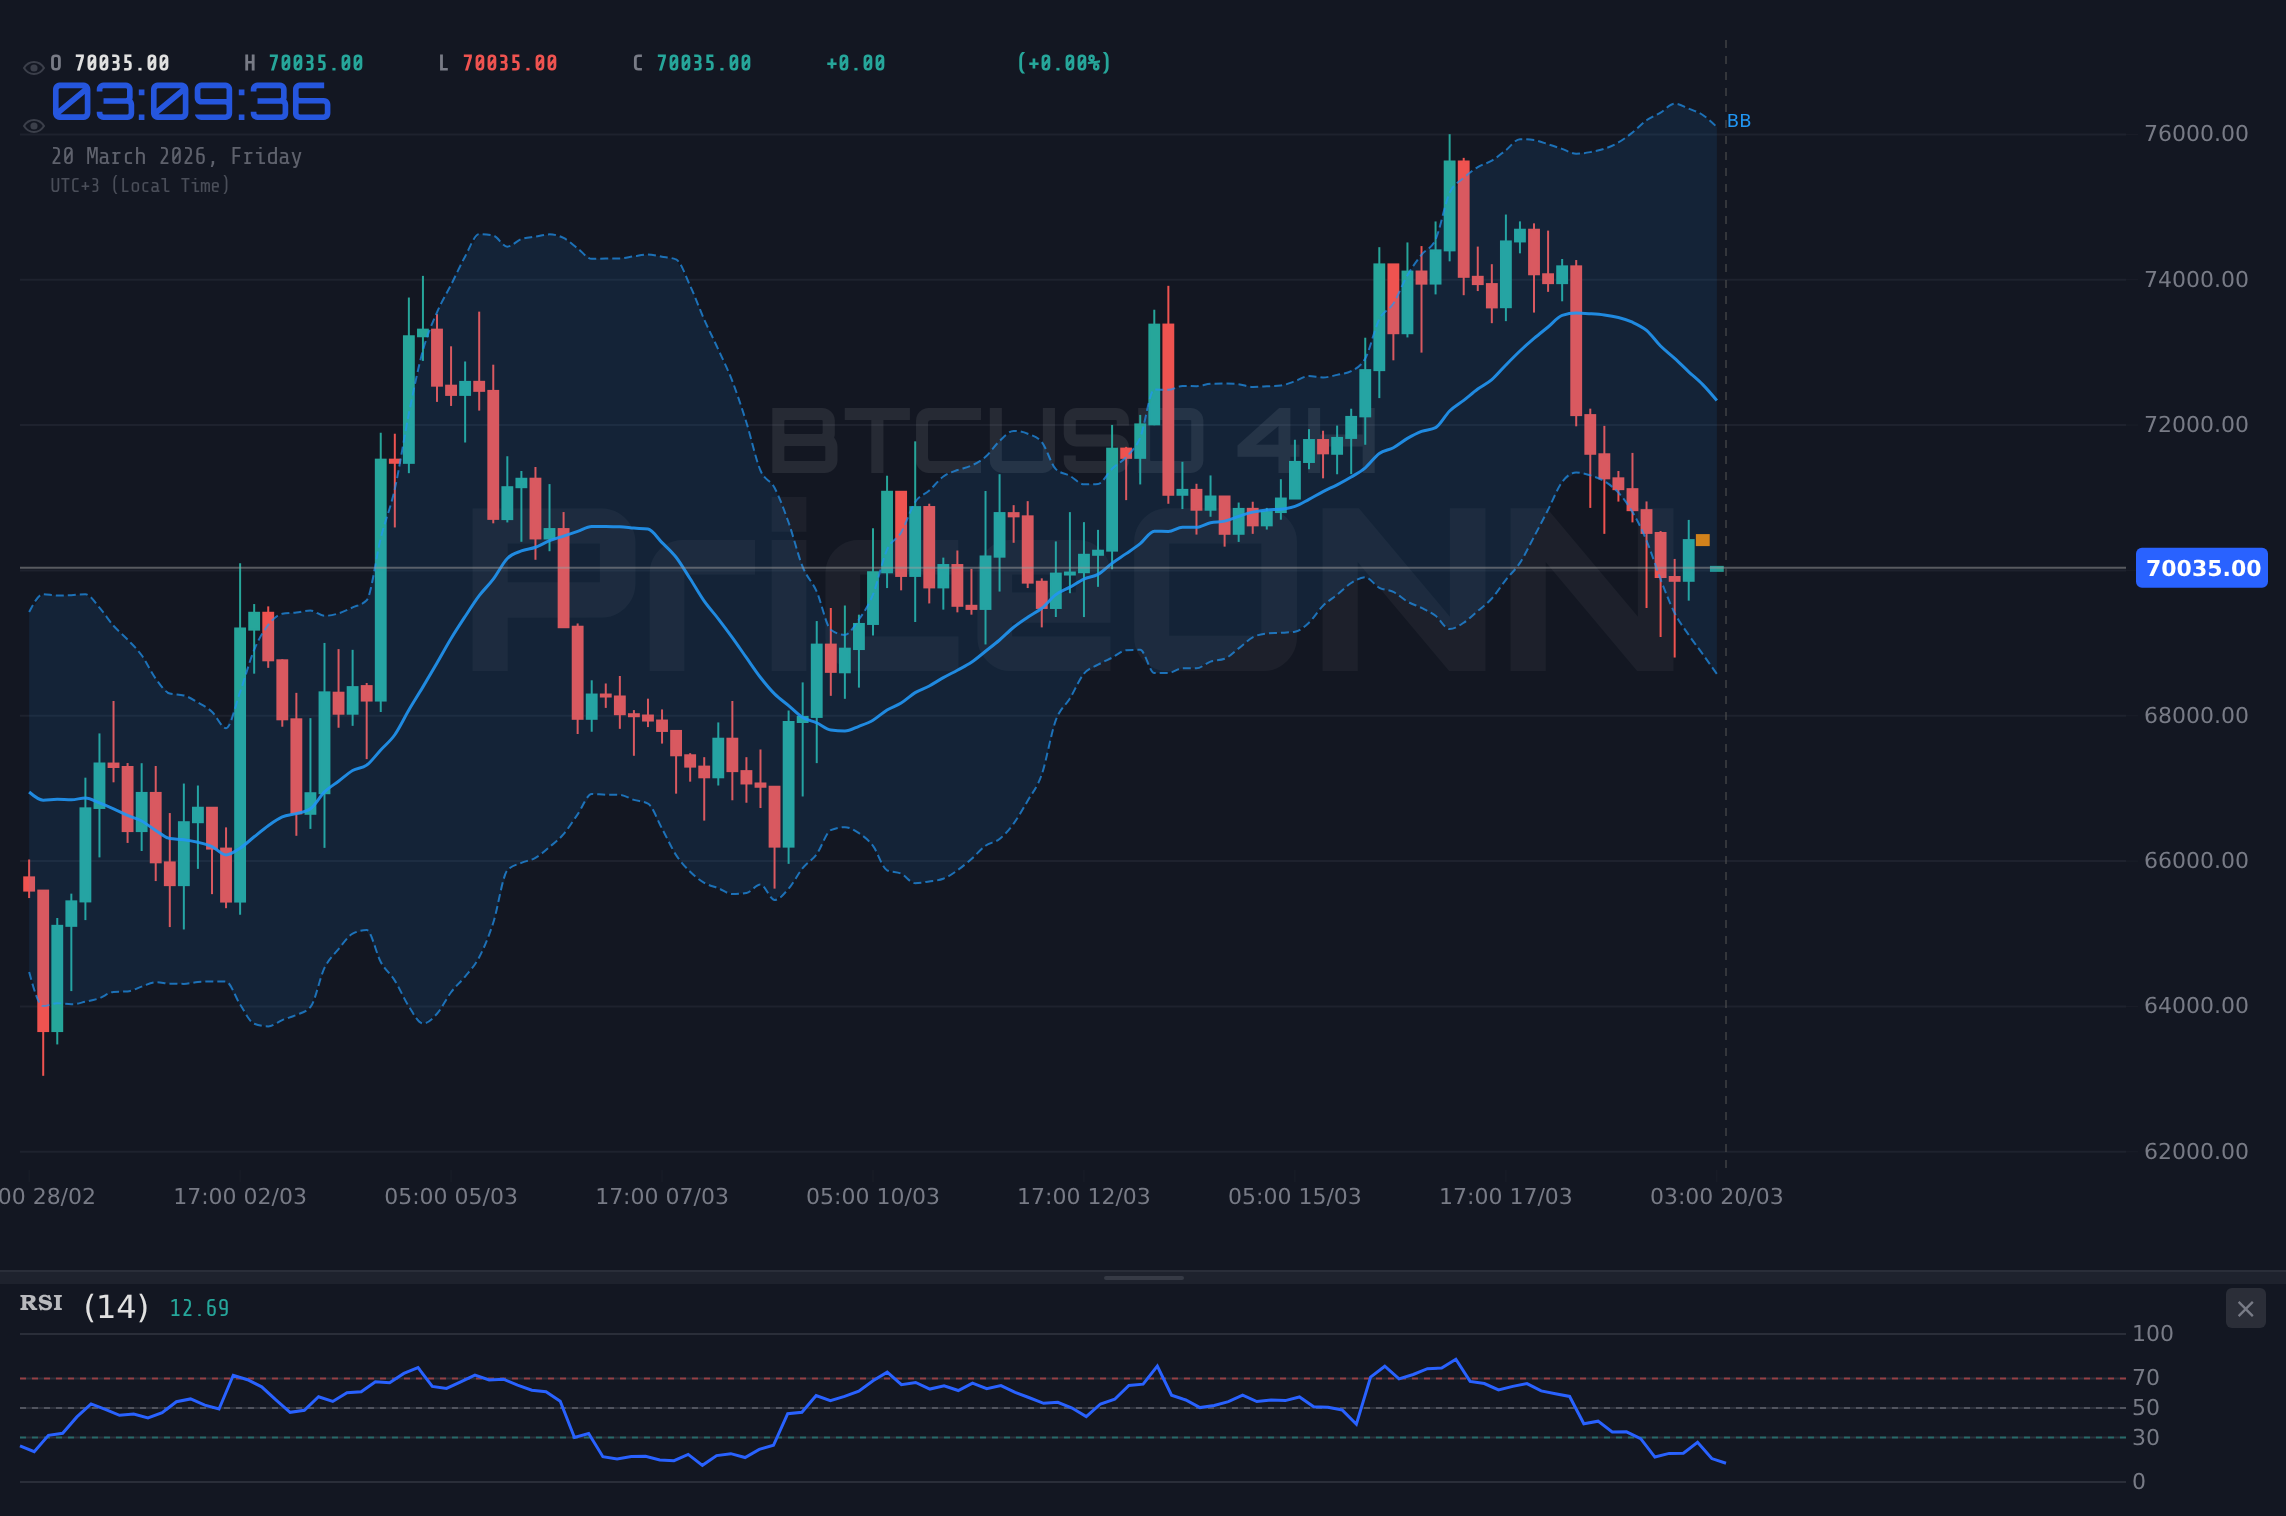
The 4-Hour Chart: Bearish Dominance Emerges
Shifting to the 4-hour chart, the trend clearly turns bearish with a strength of 100%. The support levels are more pronounced here, starting at $69,052.67, followed by $68,248.33, and then $67,695.67. Resistance is seen at $70,409.67, $70,962.33, and $71,766.67. The RSI(14) at 34.38 is firmly in the neutral zone but trending downwards, reinforcing the bearish sentiment. The MACD is firmly in negative territory, with the MACD line below its signal line, confirming bearish momentum. The Bollinger Bands are hugging the lower band, indicating significant selling pressure and potential for a breakdown. The Stochastic Oscillator shows K at 18.38 and D at 15.58; while both are in oversold territory, %K is above %D, suggesting a potential for a short-term bounce, but the overall trend remains bearish. The ADX at 36.58 confirms a strong downtrend. The aggregate signal here is strongly bearish, with only 2 buy signals against 6 sell signals. This timeframe's data suggests that any bounce might be short-lived unless significant buying pressure emerges.
The Daily Chart: A Neutral Stance with Underlying Weakness
On the daily chart, the trend is neutral, with a power of 50%, but the underlying signals suggest caution. The immediate support is identified at $69,588, followed by $67,909, and then a more significant level at $65,315. Resistance levels stand at $73,861, $76,455, and $78,134. The RSI(14) is at 48.27, hovering just below the midpoint, indicating a lack of strong conviction in either direction but with a slight bearish lean. The MACD is showing positive momentum on the daily chart, with the MACD line above its signal line, which is a bullish divergence from the shorter timeframes. This could signal that the underlying trend might be shifting, or it could be a temporary reprieve before further declines. The Bollinger Bands are below the middle band, consistent with bearish pressure, but the Stochastic Oscillator presents a bearish signal with K at 47.07 and D at 69.46, indicating %K is below %D and trending down. The ADX reading of 24.98 suggests a moderately strong uptrend, which contradicts the bearish signals from other indicators on this timeframe. The overall signal leans bearish (1 buy, 7 sell, 0 neutral), indicating that despite the neutral trend, sellers have more conviction.
The conflicting signals across different timeframes present a classic 'watch zone' scenario. The 1-hour chart shows a strong downtrend in momentum (ADX 38.68) but positive MACD. The 4-hour chart confirms strong bearish pressure (ADX 36.58, negative MACD, RSI 34.38). The daily chart, however, offers a glimmer of hope with a neutral trend and positive MACD, although other indicators lean bearish. This divergence highlights the current indecision in the market. Any sustained move will likely require a catalyst to break this stalemate. For instance, a significant macro event or a shift in whale behavior could tip the scales. Currently, the immediate risk appears to be to the downside, given the bearish confluence on the shorter timeframes.
Current Price Action: BTCUSD is trading around $69,957, testing key intraday support. A close below $69,052.67 on the 4-hour chart would invalidate any immediate bullish hopes and confirm a bearish continuation.
The Whale Factor: On-Chain Data Speaks Volumes
The recent on-chain activity, specifically the transfer of over $100 million worth of Bitcoin to exchanges by whale addresses, is a critical piece of the puzzle. This movement is not a minor fluctuation; it represents a substantial amount of capital that could significantly impact market liquidity and price action. Historically, large inflows to exchanges often precede price dumps, as whales may be preparing to sell their holdings. Alternatively, these could be strategic rebalancing moves, or even preparations for large buy orders on exchanges if they anticipate a dip. The timing of this activity, amidst geopolitical uncertainty and hawkish central bank rhetoric, adds another layer of complexity. It suggests that these large holders are reacting to, or anticipating, broader market shifts. The 'ancient Bitcoin holders' mentioned in the news are typically those who have held their assets for years, often acquired at much lower prices. Their actions can be seen as a signal of conviction or a warning, depending on whether they are accumulating or distributing.
Further analysis of on-chain metrics, such as active addresses and transaction volumes, would provide a clearer picture. If active addresses are declining while whale transfers to exchanges are increasing, it strengthens the bearish case. Conversely, if active addresses remain high or are increasing, it could suggest that retail and smaller investors are still accumulating, potentially absorbing selling pressure from whales. The hash rate, a measure of Bitcoin's network security and computational power, has been robust, indicating the network itself remains strong. However, network health alone does not guarantee price appreciation, especially when large capital outflows are observed.
The 'SlowFi' initiative on the Bitcoin network, as mentioned in recent news, points to an evolving DeFi ecosystem. While intriguing for the long-term development of Bitcoin's utility, its immediate impact on price action around the $69,957 level is likely minimal. The market is currently more sensitive to macro factors and large-scale capital movements than to nascent technological developments. The core of Bitcoin's price discovery at these levels remains driven by macroeconomic influences, investor sentiment, and the strategic actions of significant holders.
Whale Transfers: The movement of over $100 million in BTC to exchanges is a significant event. While the exact intent is unknown, it typically precedes increased volatility. Traders should monitor exchange balances closely for further accumulation or distribution signals.
Macroeconomic Headwinds and Their Impact
The Federal Reserve's persistent hawkish tone is arguably the most significant macroeconomic factor influencing Bitcoin and other risk assets. The commentary suggesting a delay or even cancellation of rate cuts for 2026 has sent ripples through financial markets. Higher interest rates increase the opportunity cost of holding non-yielding assets like Bitcoin, making interest-bearing assets more attractive. This narrative directly impacts the DXY, which is currently at 99.1. A strong dollar generally exerts downward pressure on commodities and cryptocurrencies. The correlation between BTCUSD and DXY, while not always perfect, is a significant factor to consider. When the dollar strengthens, it often signifies a 'risk-off' environment, where investors flee to perceived safe havens, pulling capital away from riskier assets like Bitcoin.
Geopolitical tensions, particularly in the Middle East, further exacerbate this risk-off sentiment. The spike in crude oil prices, as highlighted by the news regarding Cuba's blackout amidst a US oil blockade, underscores the fragility of global energy supplies. This instability can lead to renewed inflation fears, prompting central banks to maintain or even increase interest rates, reinforcing the hawkish narrative. For Bitcoin, which has often been touted as an inflation hedge, this creates a conflicting dynamic. While inflation itself might normally boost gold and potentially Bitcoin, the central bank's reaction to inflation (higher rates) can negate those benefits by increasing the cost of capital and reducing overall liquidity.
The European Central Bank (ECB) and the Bank of England (BoE) are also expected to hold rates steady, with focus shifting to their communication. Any hints of a more aggressive stance on inflation from these banks could further dampen global risk appetite. The SNB's expected rate hold also contributes to this theme of central banks prioritizing inflation control over growth stimulus. This synchronized approach to monetary policy globally creates headwinds for assets that thrive in a low-rate, high-liquidity environment. The current macro backdrop is therefore not conducive to a risk-on rally for Bitcoin, despite its technological potential.
Hawkish Fed & Geopolitics: The combination of a hawkish Fed and escalating geopolitical tensions creates a challenging environment. This macro setup favors a stronger USD and potentially lower risk asset prices, including BTCUSD, unless a significant shift in sentiment occurs.
Trade Scenarios: Navigating the Uncertainty
Given the mixed signals and the critical juncture at $69,957.00, a cautious approach is warranted. The market is at a crossroads, and clear confirmation is needed before committing to a significant directional trade. The following scenarios outline potential paths forward, based on the current technical and fundamental landscape.
Bearish Scenario: Breakdown Below Support
65% ProbabilityNeutral Scenario: Consolidation Around Support
25% ProbabilityBullish Scenario: Bounce from Support
10% ProbabilityCurrent Stance: WATCH_ZONE. A daily close above resistance at $70,409.67 would be needed to initiate a bullish bias, targeting higher levels. Conversely, a confirmed break below support at $69,052.67 would validate the bearish scenario. Until then, caution and risk management are paramount.
What's Next for Bitcoin? The Road Ahead
The immediate future for BTCUSD hinges on its ability to hold the $69,957.00 level and, more critically, the $69,052.67 support on the 4-hour chart. The on-chain data, particularly the whale transfers, adds a layer of uncertainty that cannot be ignored. If these transfers represent distribution, a deeper correction is likely. The macro environment, with its hawkish Fed undertones and geopolitical risks, continues to cast a shadow over risk assets, potentially limiting any upside momentum for Bitcoin.
For traders, patience is key. Waiting for a clear break of either the support or resistance levels defined in the scenarios above will be crucial. A confirmed breakdown below $69,052.67 could open the door to the $67,695.67 level, offering a potential shorting opportunity if risk management is strictly adhered to. On the other hand, a sustained bounce from current levels, followed by a decisive move above $70,409.67, could signal a continuation of the bullish trend, albeit with significant resistance still ahead around $71,766.67.
The evolving DeFi landscape on Bitcoin, while a positive long-term development, is unlikely to be a primary price driver in the short term. Market participants will remain focused on macroeconomic data releases, central bank communications, and the strategic actions of large holders. The interplay between these factors will ultimately determine whether Bitcoin can reclaim higher ground or succumbs to the prevailing bearish pressures. The current price action near $69,957.00 is a critical test, and how it resolves will set the tone for the coming days and weeks.
Frequently Asked Questions: BTCUSD Analysis
What happens if BTCUSD breaks below the $69,052.67 support level?
If BTCUSD closes decisively below $69,052.67 on a 4-hour chart, it would likely trigger further selling pressure, potentially targeting the next support at $68,248.33. This would invalidate the neutral scenario and confirm the bearish outlook.
Should I consider buying BTCUSD at current levels near $69,957 given the whale activity?
Given the significant whale transfers to exchanges and the mixed technical signals, buying at current levels carries substantial risk. A confirmed bounce off the $69,052.67 support with high volume would be a more prudent entry trigger for a bullish position.
Is the RSI at 41.76 on the 1-hour chart a sell signal for BTCUSD?
An RSI of 41.76 on the 1-hour chart is in the neutral zone, leaning bearish. While not an immediate sell signal on its own, it indicates a lack of strong buying momentum, aligning with the overall bearish sentiment on shorter timeframes.
How will the hawkish Fed stance and geopolitical tensions affect BTCUSD this week?
The hawkish Fed commentary and geopolitical risks contribute to a risk-off environment, which typically pressures assets like BTCUSD. This macro backdrop suggests that any upward moves might face strong headwinds, and a break below support levels becomes more probable without a significant shift in global sentiment.
| Indicator | Value | Signal | Interpretation |
|---|---|---|---|
| RSI (14) | 41.76 | Bearish Lean | Neutral zone, favoring downside momentum. |
| MACD | 0.00 | Bullish Momentum | MACD line above signal line, indicating positive momentum. |
| Stochastic | 73.18 / 72.91 | Bullish Signal | %K > %D, but nearing overbought territory. |
| ADX | 38.68 | Strong Downtrend | Indicates a strong trend, currently bearish on 1H. |
| Bollinger Bands | N/A | Below Mid Band | Price trading below the middle band suggests bearish pressure. |
Track markets in real-time
AI-powered analysis, technical indicators and real-time price data.
Join Our Telegram Channel
Breaking market news, AI analysis and trading signals instantly.
Join Channel