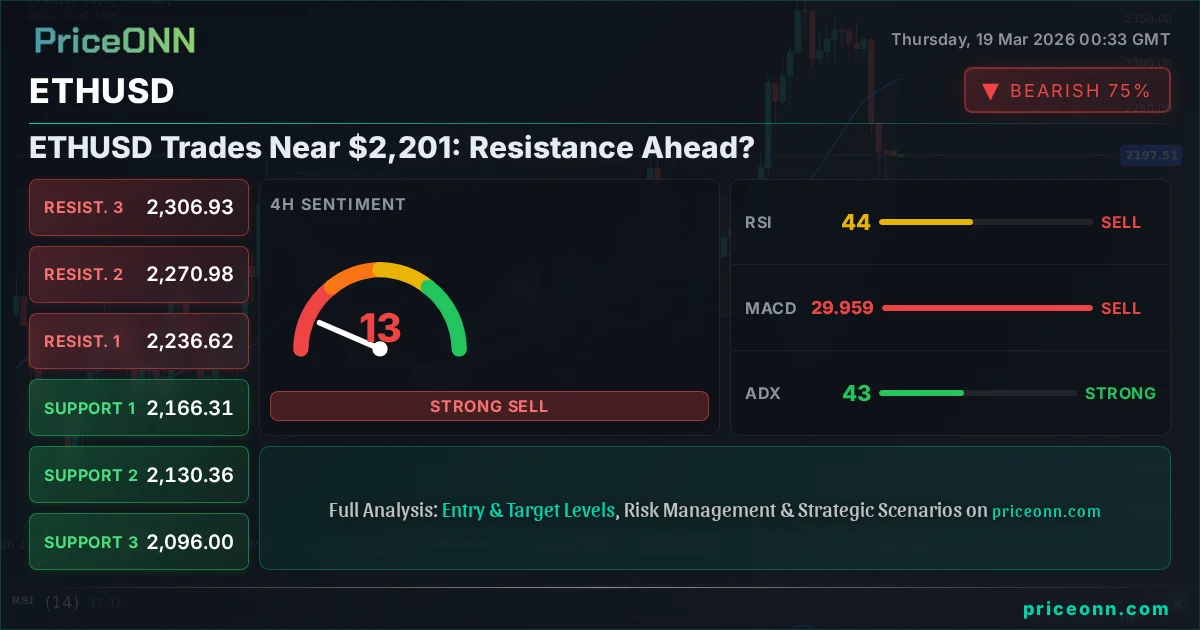
ETHUSD Trades Near $2,201: Resistance Ahead?
ETHUSD is currently trading around $2,201.38. With a strong downtrend on multiple timeframes and bearish signals, traders are watching key resistance levels for potential downside continuation.
The cryptocurrency market is experiencing significant volatility, and Ethereum (ETHUSD) is no exception, currently trading near $2,201.38. This price point comes after a notable daily decline of -5.75%, or -$134.32, highlighting a shift in market sentiment. As traders navigate this choppy environment, the crucial question is whether ETHUSD can overcome immediate resistance or if further downside is on the horizon. This analysis delves into the technical indicators, market correlations, and fundamental underpinnings shaping ETHUSD's current trajectory, aiming to provide a clear outlook for traders watching this critical juncture.
- ETHUSD is trading at $2,201.38, down 5.75% on the day, indicating bearish pressure.
- On the 4-hour chart, ADX at 43.07 signals a strong downtrend, with RSI at 44.76 suggesting further room to fall.
- Key resistance is eyed at $2,209.10, while crucial support lies at $2,167.85 on the 1-hour timeframe.
- The broader market shows risk-off sentiment with DXY rising and major indices like SP500 and Nasdaq declining, correlating with ETHUSD's weakness.
Navigating the Downtrend: ETHUSD's Technical Snapshot
The 1-hour chart paints a picture of immediate bearish momentum for ETHUSD. With a current price of $2,201.38, the pair has seen a significant daily drop. The technical indicators here are largely flashing caution. The Relative Strength Index (RSI) at 36.82 is firmly in neutral territory but trending downwards, suggesting sellers are gaining ground. MACD is exhibiting negative momentum, with the MACD line below its signal line, reinforcing the bearish sentiment. The Stochastic Oscillator, while showing a potential for a bounce with %K at 59.57 above %D at 30.04, is in a tricky spot; this could indicate a temporary pause rather than a reversal in the immediate downtrend. The Average Directional Index (ADX) at 33.95 confirms a strong downtrend is in play, indicating that any potential upward moves might be short-lived pullbacks.
On this shorter timeframe, immediate resistance is observed at $2,209.10, followed by $2,216.87 and $2,236.62. Conversely, the immediate support levels to watch are $2,176.42 and $2,167.85. A break below these levels would confirm the continuation of the short-term bearish trend. The current 'General Signal' leans heavily towards 'SAT' (Sell), with 2 'Buy', 6 'Sell', and 0 'Neutral' signals across the indicators, underscoring the prevailing bearish sentiment on this timeframe.
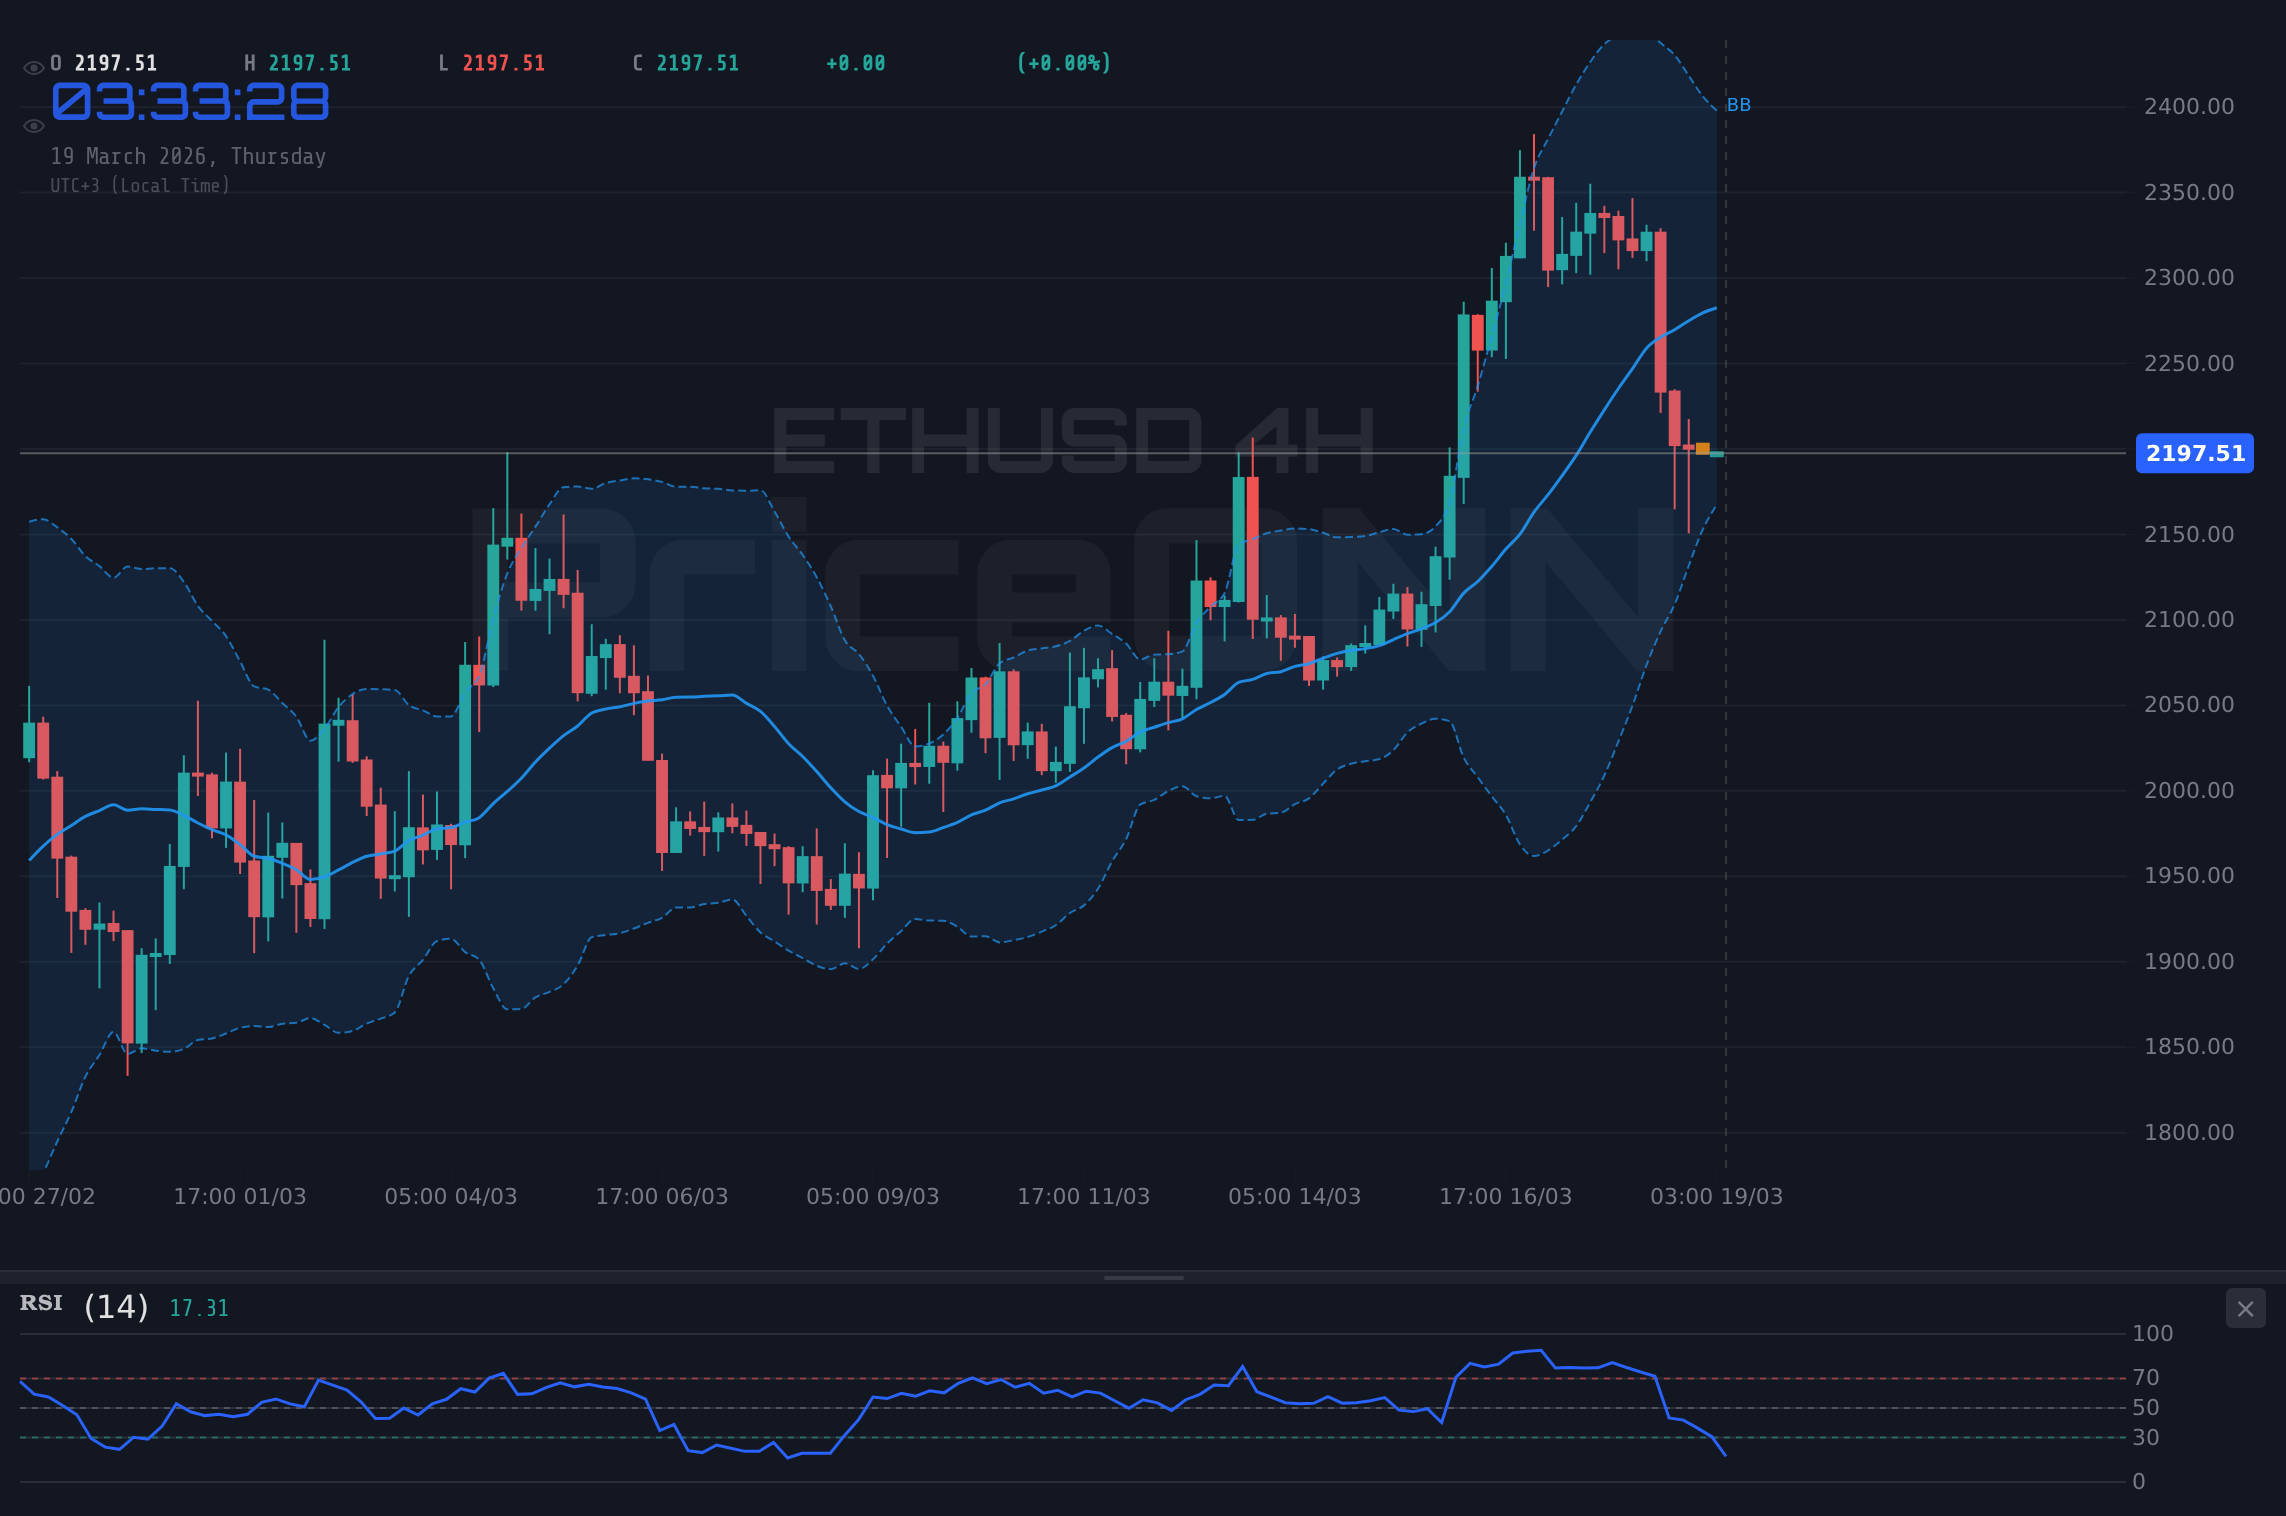
Looking at the 4-hour timeframe, the trend is still classified as neutral with 50% strength, but the underlying signals are predominantly bearish. The ETHUSD price at $2,201.38 is navigating through a period of consolidation after the sharp decline. The RSI(14) at 44.76 is in the neutral zone, still indicating room for price to decline further before hitting oversold conditions. The MACD remains in negative territory, below its signal line, further supporting the bearish outlook. Bollinger Bands show the price below the middle band, hinting at a downward bias. The Stochastic Oscillator presents a falling %K (13.48) below %D (27.42), suggesting further downside potential. Crucially, the ADX value stands at 43.07, indicating a very strong downtrend. The overwhelming 'SAT' signal (2 Buy, 6 Sell, 0 Neutral) on this timeframe reinforces the bearish narrative, suggesting that the current price action might be a temporary pause before further declines.
The 4-hour support levels are identified at $2,130.36 and $2,096. Resistance levels to monitor are situated at $2,236.62 and $2,270.98. A decisive break below the $2,130.36 support could trigger a more significant sell-off, while holding these levels might offer a temporary reprieve. The strength of the downtrend indicated by the ADX is a key factor here; it suggests that any rallies are likely to be met with selling pressure.
The Daily Perspective: A Wider Lens on ETHUSD
On the daily chart, ETHUSD is currently hovering around $2,201.38, and the trend is broadly considered neutral with 50% strength, though the signals are leaning positive. This divergence from the shorter timeframes is significant. The RSI(14) is at 54.72, sitting comfortably in neutral territory and showing a slight upward bias, suggesting potential for recovery. MACD has turned positive, with the MACD line above its signal line, indicating building bullish momentum. The Bollinger Bands show the price trading above the middle band, which typically signals an uptrend. The Stochastic Oscillator is also in bullish territory, with %K at 73.69 and %D at 71.74, indicating strong upward momentum, though it's approaching overbought conditions.
The ADX on the daily chart is 26.23, which signifies a strong uptrend, contradicting the bearish signals seen on the hourly and 4-hour charts. This suggests that while short-term sentiment might be negative, the longer-term trend could still be intact. The 'AL' (Buy) signal is dominant on this timeframe, with 6 Buy signals, 2 Sell signals, and 0 Neutral signals. This longer-term bullish outlook is supported by daily support levels at $2,201.38, $2,176.42, and $2,167.85. However, the immediate price action needs to be considered within the context of the stronger downtrend on lower timeframes. Daily resistance levels are at $2,292.23, $2,381.69, and $2,427.67. A sustained move above the $2,292.23 level would be crucial to confirm the bullish reversal on lower timeframes.
The conflict between the short-term bearish signals and the longer-term bullish indicators is a classic sign of market indecision and potential for a significant move. While the daily chart suggests a potential recovery, the strong downtrend on the 4-hour chart, confirmed by an ADX of 43.07, cannot be ignored. This indicates that the market is currently in a tug-of-war, with short-term sellers attempting to push prices down against a potentially resilient long-term uptrend. Traders must be particularly watchful for confirmation on lower timeframes; a sustained break above the $2,209.10 resistance on the 1-hour chart would be the first sign of a potential shift, but a more robust confirmation would involve a clear break of the $2,236.62 resistance.
Macroeconomic Crosscurrents and Crypto Correlations
The cryptocurrency market, particularly ETHUSD, does not exist in a vacuum. Its price action is increasingly intertwined with broader macroeconomic trends and traditional market movements. The current environment is marked by rising US dollar strength, as indicated by the Dollar Index (DXY) trading near 99.94 and showing a strong uptrend on the daily chart. This strengthening dollar typically exerts downward pressure on risk assets like cryptocurrencies, as investors seek perceived safety in the greenback. The DXY's RSI at 76.14 on the 1-hour chart signals it is in overbought territory, suggesting a potential short-term pullback in the dollar, which could offer some relief to ETHUSD.
Furthermore, the performance of major equity indices like the SP500 and Nasdaq provides crucial context. Both indices are showing significant daily declines, with SP500 down 1.48% and Nasdaq down 1.59%. This risk-off sentiment in the equity markets often spills over into the crypto space. The strong downtrend signals across multiple timeframes for these indices, with ADX values indicating robust downward momentum, suggest that risk appetite is waning. This correlation is critical for ETHUSD traders; a continued sell-off in equities would likely exacerbate the downward pressure on Ethereum.
The recent surge in oil prices, with Brent Crude crossing $108 and WTI near $99, driven by geopolitical tensions and refinery restarts, also plays a role. Higher energy prices can fuel inflation concerns, which in turn influence central bank policy expectations. Persistent inflation fears could lead to a more hawkish stance from the Federal Reserve, potentially keeping interest rates higher for longer. This macroeconomic backdrop, characterized by a strong dollar, falling equities, and inflation concerns, creates a challenging environment for risk assets like ETHUSD. The recent news of US PPI skyrocketing, as reported by Forex news, further reinforces these inflation worries, potentially leading to a more cautious stance from the Fed and dampening speculative appetite in the crypto market.
The latest breaking news regarding gold prices tumbling below $5,000 due to Fed hawkishness fears is another significant indicator. While gold is a different asset class, its sharp decline due to inflation and Fed policy concerns mirrors the sentiment that could impact ETHUSD. If investors are moving away from gold as a hedge against inflation due to anticipated Fed tightening, they may also be reducing their exposure to other risk assets, including cryptocurrencies. This interconnectedness highlights the importance of monitoring traditional markets and macroeconomic data for ETHUSD trading strategies.
On-chain metrics also provide valuable insights. While specific data like active addresses or whale movements isn't provided in the market context, a general decline in price coupled with strong downtrend signals often correlates with reduced network activity and potentially increased selling pressure from larger holders looking to de-risk. Exchange flows data would be crucial here; a significant increase in ETH flowing onto exchanges could signal an intention to sell, while outflows might indicate accumulation or staking. Without this specific on-chain data, the technical picture and macroeconomic correlations become even more critical for assessing ETHUSD's immediate prospects.
Trade Scenarios and Risk Management
Given the conflicting signals between short-term bearish momentum and longer-term bullish indicators, the current market environment for ETHUSD presents a 'WATCH_ZONE' scenario. A clear directional trade setup is not yet established, and patience is key. The critical level to watch is the 4-hour resistance at $2,236.62. A decisive break and sustained hold above this level would be necessary to invalidate the strong bearish signals on lower timeframes and open the door for a potential bullish continuation towards higher targets.
Conversely, the immediate downside risk remains significant. The strong downtrend on the 4-hour chart, supported by an ADX of 43.07, suggests that the path of least resistance is currently downwards. A break below the 1-hour support at $2,167.85 would likely trigger further selling pressure, potentially leading to a retest of the more significant 4-hour support at $2,096.00. Traders should be cautious of sharp, short-lived bounces within the downtrend, as these can often be liquidity grabs before further downside.
Bearish Continuation: Testing Lower Support
65% ProbabilityConsolidation: Sideways Action
25% ProbabilityBullish Reversal: Breaking Resistance
10% ProbabilityRisk management is paramount in this environment. For any short-term bearish plays, a tight stop-loss above the entry point, ideally above the immediate 1-hour resistance at $2,209.10, would be prudent. For those looking for a bullish setup, waiting for a confirmed break above the $2,236.62 resistance level is essential, with a stop-loss placed below the breakout confirmation level. The current 'WATCH_ZONE' recommendation implies that active trading should be approached with caution, focusing on defined risk parameters and waiting for clearer directional signals.
The Road Ahead: What's Next for ETHUSD?
The immediate future for ETHUSD appears to hinge on its ability to either consolidate above the current $2,201.38 level or succumb to the strong bearish pressure indicated by the hourly and 4-hour charts. The prevailing macroeconomic sentiment, characterized by a strong dollar and risk-off appetite in traditional markets, adds a layer of complexity. Any positive news regarding inflation easing or a less hawkish stance from the Federal Reserve could provide a much-needed catalyst for a recovery, potentially bringing the daily bullish signals back into play. However, without such catalysts, the path of least resistance remains downwards.
Traders should closely monitor the interplay between ETHUSD's price action and the key levels identified. A failure to hold the $2,167.85 support could accelerate declines, while a decisive move above $2,236.62 would signal a potential shift in momentum. The strength of the trend, as indicated by the ADX values, suggests that any moves might be sharp and decisive once a breakout occurs. For now, the 'WATCH_ZONE' recommendation stands; patience and disciplined risk management are the most effective strategies as ETHUSD navigates these critical technical levels amidst a challenging macroeconomic backdrop.
Frequently Asked Questions: ETHUSD Analysis
What happens if ETHUSD breaks below the $2,167.85 support level?
If ETHUSD breaks decisively below the $2,167.85 support on the 1-hour chart, it would confirm the continuation of the short-term downtrend. This could trigger further selling pressure, potentially leading to a retest of the more significant 4-hour support at $2,096.00, especially given the strong ADX reading of 43.07 indicating a robust downward trend.
Should I consider buying ETHUSD at current levels around $2,201.38 given the daily chart signals?
Buying at current levels around $2,201.38 carries significant short-term risk due to the strong bearish signals on the 1-hour and 4-hour charts. While the daily chart shows bullish potential (RSI 54.72, positive MACD), a confirmed break above the 4-hour resistance at $2,236.62 would be a more prudent trigger for a bullish entry, with a stop-loss below $2,167.85.
Is the RSI at 44.76 on the 4-hour chart a sell signal for ETHUSD?
An RSI of 44.76 on the 4-hour chart is in the neutral zone and trending downwards, suggesting that while it's not yet oversold, there is room for further decline. Combined with the strong downtrend indicated by ADX 43.07, this RSI reading reinforces the bearish sentiment on this timeframe, making it a cautious signal rather than an outright sell.
How might the rising DXY and falling SP500 impact ETHUSD this week?
The rising Dollar Index (DXY) near 99.94 and falling SP500 index (down 1.48%) indicate a broader risk-off environment. This macroeconomic backdrop typically exerts downward pressure on risk assets like ETHUSD. If this trend continues, it could exacerbate ETHUSD's declines, making it harder for the cryptocurrency to overcome resistance levels.
| Indicator | Value | Signal | Interpretation |
|---|---|---|---|
| RSI (14) | 44.76 | Neutral | Suggests room for further decline in downtrend. |
| MACD | -19.62 | Bearish | Negative momentum confirmed below signal line. |
| Stochastic | K:13.48, D:27.42 | Bearish | Falling %K below %D indicates downside potential. |
| ADX | 43.07 | Strong Trend | Confirms a very strong downtrend is in play. |
| Bollinger Bands | Below Middle Band | Bearish | Price below middle band indicates downward pressure. |
Track markets in real-time
AI-powered analysis, technical indicators and real-time price data.
Join Our Telegram Channel
Breaking market news, AI analysis and trading signals instantly.
Join Channel