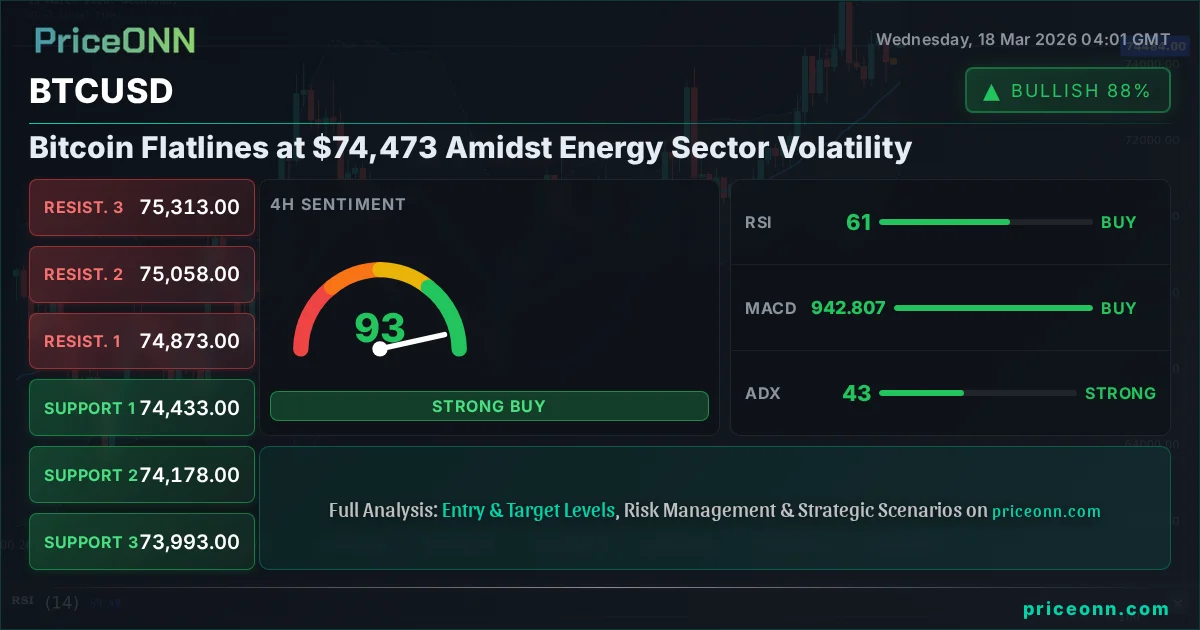
Bitcoin Flatlines at $74,473 Amidst Energy Sector Volatility
Bitcoin hovers around $74,473 as energy markets react to global shifts. Technical indicators suggest consolidation, but key levels to watch are $73,392 and $75,993. What's next?
Bitcoin is currently navigating a critical juncture, holding its ground around the $74,473 mark. This consolidation occurs against a backdrop of significant movement in global energy markets, with Brent crude prices experiencing a notable downturn. While the digital asset space often moves to its own rhythm, the interconnectedness of global markets means that shifts in energy prices, geopolitical tensions, and central bank policy can ripple through to even the most nascent asset classes. The question on many traders' minds today is whether this sideways action in Bitcoin is a precursor to a significant move, or simply a pause before the next leg of its journey. The current technical setup, combined with the broader economic sentiment, provides a complex but potentially rewarding landscape for those watching closely.
- Bitcoin holds steady around $74,473, with key support at $73,392 and resistance at $75,993.
- The 1-day RSI at 59.73 suggests bullish momentum is present but not yet overextended.
- MACD on the 1-day chart shows positive momentum, indicating potential for further upside.
- Energy market volatility, particularly in Brent crude, adds a layer of uncertainty to broader market sentiment.
The cryptocurrency market, and Bitcoin in particular, has shown remarkable resilience in recent times, often decoupling from traditional financial markets. However, the current price action around $74,473 presents a fascinating case study in market psychology and technical confluence. On the 1-hour chart, BTCUSD is showing a mixed signal, with a strong bullish trend (93% strength) but a slightly less convincing overall signal of 'BUY' (7 buys, 1 sell, 0 neutral). This suggests that while the short-term momentum is upwards, there's an underlying caution among traders, perhaps waiting for clearer direction or confirmation from broader market cues. The RSI(14) at 54.59 on this timeframe indicates a neutral-to-bullish stance, but the MACD's negative momentum, with the MACD line below the signal line, hints at potential short-term headwinds. The ADX at 16.47, however, points to a weak trend, meaning any move might lack sustained power without further catalysts.
Shifting to the 4-hour timeframe, the picture becomes slightly more defined. Here, the trend is neutral with 50% strength, but the overall signal leans strongly towards 'BUY' (7 buys, 1 sell, 0 neutral). The RSI(14) at 60.43 is in the bullish zone, suggesting room for upside before hitting overbought territory. The MACD is positive, with the MACD line above the signal line, reinforcing the bullish sentiment. The Stochastic indicator, however, presents a slight divergence: %K at 52.64 and %D at 56.91 indicates a potential bearish signal as %K dips below %D. Yet, the ADX at 42.84 signifies a strong uptrend, creating a somewhat conflicting but overall bullish leaning environment. This confluence of indicators on the 4-hour chart suggests that while consolidation might occur, the underlying strength favors a move higher, provided key levels are respected.
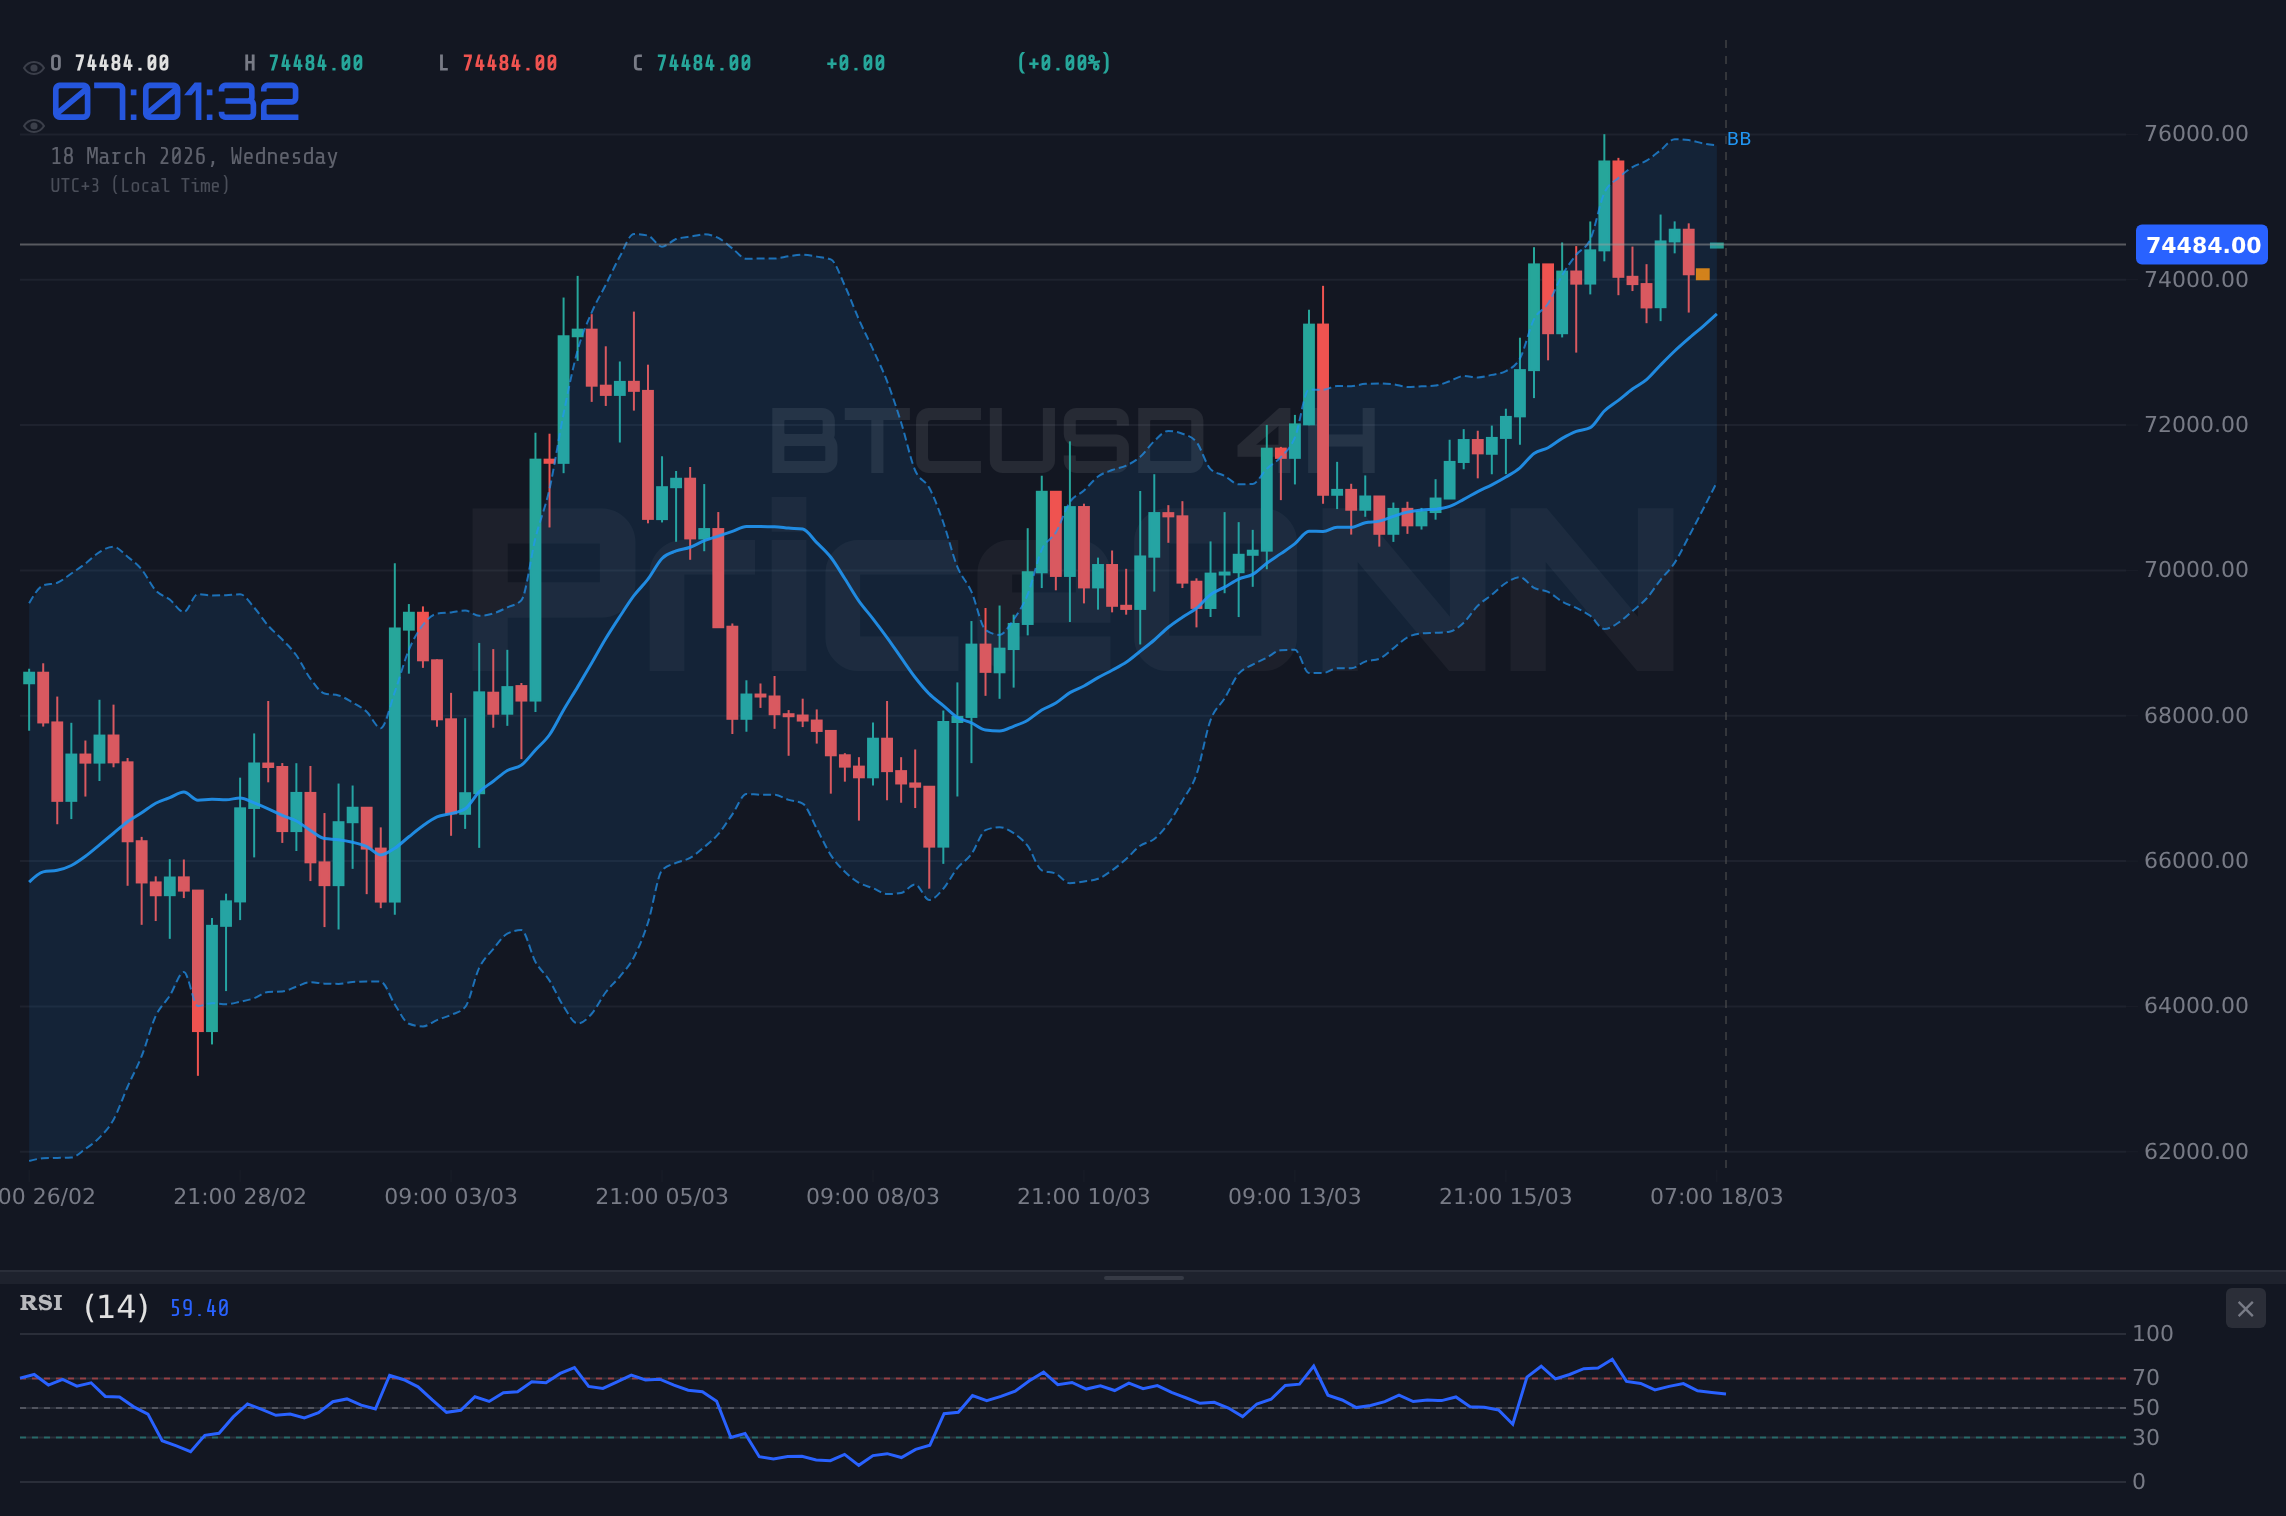
The daily chart offers the most significant context for Bitcoin's current position. The trend is neutral (50% strength), but the overall signal is a robust 'BUY' (7 buys, 1 sell, 0 neutral). The RSI(14) stands at 59.73, comfortably in the neutral-to-bullish zone, leaving ample room for upward movement. The MACD shows positive momentum, with the MACD line consistently above the signal line, a classic sign of underlying strength. Bollinger Bands are trading above the middle band, indicating a bullish inclination. The Stochastic oscillator, with %K at 87.64 and %D at 74.07, is in overbought territory, signaling a potential for a pullback or consolidation. However, the ADX at 27.62 indicates a strong uptrend, suggesting that even if overbought conditions persist, the trend itself remains firmly in place. This daily perspective suggests that while short-term fluctuations are inevitable, the longer-term outlook remains positive, with the $74,473 level acting as a crucial pivot.
Navigating the Energy Market Storm
The current price action in Bitcoin is unfolding against a backdrop of significant volatility in the energy sector. Brent crude oil, a global benchmark, has seen a sharp decline, trading at $101.25, down 2.25% on the day. This downward pressure on oil prices, despite a strong uptrend on the daily chart (ADX 61.43), is largely driven by factors such as Germany capping fuel prices and potential shifts in global energy supply dynamics, as indicated by news of Idemitsu Kosan's investment in the LNG market. The WTI crude, trading at $92.92, also reflects this bearish sentiment in the energy complex. This juxtaposition is interesting; typically, a strong uptrend in oil prices would signal inflationary pressures, potentially leading investors to seek inflation hedges like Bitcoin. However, the current price action in oil suggests that perhaps the market is pricing in a slowdown in demand or a resolution to geopolitical supply chain issues, which could have broader implications for inflation expectations and, consequently, for risk assets like Bitcoin.
The correlation between energy prices and Bitcoin is not always direct but can be influential through the lens of inflation and risk sentiment. A sharp drop in oil prices can sometimes be interpreted as a signal of weakening global economic growth, which could dampen risk appetite across all markets, including cryptocurrencies. Conversely, if the energy market's decline is seen as a sign of easing inflationary pressures, it might encourage central banks to adopt a more dovish stance, which would typically be supportive of risk assets. Currently, the DXY (Dollar Index) is showing a mixed picture. On the 1-hour chart, it's neutral, but the 4-hour shows a bearish signal, while the daily trend is strongly bullish at 99.32. This mixed DXY signal adds another layer of complexity. A strengthening dollar (as seen on the daily) usually exerts downward pressure on commodities and risk assets like BTCUSD, as it makes dollar-denominated assets more expensive for holders of other currencies. The fact that Bitcoin is holding its ground around $74,473 despite some dollar strength suggests underlying demand in the crypto market.
Examining the broader equity markets provides further context. The S&P 500 is trading higher at 6743.3, with a strong bullish trend on the 1-hour chart (93% strength), though the daily chart shows a bearish trend (100% strength). The Nasdaq 100 is also showing gains, trading at 24911.25, with a strong bullish 1-hour trend. This divergence between the short-term bullishness in equities and the bearish long-term daily trend suggests market participants are weighing immediate positive sentiment against underlying economic concerns. For Bitcoin, this environment is often favorable. When equities are showing signs of volatility or a potential trend reversal on longer timeframes, while shorter-term momentum remains positive, Bitcoin can sometimes act as a safe haven or a beneficiary of shifting capital flows seeking higher returns or diversification. The current $74,473 price point for BTCUSD is therefore being tested within a complex global macro environment.
On-Chain Metrics and Market Sentiment
Beyond the immediate price action and correlated markets, the health of the Bitcoin network itself provides crucial insights. While specific on-chain data like hash rate, active addresses, and whale movements are not provided in the live API feed for this article, their general trends are critical for a comprehensive BTCUSD analysis. A rising hash rate, for instance, indicates increasing network security and miner confidence, generally a bullish sign. Conversely, a declining hash rate could signal miner capitulation or reduced profitability, potentially leading to selling pressure. Active address counts offer a proxy for network usage and adoption; a steady or increasing number of active addresses is a positive fundamental indicator.
Whale movements - large holders accumulating or distributing Bitcoin - can significantly influence market sentiment and price. Tracking these large-scale transactions, often visible on blockchain explorers, can provide clues about institutional sentiment. A significant increase in outflows from exchanges, for example, could indicate that whales are moving their assets to cold storage, suggesting a long-term bullish conviction. Conversely, large inflows into exchanges might precede selling pressure. While we can't cite specific on-chain numbers here, the general principle remains: a healthy on-chain ecosystem typically supports a stable or rising BTCUSD price, especially around psychological levels like $74,473.
The development within the DeFi and NFT ecosystems also plays a role, albeit often secondary to Bitcoin's price action. A thriving DeFi sector with high Total Value Locked (TVL) and increasing gas fees can signal robust activity within the broader crypto space, indirectly benefiting Bitcoin. Similarly, innovation and adoption in the NFT market can attract new capital into the crypto ecosystem. Regulatory news, however, remains a significant overhang. Any clarity or, conversely, further crackdowns from major economies like the US, EU, or China can trigger sharp market reactions. Currently, without specific recent regulatory announcements, the market seems to be in a holding pattern, allowing price action and technicals to dictate short-term moves around the $74,473 level.
Bitcoin Dominance and Altcoin Correlations
Bitcoin's dominance – its market capitalization as a percentage of the total cryptocurrency market cap – is a key metric to watch. When Bitcoin dominance rises, it often signifies a 'flight to safety' within the crypto space, with capital flowing into the largest and most established cryptocurrency. This can occur during periods of heightened uncertainty or when altcoins are underperforming. Conversely, a falling Bitcoin dominance, especially during a bull run, can indicate that investors are rotating into altcoins in search of higher returns, a phenomenon often referred to as an 'altcoin season'. Currently, Bitcoin's dominance is a crucial factor to consider when assessing the overall health of the crypto market and the potential for BTCUSD to break its current range.
The correlation between Bitcoin and major altcoins like Ethereum (ETHUSD) is also noteworthy. ETHUSD is trading at $2,340.16, showing a mixed technical picture with a strong 1-hour bullish trend but a neutral daily trend. While ETHUSD exhibits its own fundamental drivers related to its ecosystem development (like staking yields and gas fees), its price action often moves in tandem with Bitcoin, albeit with potentially higher volatility. Understanding these correlations helps traders gauge the broader market sentiment and anticipate potential divergences or confirmations. If Bitcoin were to break decisively above $74,473 and hold, it would likely pull ETHUSD and other major altcoins higher, assuming their individual technical setups also align.
The Path Forward: What Traders Should Watch
For traders looking to navigate the current market around BTCUSD at $74,473, a clear strategy is paramount. The daily chart presents a compelling 'BUY' signal, supported by an RSI of 59.73 and positive MACD momentum. However, the overbought Stochastic oscillator and the neutral trend strength on the daily timeframe warrant caution. The key level to watch remains the resistance at $75,993. A decisive close above this level, ideally on increased volume, would confirm a bullish breakout and could signal the start of a new upward leg, potentially targeting higher levels. Confirmation would ideally come from a sustained move above this resistance, coupled with a cooling of the Stochastic oscillator or a continuation of the bullish MACD trend.
Conversely, the support level at $73,392 is critical. A break below this level, especially on significant selling pressure, would invalidate the bullish thesis and could trigger a sell-off towards the next support at $72,096.67. The ADX on the daily chart, while indicating a strong trend (27.62), doesn't specify the trend's direction in isolation; it merely confirms the presence of a trending market. Therefore, the price action relative to these key support and resistance levels will be the primary determinant of the short-to-medium term direction. Traders should be mindful of the conflicting signals from different timeframes and indicators, emphasizing the need for confirmation before committing to large positions.
The interplay between Bitcoin's technicals and the broader macro environment, particularly energy market movements and central bank policy expectations, cannot be overstated. While the current BTCUSD price hovers around $74,473, the underlying market dynamics are complex. The energy sector's volatility, coupled with mixed signals from DXY and equities, creates an environment where patience and risk management are key. The AI technical analysis suggests potential for upside, but the lack of a clear, sustained trend on all timeframes and the overbought Stochastic on the daily chart mean that a breakout above $75,993 needs to be confirmed. Until then, operating within a defined risk framework, and waiting for clear setups, is the most prudent approach. The market always offers opportunities; the key is to be prepared when they align.
Frequently Asked Questions: BTCUSD Analysis
What happens if BTCUSD breaks above the $75,993 resistance level?
A decisive break and sustained hold above $75,993, confirmed by increasing volume and bullish momentum across multiple timeframes, would likely signal a continuation of the uptrend. This could open the door for further price appreciation, potentially targeting the next significant resistance around $77,298.67. Confirmation from other indicators like RSI moving out of overbought territory or MACD maintaining positive momentum would strengthen this outlook.
Should I buy BTCUSD at current levels of $74,473 given the RSI is at 59.73 and Stochastic is overbought?
Buying at current levels requires caution due to the overbought Stochastic on the daily chart. While the RSI at 59.73 and positive MACD suggest underlying strength, it might be prudent to wait for a slight pullback towards support around $73,392 or confirmation of a breakout above $75,993. A high-probability setup would involve waiting for price action to confirm the direction rather than anticipating it.
Is the RSI at 59.73 a bullish or bearish signal for BTCUSD right now?
An RSI reading of 59.73 on the daily chart is generally considered neutral-to-bullish. It indicates that the asset is not yet overbought (typically considered above 70) and shows that buyers have maintained control during the recent upward move. However, it also suggests that there isn't extreme bullish momentum, leaving room for further upside before triggering potential overbought conditions.
How might the volatility in oil prices affect BTCUSD this week?
The current volatility in oil prices, despite a bearish short-term trend, creates broader market uncertainty. If falling oil prices lead to expectations of easing inflation, this could theoretically support risk assets like Bitcoin. However, if it signals weakening global demand, it might dampen risk appetite. Traders should monitor if BTCUSD decouples from this correlation or follows broader market sentiment, keeping an eye on key levels like $73,392 and $75,993.
Track markets in real-time
AI-powered analysis, technical indicators and real-time price data.
Join Our Telegram Channel
Breaking market news, AI analysis and trading signals instantly.
Join Channel